Case Study: Training Inc. System Design and Development Diagrams
VerifiedAdded on 2021/02/21
|13
|2797
|117
Case Study
AI Summary
This case study focuses on the information system development for Training Inc., a company that conducts training seminars. The assignment details the processes involved in seminar management, including booking, logistics, and sales. It presents various diagrams to illustrate the system's structure and behavior, such as class diagrams, ERD diagrams, state machine diagrams, sequence diagrams, activity diagrams, and a system architecture diagram. The case study covers the interactions between different departments, like the booking department, logistics coordinator, and sales manager, highlighting their roles and responsibilities. Furthermore, it outlines the user interface, testing, and deployment activities associated with the system. The diagrams provide insights into data modeling, system design, and the flow of information within the organization. This assignment aims to provide a comprehensive understanding of the system development process, from conceptualization to implementation and testing, offering a practical application of system design principles within a business context.

Case Study 2
Table of Contents
Table of Contents
Paraphrase This Document
Need a fresh take? Get an instant paraphrase of this document with our AI Paraphraser
INTRODUCTION...........................................................................................................................1
Overview.....................................................................................................................................1
Class Diagram............................................................................................................................2
ERD Diagram.............................................................................................................................3
State Machine Diagram.............................................................................................................5
Sequence Diagram.....................................................................................................................6
Activity Diagram........................................................................................................................7
System Architecture Diagram..................................................................................................8
User Interface.............................................................................................................................9
Testing & Deployment Activities............................................................................................10
Conclusion.....................................................................................................................................10
INTRODUCTION
The activity in which work processes are facilitated through introduction of new socio-
technical information system for modification as well as expansion of existing services is
referred to as information system development. The methodologies that are being utilised for
forming, planning as well as controlling processes for development of information system are
referred to as system development approaches. Data modelling is defined as a process that is
being used for documentation of complex software system designs for representing data for flow.
User and system interface provides a platform for user to make use of systems as per their
requirements. The process of testing levels of software where the complete testing is carried out
for evaluation of compliance of system through specific needs is referred to system testing.
Deployment & testing denotes all activities that are liable for making system available for
utilisation. This assignment contains diagrams for class, entity relationship, state machine,
sequence, activity, system architecture and user interface. In addition to this appropriate testing
along with deployment activities are planned.
Overview
This assignment is based on Training Inc. that is liable for carrying out training seminars.
For each individual seminar, logistic department is liable for ensuring arrangements with respect
to this like meeting facilities, shipment of training materials and consultants traveling. The
details associated with this have been specified below with respect to each seminar that has been
carried out by them:
Booking department notify logistic coordinator about the seminar and details
associated with this. Later will arrange all the facilities within scheduled city.
Logistic coordinator will share details about seminar with sales manager to provide
certain facilities. They both coordinate with each other on the basis of information
provided on logistic database.
Negotiations will be carried out in between them and its copy of agreements will be with
each other. If any alterations will be made, then specified modifications will be made on
agreements.
Coordinator will check the details within logistic database and contact about that with
consultant as well as written confirmation will be provided for the same.
1
⊘ This is a preview!⊘
Do you want full access?
Subscribe today to unlock all pages.
Trusted by 1+ million students worldwide
Before seminar is being conducted coordinator will identify all the details. It entirely
depends on kind of seminar it is and accordingly equipment’s will be allocated.
On the basis of this information various diagrams have been illustrated to clearly understand
their concept.
Class Diagram
A static structure diagram that is being utilised for describing system structure by
illustrating system’s classes, characteristics (attributes), methods (operations) as well as
relationship in between objects is defined as a class diagram. Generally, it is a building block that
is being utilised as a building block within object-oriented modelling as well as conceptual
modelling of applications structure for detailed modelling of the models into a programming
code. It is being utilised for visualisation, description as well as documentation of various aspects
related with system and construction of executable codes. Basically, it denotes gathering of
classes, associations, collaborations, constraints and interfaces. This is also referred to structural
diagram. They are mapped with object oriented languages thereby; they are being utilised while
construction time. Class diagrams can be used for carrying out analysis along with design of
static view of application, description of responsibilities that are being carried out by a system,
base for component as well as deployment diagrams and also within reverse & forward
engineering. While construction of class diagrams, following points are taken into consideration:
Class name must be meaningful and must illustrate all the aspects of system like logistics,
seminar, coordinator, etc.
The relationship in between entities must be clearly stated like each individual seminar
has independent logistics department.
Attributes along with operations needs to be clearly stated and for each class there needs
to be specified number of properties otherwise it will lead to complications.
2
Paraphrase This Document
Need a fresh take? Get an instant paraphrase of this document with our AI Paraphraser
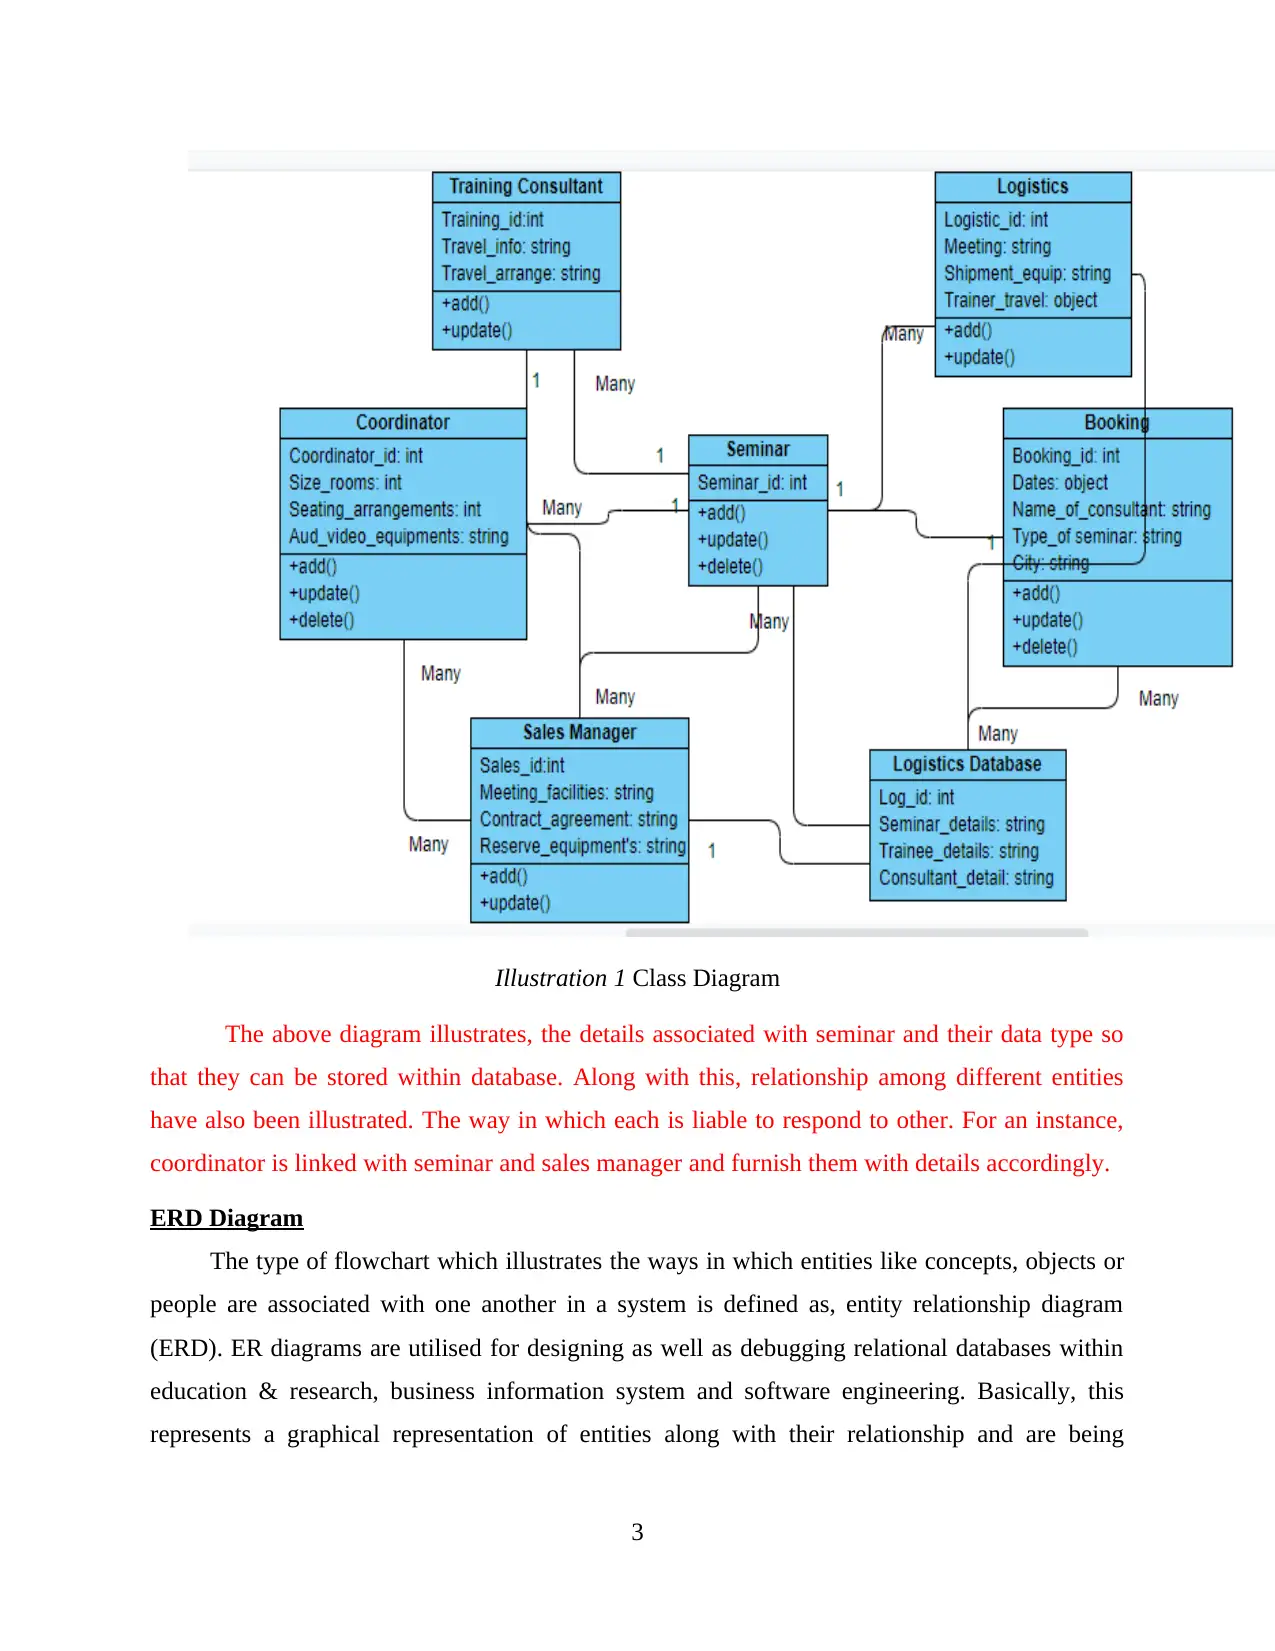
Illustration 1 Class Diagram
The above diagram illustrates, the details associated with seminar and their data type so
that they can be stored within database. Along with this, relationship among different entities
have also been illustrated. The way in which each is liable to respond to other. For an instance,
coordinator is linked with seminar and sales manager and furnish them with details accordingly.
ERD Diagram
The type of flowchart which illustrates the ways in which entities like concepts, objects or
people are associated with one another in a system is defined as, entity relationship diagram
(ERD). ER diagrams are utilised for designing as well as debugging relational databases within
education & research, business information system and software engineering. Basically, this
represents a graphical representation of entities along with their relationship and are being
3
utilised for computing with respect to data of organisation that is stored within database. The
relationship among them can vary, it is being shown below:
One-to-one: This denotes that one entity is related with one instance of other entity. For
an instance in this case, each seminar has their own requirements, this means that there
exists one to one relationship as individual have unique needs.
One-to-many: In this case, one instance is related either 0, 1 or many instances of other
entity but in case of opposite there exist only one instance. For an example, sales
manager has to respond to coordinator as well as carry out agreement with contract and
also coordinate with other persons involved within training. On the other hand,
coordinator shares one to many relationships which denotes they give directions to others
in the way they have to carry out their operations.
Many-to many: Here, one instance of entity is related with either zero, one or different
instances of other entity. This can be understood from an example from same case, i.e.
logistic department is responsible for furnishing details to training consultant, sales
manager and schedule of seminars. On either side, instances of sales manager are linked
with contractor, logistics and also with consultant of training.
They are specified by the usage of symbols like diamonds, ovals, rectangles as well as
connecting lines for depicting relationship in between attributes, relationship and entities.
4
⊘ This is a preview!⊘
Do you want full access?
Subscribe today to unlock all pages.
Trusted by 1+ million students worldwide
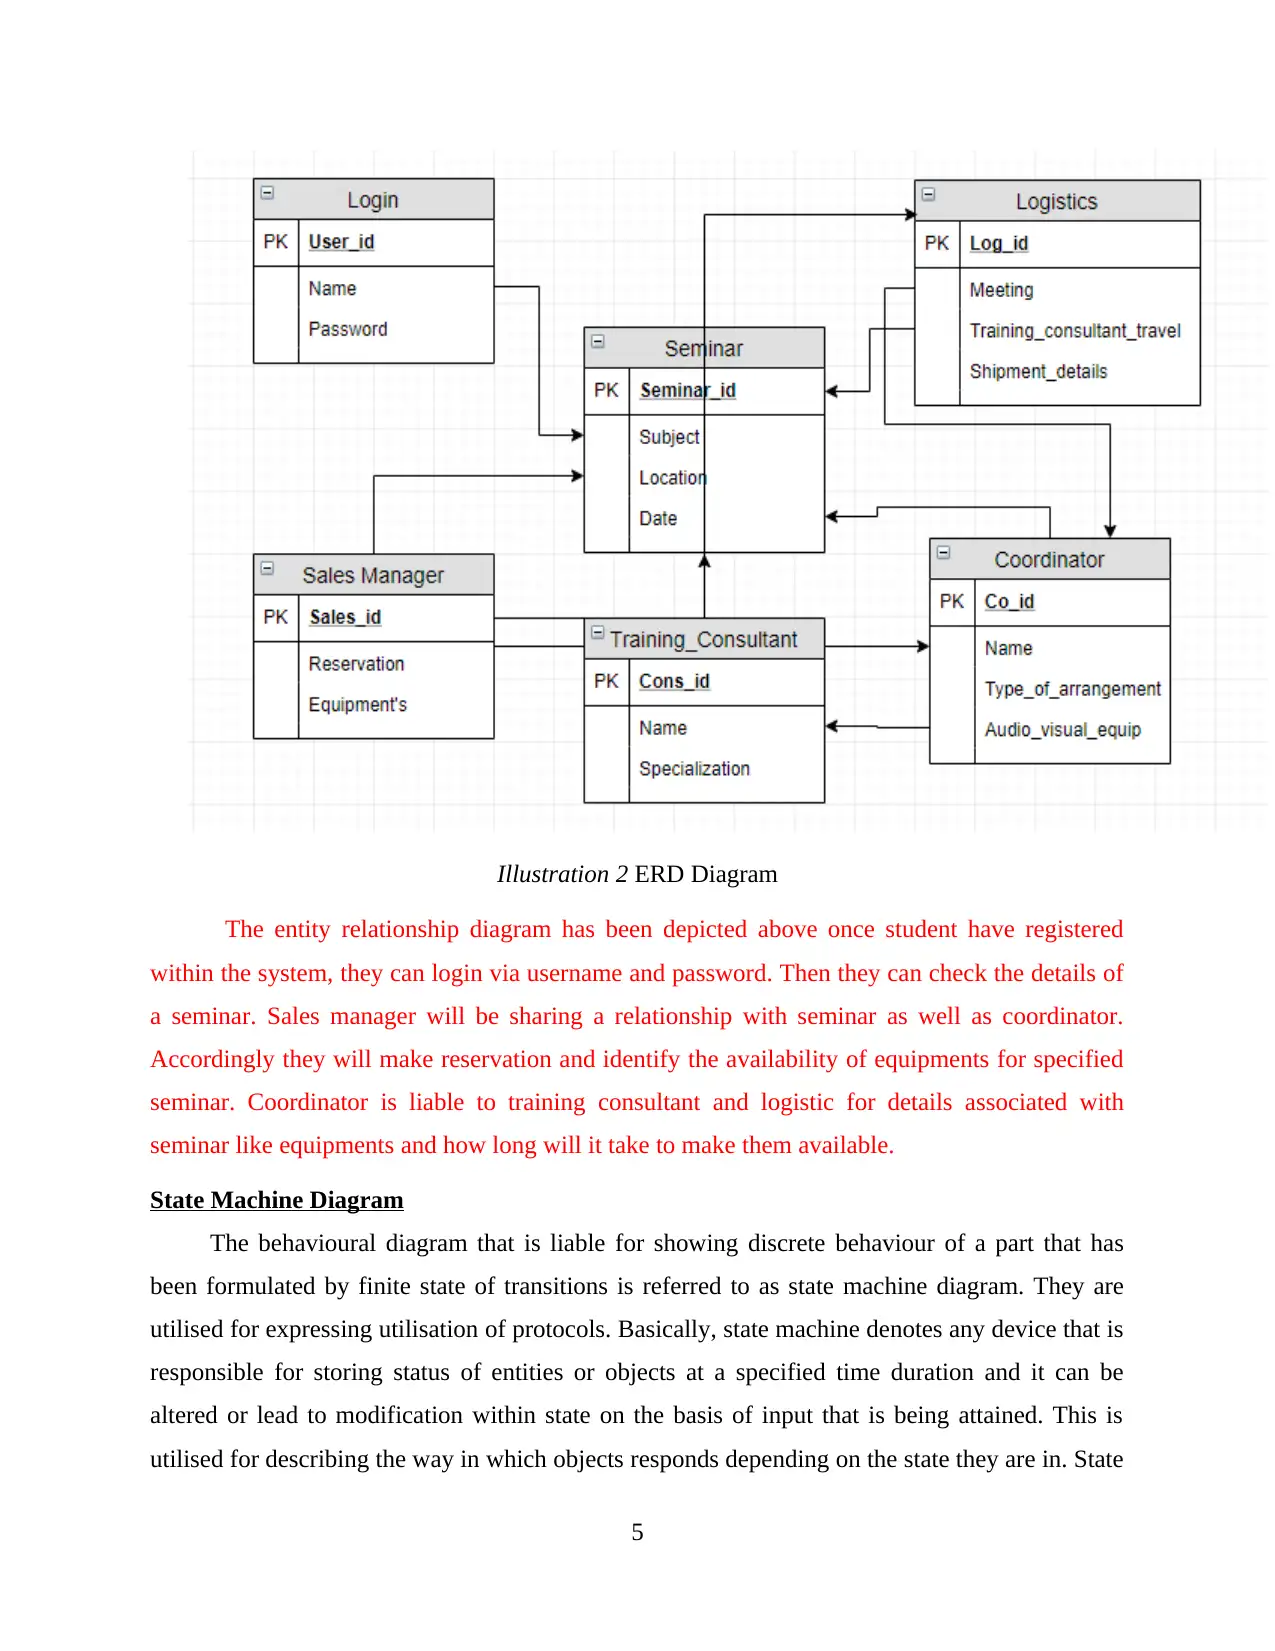
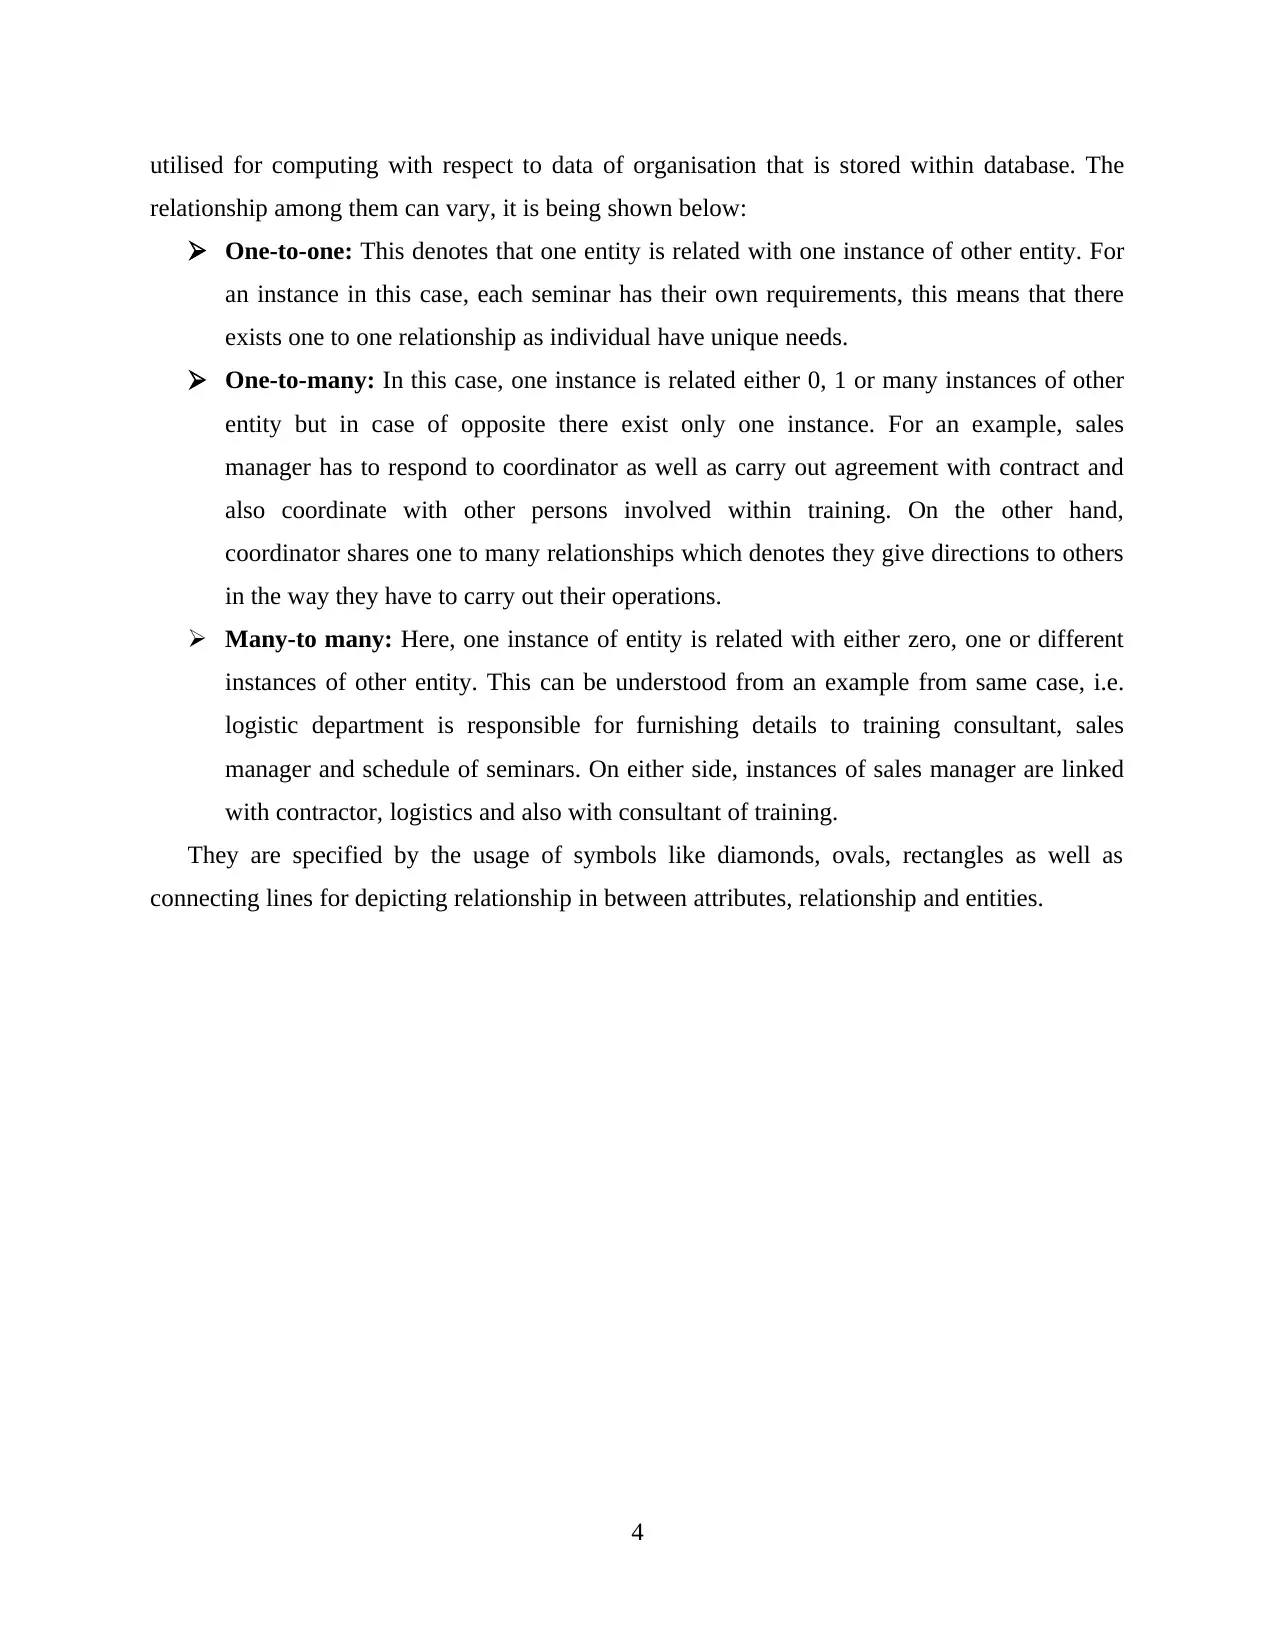
Illustration 2 ERD Diagram
The entity relationship diagram has been depicted above once student have registered
within the system, they can login via username and password. Then they can check the details of
a seminar. Sales manager will be sharing a relationship with seminar as well as coordinator.
Accordingly they will make reservation and identify the availability of equipments for specified
seminar. Coordinator is liable to training consultant and logistic for details associated with
seminar like equipments and how long will it take to make them available.
State Machine Diagram
The behavioural diagram that is liable for showing discrete behaviour of a part that has
been formulated by finite state of transitions is referred to as state machine diagram. They are
utilised for expressing utilisation of protocols. Basically, state machine denotes any device that is
responsible for storing status of entities or objects at a specified time duration and it can be
altered or lead to modification within state on the basis of input that is being attained. This is
utilised for describing the way in which objects responds depending on the state they are in. State
5
Paraphrase This Document
Need a fresh take? Get an instant paraphrase of this document with our AI Paraphraser
refers to a stage within behaviour or evolution of an object that is represented as an entity within
a unit of code or a program. State machine diagrams are utilised for listing events that are liable
for modifications in states of system, modelling of a dynamic behaviour along with activities of a
system, acknowledgement of system response to diverse types of stimuli that exist within a
system, representation of finite state machines in a graphical manner and visualisation of
complete lifecycle of objects.
Illustration 3 State Machine Diagram
The diagram illustrated above shows that seminar has been proposed and it is scheduled.
Until when schedule is open then students can enrol for this, and if seats are filled then
registration cannot be carried out. They will be added in waiting list so that if in any case anyone
takes back their name then the individual at top of the list can apply for it. Then the enrolment
will be closed.
Sequence Diagram
The interactive diagrams which furnish details related with ways in which activities or
operations are being carried out is referred to as sequence diagram. They are liable for focusing
on time as well as they show the order in which interactions are being carried out through the
usage of vertical axis that are used for representation of time in context of what messages are
delivered and when they have transmitted. Generally, sequence diagrams are responsible for
capturing communication which occurs in collaboration. Along with this, high-level interaction
among system user and other systems or sub-systems is captured. They are being used for
visualisation and validation of runtime scenarios that are responsible for predicting the ways in
6
which system behave as well as find out responsibilities a class have with respect to process
modelling. Sequence diagrams are being utilised for modelling higher levels of interaction
among active objects within a system as well as instances of objects by collaboration with use
cases and objects.
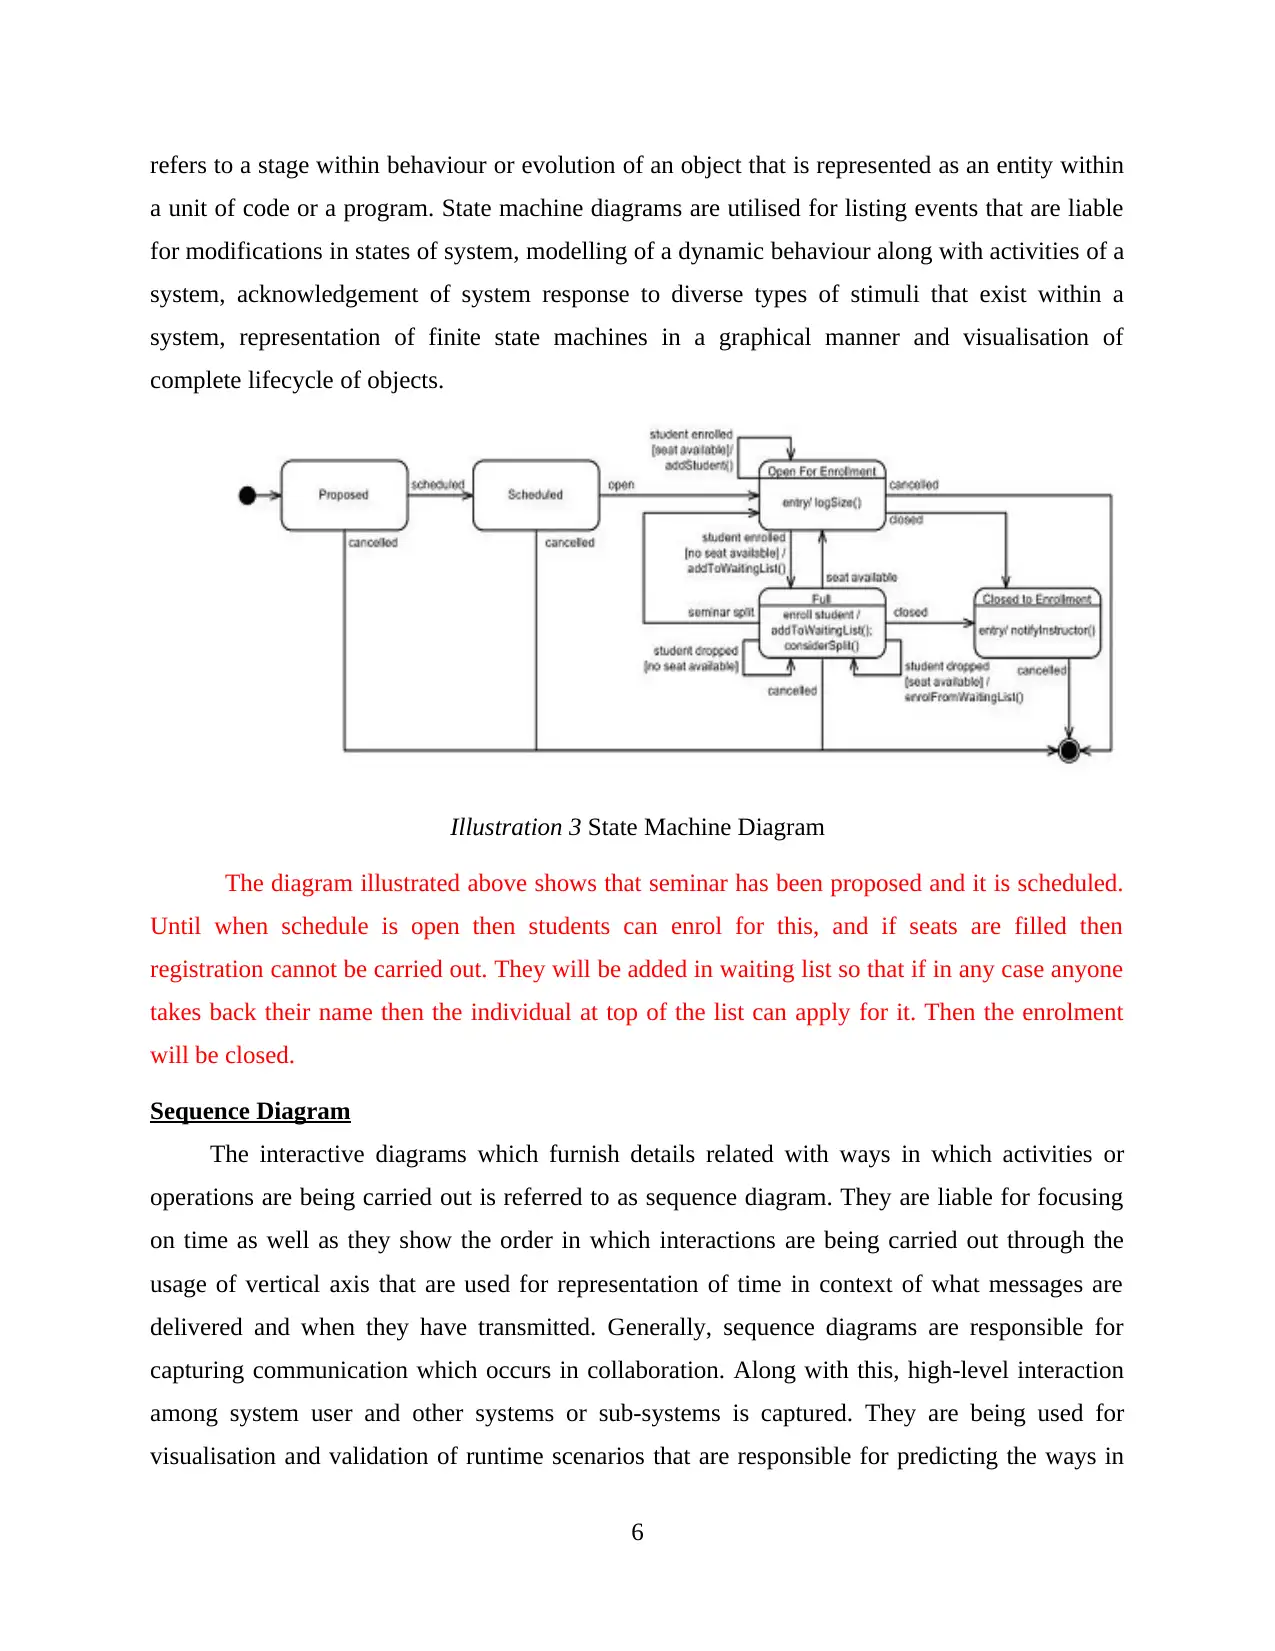
Illustration 4 Sequence Diagram
Sequence diagram is illustrated above which involves enrolment for seminar and whether
student or customer is eligible for this as per their qualification, the schedule has been created for
this and it will be identified that whether they fits within this or not and what will be the fees
accordingly. For an instance, if student is of college then cost will be different & if they are
industry personal then it will be different.
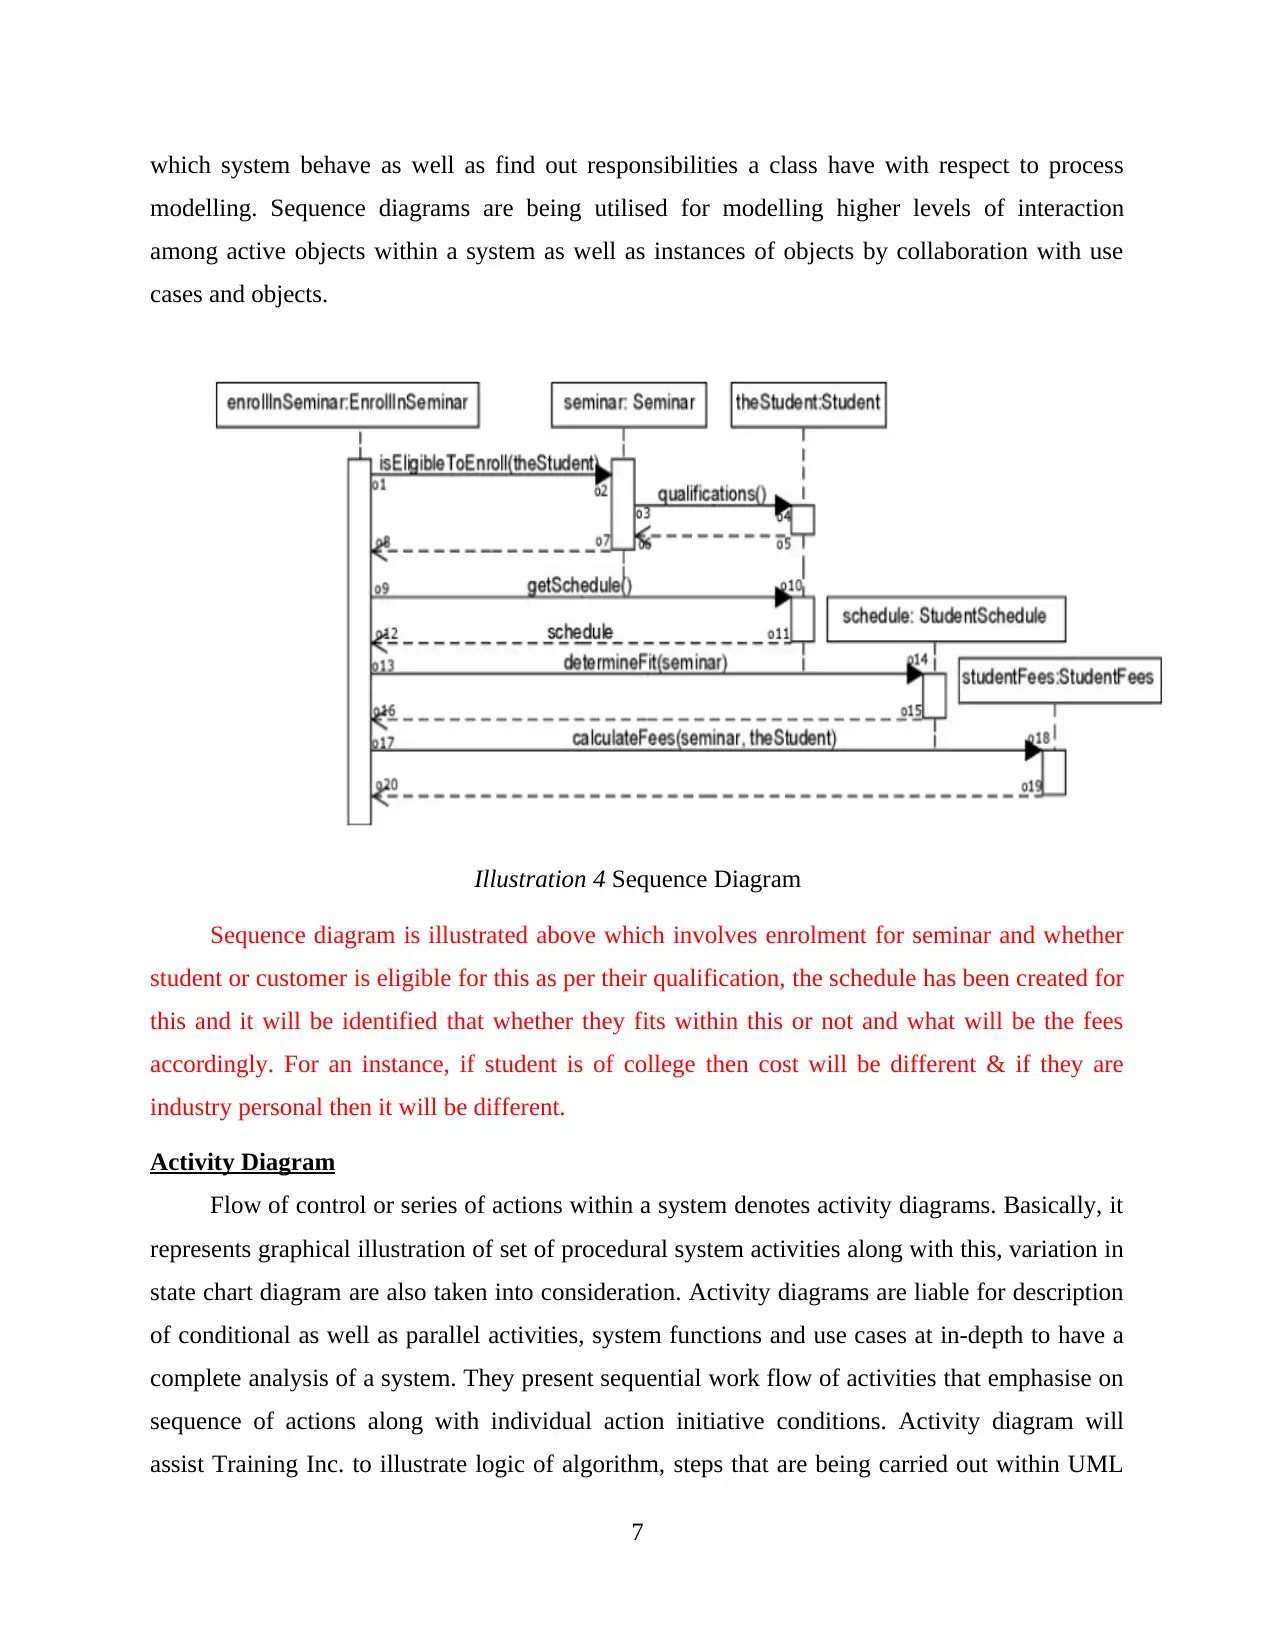
Activity Diagram
Flow of control or series of actions within a system denotes activity diagrams. Basically, it
represents graphical illustration of set of procedural system activities along with this, variation in
state chart diagram are also taken into consideration. Activity diagrams are liable for description
of conditional as well as parallel activities, system functions and use cases at in-depth to have a
complete analysis of a system. They present sequential work flow of activities that emphasise on
sequence of actions along with individual action initiative conditions. Activity diagram will
assist Training Inc. to illustrate logic of algorithm, steps that are being carried out within UML
7
modelling. Sequence diagrams are being utilised for modelling higher levels of interaction
among active objects within a system as well as instances of objects by collaboration with use
cases and objects.
Illustration 4 Sequence Diagram
Sequence diagram is illustrated above which involves enrolment for seminar and whether
student or customer is eligible for this as per their qualification, the schedule has been created for
this and it will be identified that whether they fits within this or not and what will be the fees
accordingly. For an instance, if student is of college then cost will be different & if they are
industry personal then it will be different.
Activity Diagram
Flow of control or series of actions within a system denotes activity diagrams. Basically, it
represents graphical illustration of set of procedural system activities along with this, variation in
state chart diagram are also taken into consideration. Activity diagrams are liable for description
of conditional as well as parallel activities, system functions and use cases at in-depth to have a
complete analysis of a system. They present sequential work flow of activities that emphasise on
sequence of actions along with individual action initiative conditions. Activity diagram will
assist Training Inc. to illustrate logic of algorithm, steps that are being carried out within UML
7
⊘ This is a preview!⊘
Do you want full access?
Subscribe today to unlock all pages.
Trusted by 1+ million students worldwide
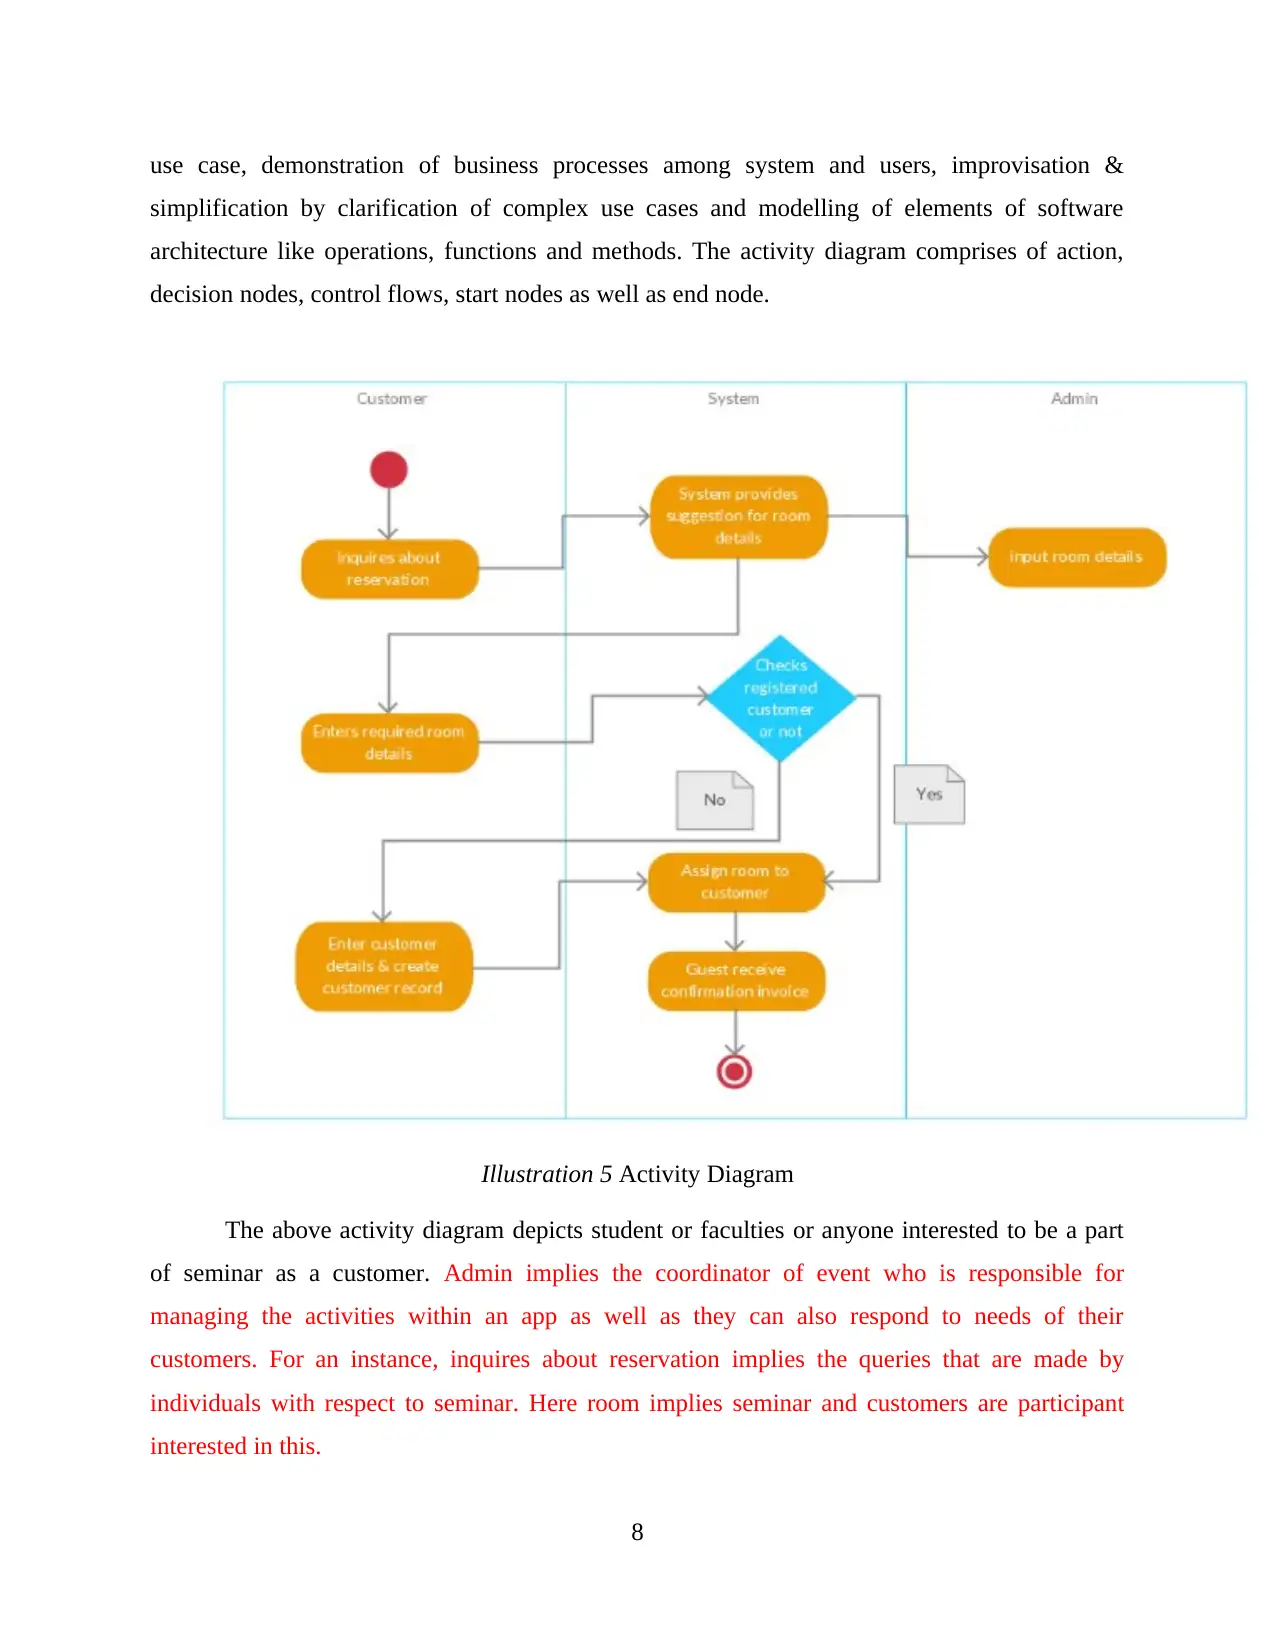
use case, demonstration of business processes among system and users, improvisation &
simplification by clarification of complex use cases and modelling of elements of software
architecture like operations, functions and methods. The activity diagram comprises of action,
decision nodes, control flows, start nodes as well as end node.
Illustration 5 Activity Diagram
The above activity diagram depicts student or faculties or anyone interested to be a part
of seminar as a customer. Admin implies the coordinator of event who is responsible for
managing the activities within an app as well as they can also respond to needs of their
customers. For an instance, inquires about reservation implies the queries that are made by
individuals with respect to seminar. Here room implies seminar and customers are participant
interested in this.
8
Paraphrase This Document
Need a fresh take? Get an instant paraphrase of this document with our AI Paraphraser
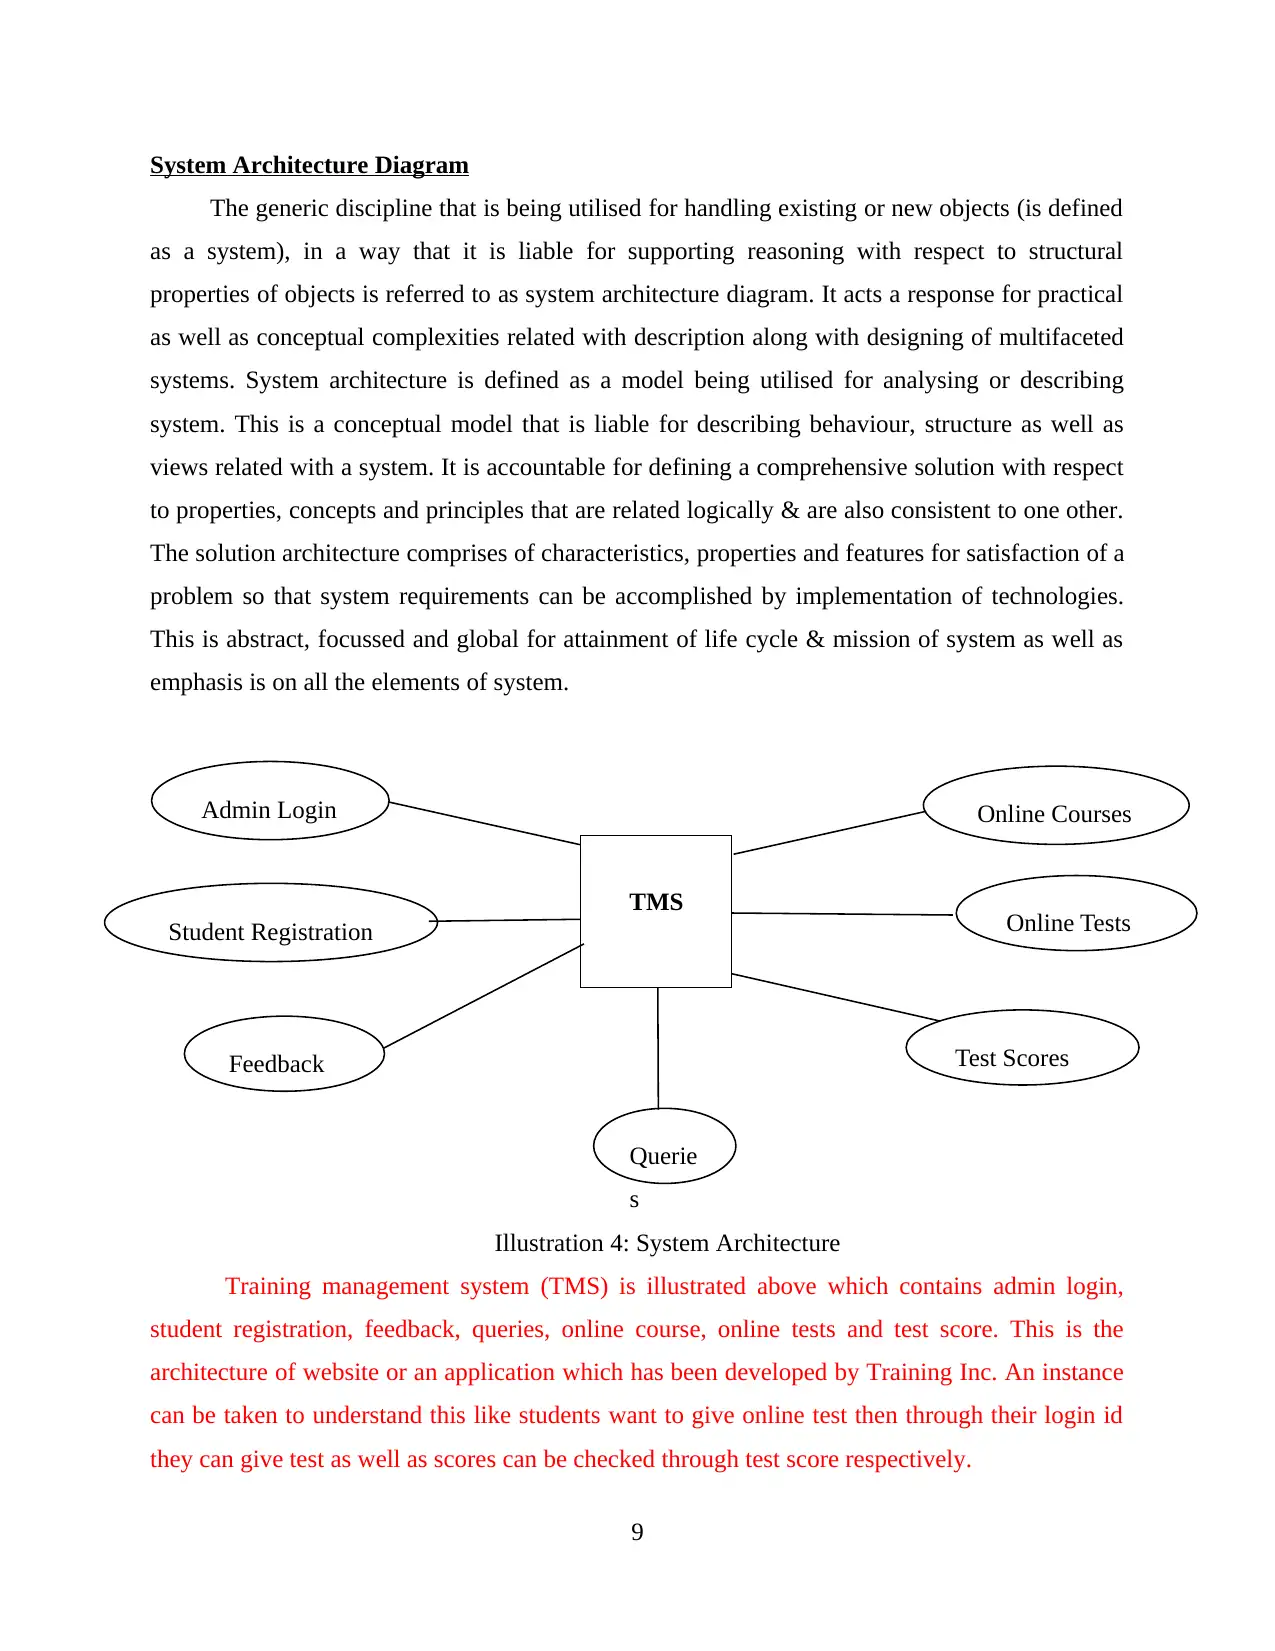
System Architecture Diagram
The generic discipline that is being utilised for handling existing or new objects (is defined
as a system), in a way that it is liable for supporting reasoning with respect to structural
properties of objects is referred to as system architecture diagram. It acts a response for practical
as well as conceptual complexities related with description along with designing of multifaceted
systems. System architecture is defined as a model being utilised for analysing or describing
system. This is a conceptual model that is liable for describing behaviour, structure as well as
views related with a system. It is accountable for defining a comprehensive solution with respect
to properties, concepts and principles that are related logically & are also consistent to one other.
The solution architecture comprises of characteristics, properties and features for satisfaction of a
problem so that system requirements can be accomplished by implementation of technologies.
This is abstract, focussed and global for attainment of life cycle & mission of system as well as
emphasis is on all the elements of system.
Illustration 4: System Architecture
Training management system (TMS) is illustrated above which contains admin login,
student registration, feedback, queries, online course, online tests and test score. This is the
architecture of website or an application which has been developed by Training Inc. An instance
can be taken to understand this like students want to give online test then through their login id
they can give test as well as scores can be checked through test score respectively.
9
Online CoursesAdmin Login
Online Tests
Test ScoresFeedback
Student Registration
Querie
s
TMS
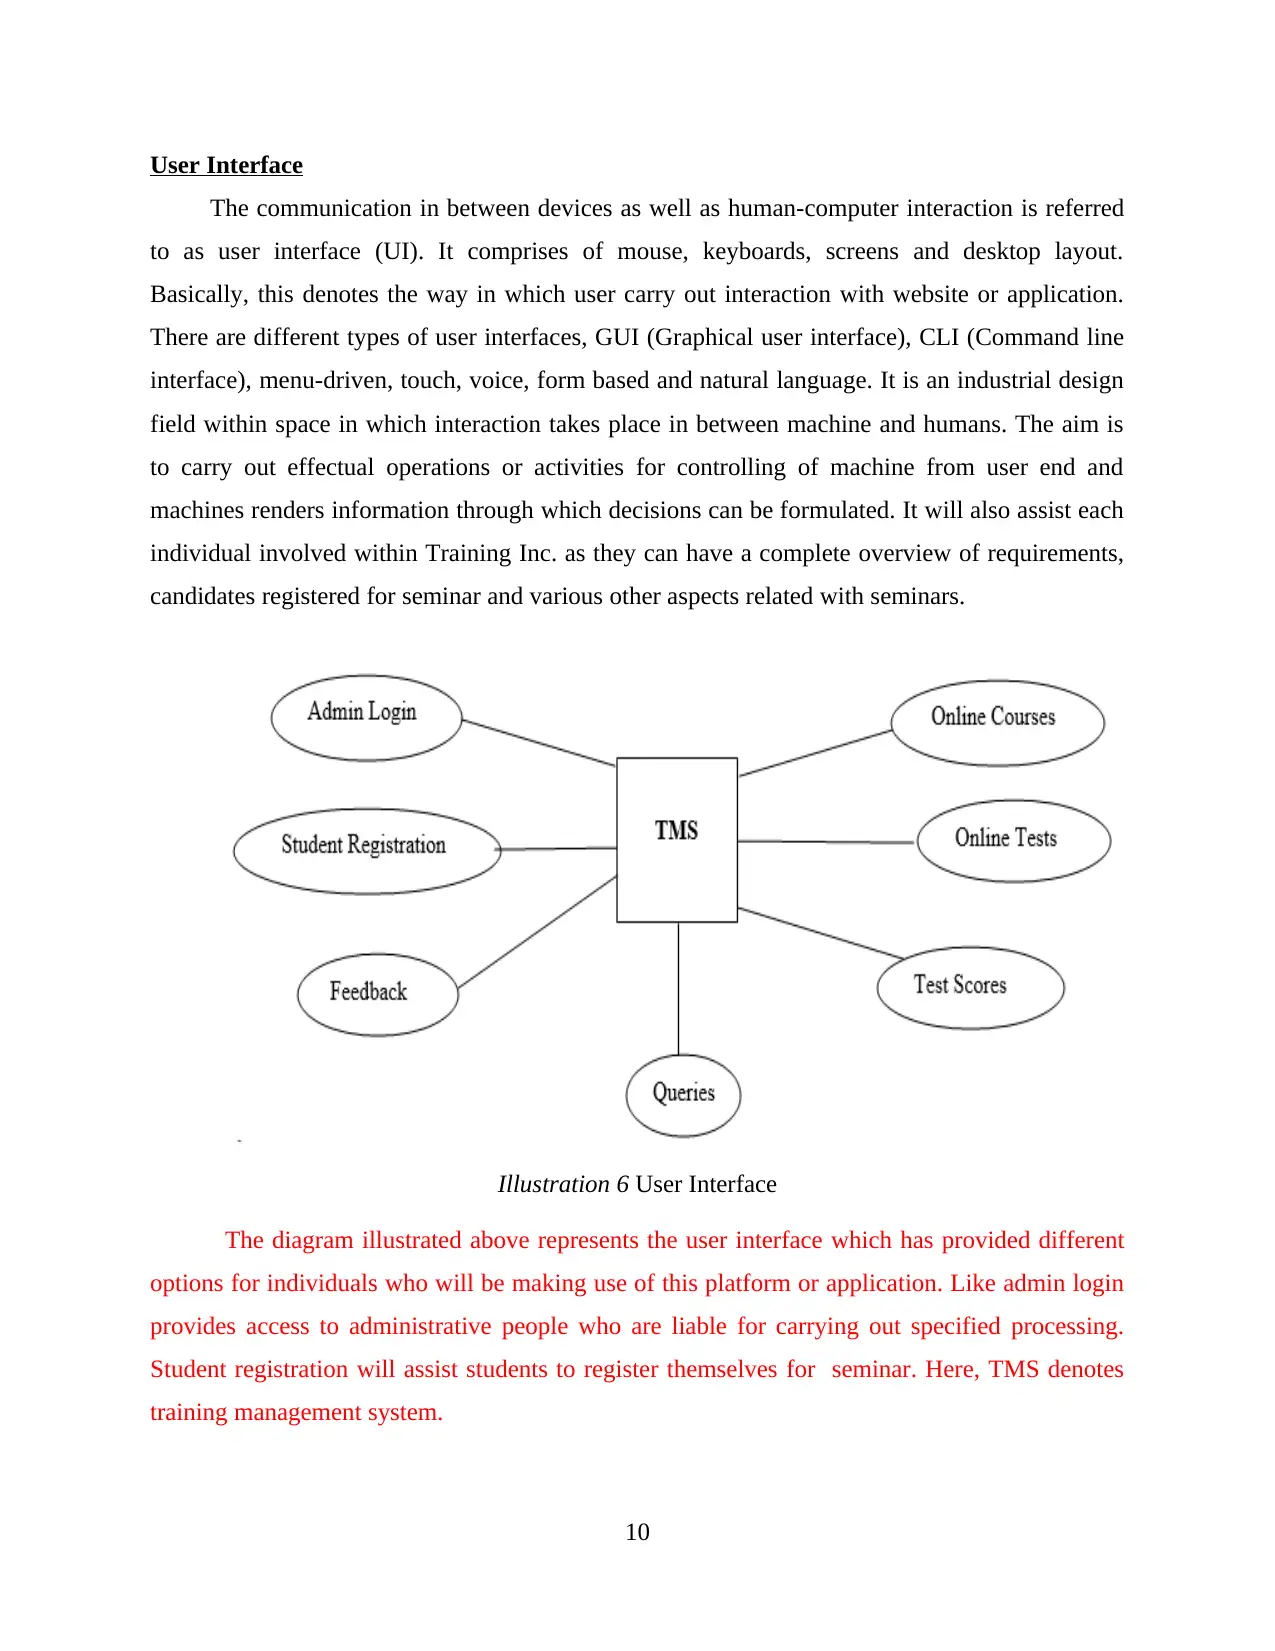
User Interface
The communication in between devices as well as human-computer interaction is referred
to as user interface (UI). It comprises of mouse, keyboards, screens and desktop layout.
Basically, this denotes the way in which user carry out interaction with website or application.
There are different types of user interfaces, GUI (Graphical user interface), CLI (Command line
interface), menu-driven, touch, voice, form based and natural language. It is an industrial design
field within space in which interaction takes place in between machine and humans. The aim is
to carry out effectual operations or activities for controlling of machine from user end and
machines renders information through which decisions can be formulated. It will also assist each
individual involved within Training Inc. as they can have a complete overview of requirements,
candidates registered for seminar and various other aspects related with seminars.
Illustration 6 User Interface
The diagram illustrated above represents the user interface which has provided different
options for individuals who will be making use of this platform or application. Like admin login
provides access to administrative people who are liable for carrying out specified processing.
Student registration will assist students to register themselves for seminar. Here, TMS denotes
training management system.
10
⊘ This is a preview!⊘
Do you want full access?
Subscribe today to unlock all pages.
Trusted by 1+ million students worldwide
1 out of 13
Related Documents


Your All-in-One AI-Powered Toolkit for Academic Success.
+13062052269
info@desklib.com
Available 24*7 on WhatsApp / Email
![[object Object]](/_next/static/media/star-bottom.7253800d.svg)
Unlock your academic potential
Copyright © 2020–2026 A2Z Services. All Rights Reserved. Developed and managed by ZUCOL.