Transfer Pricing Analysis and Airline Pricing Strategy Report

Verified

Added on  2021/06/14

|10
|1461
|46
Report
AI Summary
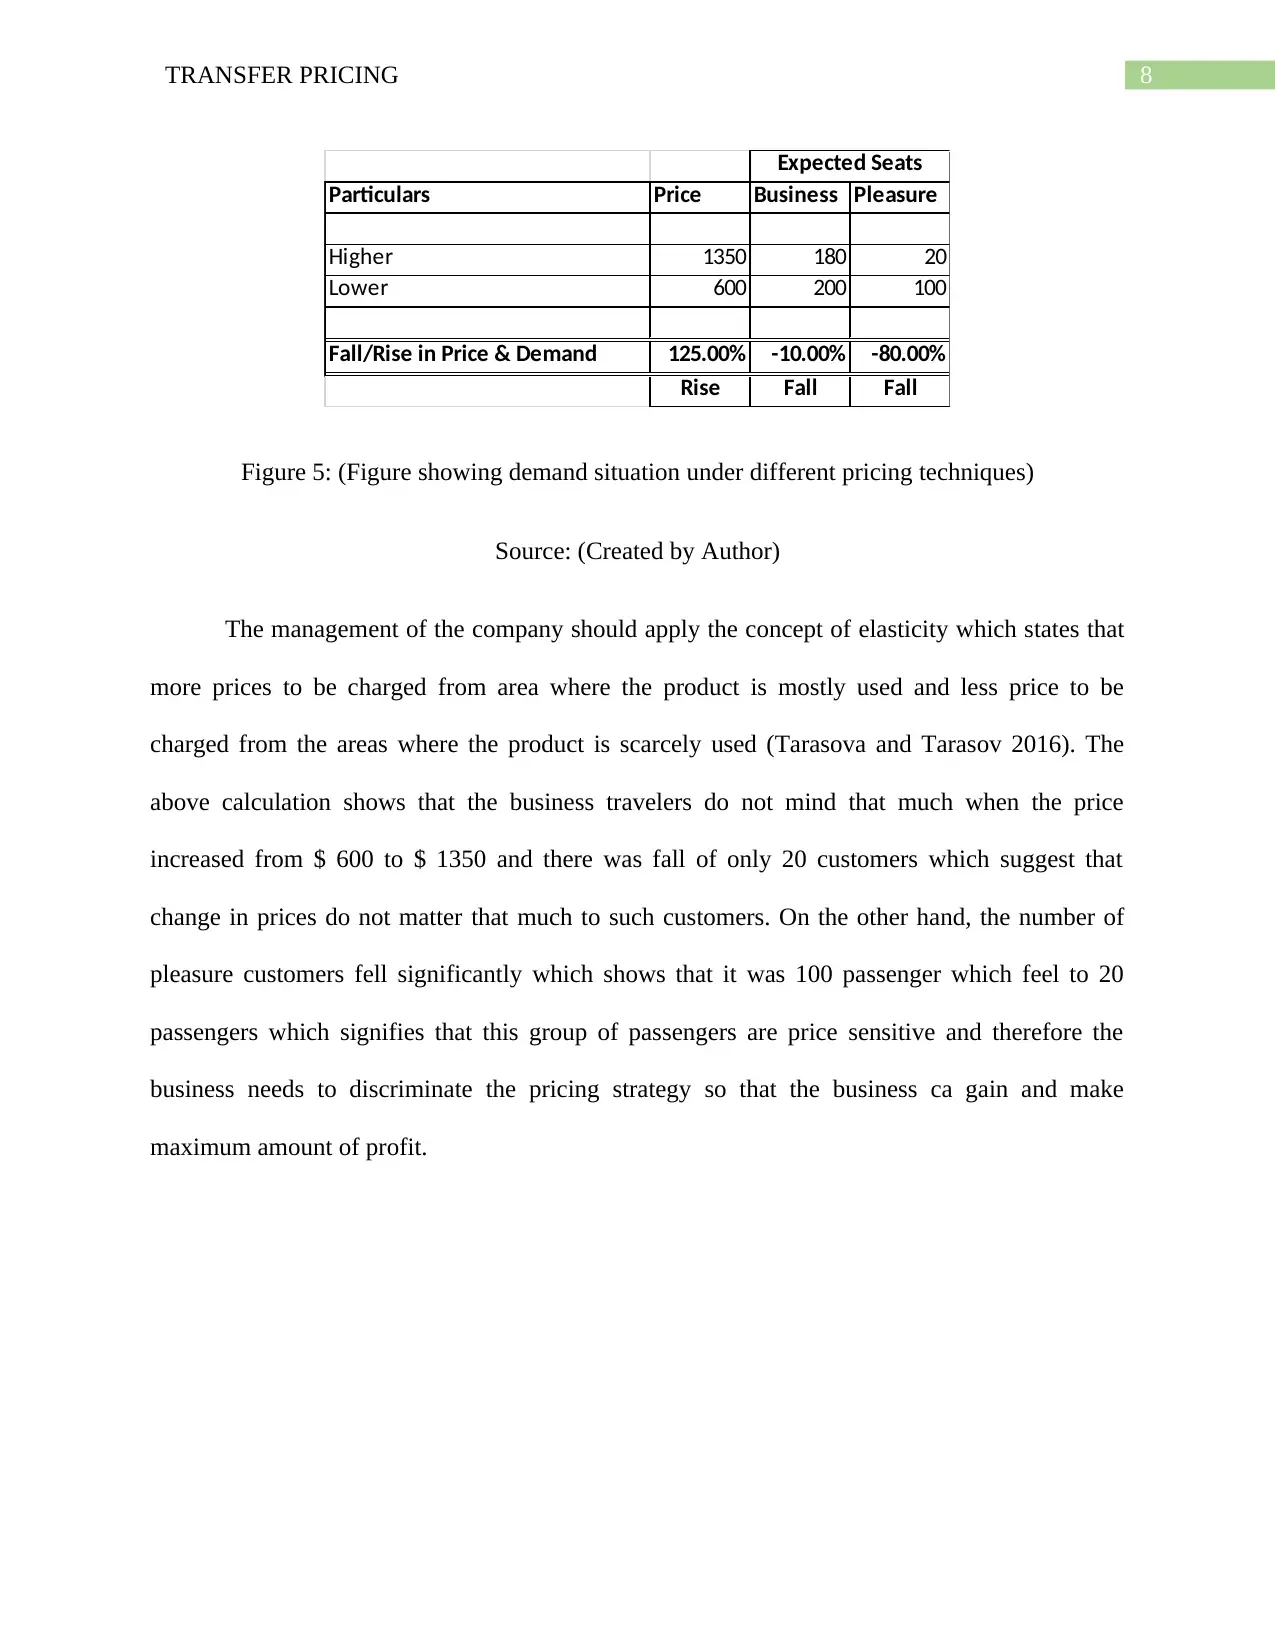
This report delves into transfer pricing and airline pricing strategies, analyzing financial data from Derwent Ltd and Eastcoast Airways. The analysis calculates after-tax operating profits under different transfer pricing scenarios, comparing market rates and their impact on profitability. It also examines how import duties and income taxes are affected by transfer pricing choices. For Eastcoast Airways, the report explores the impact of different pricing strategies on passenger demand, contribution margins, and overall profitability. The report applies elasticity concepts to optimize pricing for business and pleasure travelers, aiming to maximize revenue. Calculations and figures are provided to support the findings, offering insights into financial decision-making and strategic pricing approaches. The report provides a detailed analysis of how different pricing models can affect the profitability of a business. The report also provides various figures to make an effective decision.
Document Page
Running head: TRANSFER PRICING
Transfer Pricing
Name of the Student:
Name of the University:
Author’s Note:
tabler-icon-diamond-filled.svg

Secure Best Marks with AI Grader

Need help grading? Try our AI Grader for instant feedback on your assignments.
Document Page
1TRANSFER PRICING
Table of Contents
Scenario 1a.......................................................................................................................................2
Part 1............................................................................................................................................2
Part 2............................................................................................................................................4
Scenario 1b......................................................................................................................................5
Part 1............................................................................................................................................5
Part 2............................................................................................................................................6
Part 3............................................................................................................................................6
Scenario 2........................................................................................................................................6
Reference.........................................................................................................................................9
Document Page
2TRANSFER PRICING
Scenario 1a
Part 1
As per this scenario, the after tax operating profit of Derwent ltd is to be calculated which
is engaged in telecommunication equipment manufacture and has number of divisions across the
world (Rugman and Eden 2017). As per this the question which is provided in the scenario, the
calculation is done for the Australian and US division. The calculation is shown below:
1) After Tax Operating Profit:
a) At Full Manufacturing Cost:
Particulars
Australia
Division USA Division
Nos. of Units Sold 10000 10000
Selling Price per Unit $800 $1,150
Total Sales Revenue $80,00,000 $115,00,000
Variable Cost per unit $550
Fixed Manufacturing Cost per unit $250
Total Manufacturing Cost/Transfer
Cost per unit $800 $800
Total Variable Cost $55,00,000
Total Fixed Cost $25,00,000
Total Trasfer Cost $80,00,000
US Import Duty $12,00,000
Total Operating Cost $80,00,000 $92,00,000
Net Operating Profit $0 $23,00,000
Less: Income Tax $0 $9,20,000
After Tax Operating Profit $0 $13,80,000
NET PROFIT $13,80,000
Figure 1: (Figure showing after tax profit operating profit for Australian and US Division)
Document Page
3TRANSFER PRICING
Source: (Created by Author)
As seen from the above calculation, the Australian division sold the product B12 at a
transfer price rate of $ 800 which is equal to the variable and fixed costs which are incurred by
the business. Therefore, the Australian division is unable to generate any profits. In the case of
US division, the selling price rate for the product is $ 1,150 and the division is able to generate a
net profit of $ 13,80,000.
b. At market price rate
b) At Market Price of Comparable Imports:
Particulars
Australia
Division USA Division
Nos. of Units Sold 10000 10000
Selling Price per Unit $950 $1,150
Total Sales Revenue $95,00,000 $115,00,000
Variable Cost per unit $550
Fixed Manufacturing Cost per unit $250
Total Manufacturing Cost/Transfer
Cost per unit $800 $950
Total Variable Cost $55,00,000
Total Fixed Cost $25,00,000
Total Trasfer Cost $95,00,000
US Import Duty $14,25,000
Total Operating Cost $80,00,000 $109,25,000
Net Operating Profit $15,00,000 $5,75,000
Less: Income Tax $0 $2,30,000
After Tax Operating Profit $15,00,000 $3,45,000
NET PROFIT $18,45,000
Figure 2: (Figure showing after tax profit operating profit for Australian and US Division)
tabler-icon-diamond-filled.svg

Secure Best Marks with AI Grader

Need help grading? Try our AI Grader for instant feedback on your assignments.
Document Page
4TRANSFER PRICING
Source: (Created by Author)
As shown in the above figure, if the Australian division is able to transfer the product at
the market price rate than the business will have be able to generate certain amount of profits
which comes to $ 15,00,000. The US division will be able to generate a profit of $ 5,75,000. In
this situation the comparative profit of the business is higher as compared to when the transfer
price was $ 800.
Part 2
As per the calculations which is shown in Part 1, it can be clearly identified that the
import duty and income tax expenses is lower in the case when the transfer price rate is
according to comparative market rate (Cristea and Nguyen 2016). Therefore, Derwent ltd should
select the market transfer pricing rate which is shown as $ 1,150 as the net income tax charged
and import duty is minimum in this case.
Document Page
5TRANSFER PRICING
Scenario 1b
Part 1
Scenario 1.b:
Particulars
Australia
Division USA Division
Nos. of Units Sold 10000 10000
Selling Price per Unit $900 $900
Total Sales Revenue $90,00,000 $90,00,000
Variable Cost per unit $550
Fixed Manufacturing Cost per unit $250
Total Manufacturing Cost/Transfer
Cost per unit $800 $800
Total Variable Cost $55,00,000
Total Fixed Cost $25,00,000
Total Trasfer Cost $80,00,000
US Import Duty $12,00,000
Total Operating Cost $80,00,000 $92,00,000
Net Operating Profit $10,00,000 -$2,00,000
Less: Income Tax $3,50,000 $0
After Tax Operating Profit $6,50,000 -$2,00,000
NET PROFIT $4,50,000
Figure 3: (Figure showing Net profit for Australian and US Division)
Source: (Created by Author)
If the product is sold in Australia than the business will be able to generate profit on an
overall basis. The US division will be incurring losses due to the transfer price of the business.
Document Page
6TRANSFER PRICING
Part 2
In the case when the departmental manager of Australia is looking to maximize the profit
which is earned by the divisions than the division is Australia would like to transfer the product
to US division at the market rate which is shown to be $ 1,150. This step would be taken by the
departmental manager as this will ensure that the profitability of the business increases (Huh and
Park 2013).
Part 3
As per the above calculations, the minimum transfer price that the manager of division
Australia will considered as appropriate is shown in figure 3 which is $ 900. At this price the
business is able to generate a profit which is of $ 6,50,000. In this transfer price case, the
combine expenses of import duty and income tax comes to $ 15,50,000 which is lees than what
the business had to incur in market rate transfer price of $ 950 which had a combined expense of
$ 16,55,000 (Holtzman and Nagel 2014).
Scenario 2
To,
The Directors of Eastcoast Airways,
Date: 17/05/2018
Subject: Airline pricing strategy
As per the information which is obtained from Eastcoast Airways and the able which is
shown below, if the price charged by the business is kept at $ 600 than the number of passenger
tabler-icon-diamond-filled.svg

Paraphrase This Document

Need a fresh take? Get an instant paraphrase of this document with our AI Paraphraser
Document Page
7TRANSFER PRICING
which the business will be getting for business class is 200 and the number of passenger which
are there for pleasure class flights is 100. On the other hand, if the business charges $ 1350 as the
price than the number of passengers will decrease considerably in business class and also in the
pleasure class of flights. The calculations of the two different pricing strategies is shown below
in calculations (Nagle, Hogan and Zale 2016).
Particulars Business Pleasure Business Pleasure
Price Charged $600 $600 $1,350 $1,350
Variable Cost $65 $65 $150 $150
Contribution Margin $535 $535 $1,200 $1,200
Expected No. of Seats 200 100 180 20
Total Contribution Margin $1,07,000 $53,500 $2,16,000 $24,000
Lower Price Higher Price
Figure 4: (Figure showing different pricing strategy and the demand forecast of the same)
Source: (Created by Author)
The above table shows that the variable cost per passenger is $ 65 when the airlines
charges $ 600 as price and the same increases to $ 150 when the airlines charges $ 1350. This
results in different contribution margins and the contribution margin for different class of
employees will also be different as shown in above table (Eappen et al. 2013). From the above
figure, it is also cleared that if the business charges $ 600 from the pleasure travelers and $ 1350
from the business travelers then the company will be able to increase the contribution margin of
the business and thereby the profitability of the business as well (Babar et al. 2015). The total
contribution margin shows that the business can earn about $ 53500 from pleasure travelers in
comparison to $ 24000 when the priced charged is $ 600 and similarly the business can earn
about $ 216000 in comparison to $ 107000 when the business charges $ 1350 as the price.
Document Page
8TRANSFER PRICING
Particulars Price Business Pleasure
Higher 1350 180 20
Lower 600 200 100
Fall/Rise in Price & Demand 125.00% -10.00% -80.00%
Rise Fall Fall
Expected Seats
Figure 5: (Figure showing demand situation under different pricing techniques)
Source: (Created by Author)
The management of the company should apply the concept of elasticity which states that
more prices to be charged from area where the product is mostly used and less price to be
charged from the areas where the product is scarcely used (Tarasova and Tarasov 2016). The
above calculation shows that the business travelers do not mind that much when the price
increased from $ 600 to $ 1350 and there was fall of only 20 customers which suggest that
change in prices do not matter that much to such customers. On the other hand, the number of
pleasure customers fell significantly which shows that it was 100 passenger which feel to 20
passengers which signifies that this group of passengers are price sensitive and therefore the
business needs to discriminate the pricing strategy so that the business ca gain and make
maximum amount of profit.
Document Page
9TRANSFER PRICING
Reference
Babar, M., Nguyen, P.H., Cuk, V. and Kamphuis, I.G., 2015, June. The development of demand
elasticity model for demand response in the retail market environment. In PowerTech, 2015
IEEE Eindhoven (pp. 1-6). IEEE.
Cristea, A.D. and Nguyen, D.X., 2016. Transfer pricing by multinational firms: New evidence
from foreign firm ownerships. American Economic Journal: Economic Policy, 8(3), pp.170-202.
Eappen, S., Lane, B.H., Rosenberg, B., Lipsitz, S.A., Sadoff, D., Matheson, D., Berry, W.R.,
Lester, M. and Gawande, A.A., 2013. Relationship between occurrence of surgical complications
and hospital finances. Jama, 309(15), pp.1599-1606.
Holtzman, Y. and Nagel, P., 2014. An introduction to transfer pricing. Journal of management
development, 33(1), pp.57-61.
Huh, W.T. and Park, K.S., 2013. Impact of transfer pricing methods for tax purposes on supply
chain performance under demand uncertainty. Naval Research Logistics (NRL), 60(4), pp.269-
293.
Nagle, T.T., Hogan, J. and Zale, J., 2016. The Strategy and Tactics of Pricing: New
International Edition. Routledge.
Rugman, A.M. and Eden, L. eds., 2017. Multinationals and transfer pricing. Routledge.
Tarasova, V.V. and Tarasov, V.E., 2016. Elasticity for economic processes with memory:
Fractional differential calculus approach. Fractional Differential Calculus, 6(2), pp.219-232.
chevron_up_icon
1 out of 10
circle_padding
hide_on_mobile
zoom_out_icon
logo.png

Your All-in-One AI-Powered Toolkit for Academic Success.

Available 24*7 on WhatsApp / Email

[object Object]