Statistical Modelling: Analyzing Transport Trends in NSW, Australia
VerifiedAdded on 2023/06/05
|14
|2914
|427
Report
AI Summary
This report provides a statistical analysis of transport data in New South Wales (NSW), Australia, focusing on Opal card usage and survey data. It examines transport patterns, preferred modes of transport, and the potential for infrastructure development. The analysis includes descriptive statistics, hypothesis testing (t-tests), and visualizations to understand commuter behavior. Key findings indicate that trains are the most popular mode of transport, and Parramatta is identified as the optimal location for a new underground railway line based on commuter traffic. The report concludes with recommendations for the NSW government to prioritize railway infrastructure development based on these findings. Desklib offers a range of similar solved assignments and study resources for students.

Statistical Modelling 1
Statistical Modelling
Name of Student
Course
Tutor
University
City/State
Statistical Modelling
Name of Student
Course
Tutor
University
City/State
Paraphrase This Document
Need a fresh take? Get an instant paraphrase of this document with our AI Paraphraser
Statistical Modelling 2
Statistical Modelling
1 (a)
Handling and transporting services, goods, and materials by road, air, rail, sea or air has to turn
out to be a complicated endeavor. As the world gets more connected, it has never been so
possibly tricky to move someone or something from one point to point another so fast, efficiently
and safely. Well-developed logistics and freight businesses are facing exertions satisfying their
clients’ full range of new preferences. Their skills, networks, services, and physical assets are an
outcome of historical market settings and expectations (Tseng et al., 2005). A new breed of rivals
is carving off bits and pieces of the industry, offering intensive services that some look upon as
offering more value and innovation than the more extensive, but less targeted, provisions of the
developed models of business (Christopher and Peck, 2004).
Australia’s logistics and freight sector include postal services, transport, warehousing, and other
transport related services provided to customers across all industries in Australia (Council, 2006).
The correct Logistics sector is projected to represent 8.7% of the state’s GDP, it is a substantial
cost for Australia’s bulk export businesses, and Australia’s substantial import of manufactured
goods implies that effective supply chains from ports to customers are indispensable for
warranting that consumers of imported commodities are getting the merchandises at the lowest
probable prices (Anderson et al. 2005).
Australia’s far-flung but exceedingly urbanized population of nearly 25 million people presents
an obstacle to planners and policy makers of the state’s transport infrastructure (Christopher and
Peck, 2004). The structure and design of transportation to and from key population hubs will be
fundamental to the growth of trades, to residential expansion, and to people’s aptitude to
Statistical Modelling 3
commute not only to and from municipalities but from business hub to business hub and suburb
to suburb (Ghaderi et al., 2015). For Infrastructure in Australia, the main factor to managing
infrastructure development is realizing consensus on the major priorities for nationally
substantial investment.
1 (b)
This dataset presents counts of tap ons and tap offs created on the Opal-ticketing system for the
duration of two non-consecutive weeks in 2016. This data is secondary data as it was obtained
from the online site of Opal-ticketing system. As said by Nguyen and Tongzon (2010),
secondary data constitutes data that has been gathered by somebody other than the user.
Conventional sources of secondary data include censuses, government publications, peer-
reviewed journals, newspapers, magazines etc. The advantages of secondary data are several.
First, they are economical in terms of time and resources. Second, secondary data offer a basis
for comparison for the data that is collected by other investigators. Third, secondary data sources
are readily available (Harrell and Bradley, 2009). Finally, secondary data helps improve the
understanding of the problem being investigated. On the other side, secondary data has been
faulted for various reasons including providing inappropriate data as the data is collected by
other people, lack of control by the researcher over data quality and quality issues.
The dataset, in this case, is constituted by both categorical and numeric variables. Categorical
variables as stated by Hox and Boeije (2005), are variables that someone can assign categories,
but the groups have no natural order. In this case, the categorical variables in dataset 1 are the
mode of transport (train, bus and light rail), location, tap, and date. On the other side, the values
of a numerical variable are numbers (Neuman, 2013). The numeric variable in this data set is
time (which is a continuous variable) and count (which is a desecrate variable). Discrete can be
⊘ This is a preview!⊘
Do you want full access?
Subscribe today to unlock all pages.
Trusted by 1+ million students worldwide
Statistical Modelling 4
further categorized into continuous or discrete variables (Yin, 2009). The discrete variable only
take on a finite number of values while continuous variable has an infinite number of possible
values (Saunders et al., 2016).
1 (c)
The dataset 2 is primary data as I collected it personally for a particular reason. On the word of
Black et al. (2002), primary data is an original data that is collected first-hand by the investigator
in a particular research project or project. Primary data has several advantages according to
researchers. First, primary data is very reliable as an investigator can duplicate the procedure to
check the validity of the results, as they understand how the data was gathered and analysed
(Neuman, 2013). Second, primary data collection provides the latest data as data obtained from
previous years is less likely to answer the questions that a researcher wants to address
consistently. Lastly, primary data allow researchers to be subjective in types of data they are
gathering in line with the hypothesis they are trying to test. Regardless of the advantages of
primary data, this method of data collection is faulted for being expensive regarding resources
and time consuming (Yin, 2009).
The main methods of collecting primary data include direct observations, survey questionnaires,
and conducting interviews (oral or phone interviews) (Neuman, 2013). In our contest, an online
survey questionnaire was randomly distributed to the targeted respondents and the responses
recorded for analysis. Simple random sampling is a research technique where each sample
element of a given size has an equal chance of being selected (Neuman, 2013). The use of online
questionnaire was preferred in this survey as it is less costly regarding administration and is
convenience as it enables respondents to participate in any study at any place provided they are
Paraphrase This Document
Need a fresh take? Get an instant paraphrase of this document with our AI Paraphraser
Statistical Modelling 5
connected to the internet. Gadgets like mobile phones, tablets, pcs and desktops usually allow
participation or respondents in online surveys.
The two variables of interest under this study were gender and mode of transport as the
investigator sought to investigate the relationship between the two. Since this was a small scale
survey, a total of 30 responses were recorded out of the 50 targeted responses, which represents a
60% response rate. Under this case, both gender (male and female) and mode of transport (train,
light rail and buses) are categorical variables.
2(a)
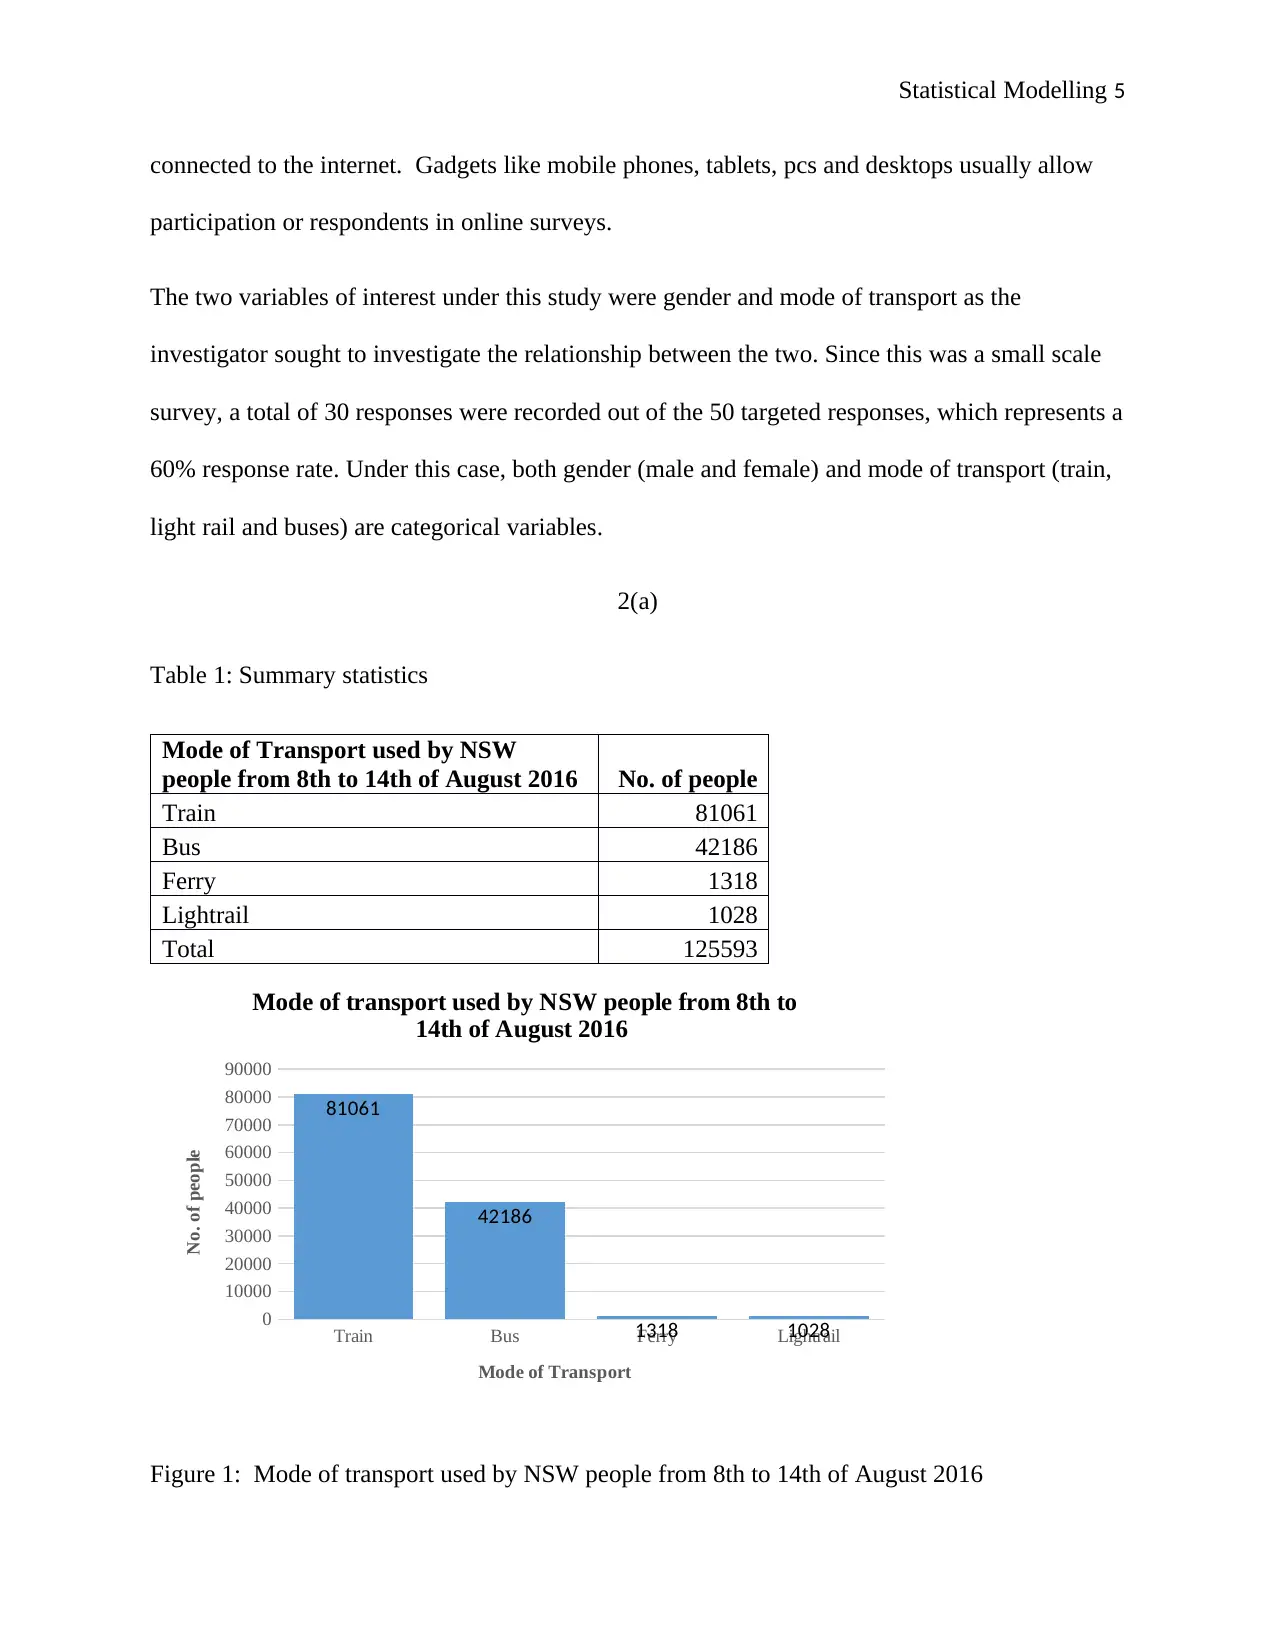
Table 1: Summary statistics
Mode of Transport used by NSW
people from 8th to 14th of August 2016 No. of people
Train 81061
Bus 42186
Ferry 1318
Lightrail 1028
Total 125593
Train Bus Ferry Lightrail
0
10000
20000
30000
40000
50000
60000
70000
80000
90000
81061
42186
1318 1028
Mode of transport used by NSW people from 8th to
14th of August 2016
Mode of Transport
No. of people
Figure 1: Mode of transport used by NSW people from 8th to 14th of August 2016
connected to the internet. Gadgets like mobile phones, tablets, pcs and desktops usually allow
participation or respondents in online surveys.
The two variables of interest under this study were gender and mode of transport as the
investigator sought to investigate the relationship between the two. Since this was a small scale
survey, a total of 30 responses were recorded out of the 50 targeted responses, which represents a
60% response rate. Under this case, both gender (male and female) and mode of transport (train,
light rail and buses) are categorical variables.
2(a)
Table 1: Summary statistics
Mode of Transport used by NSW
people from 8th to 14th of August 2016 No. of people
Train 81061
Bus 42186
Ferry 1318
Lightrail 1028
Total 125593
Train Bus Ferry Lightrail
0
10000
20000
30000
40000
50000
60000
70000
80000
90000
81061
42186
1318 1028
Mode of transport used by NSW people from 8th to
14th of August 2016
Mode of Transport
No. of people
Figure 1: Mode of transport used by NSW people from 8th to 14th of August 2016
Statistical Modelling 6
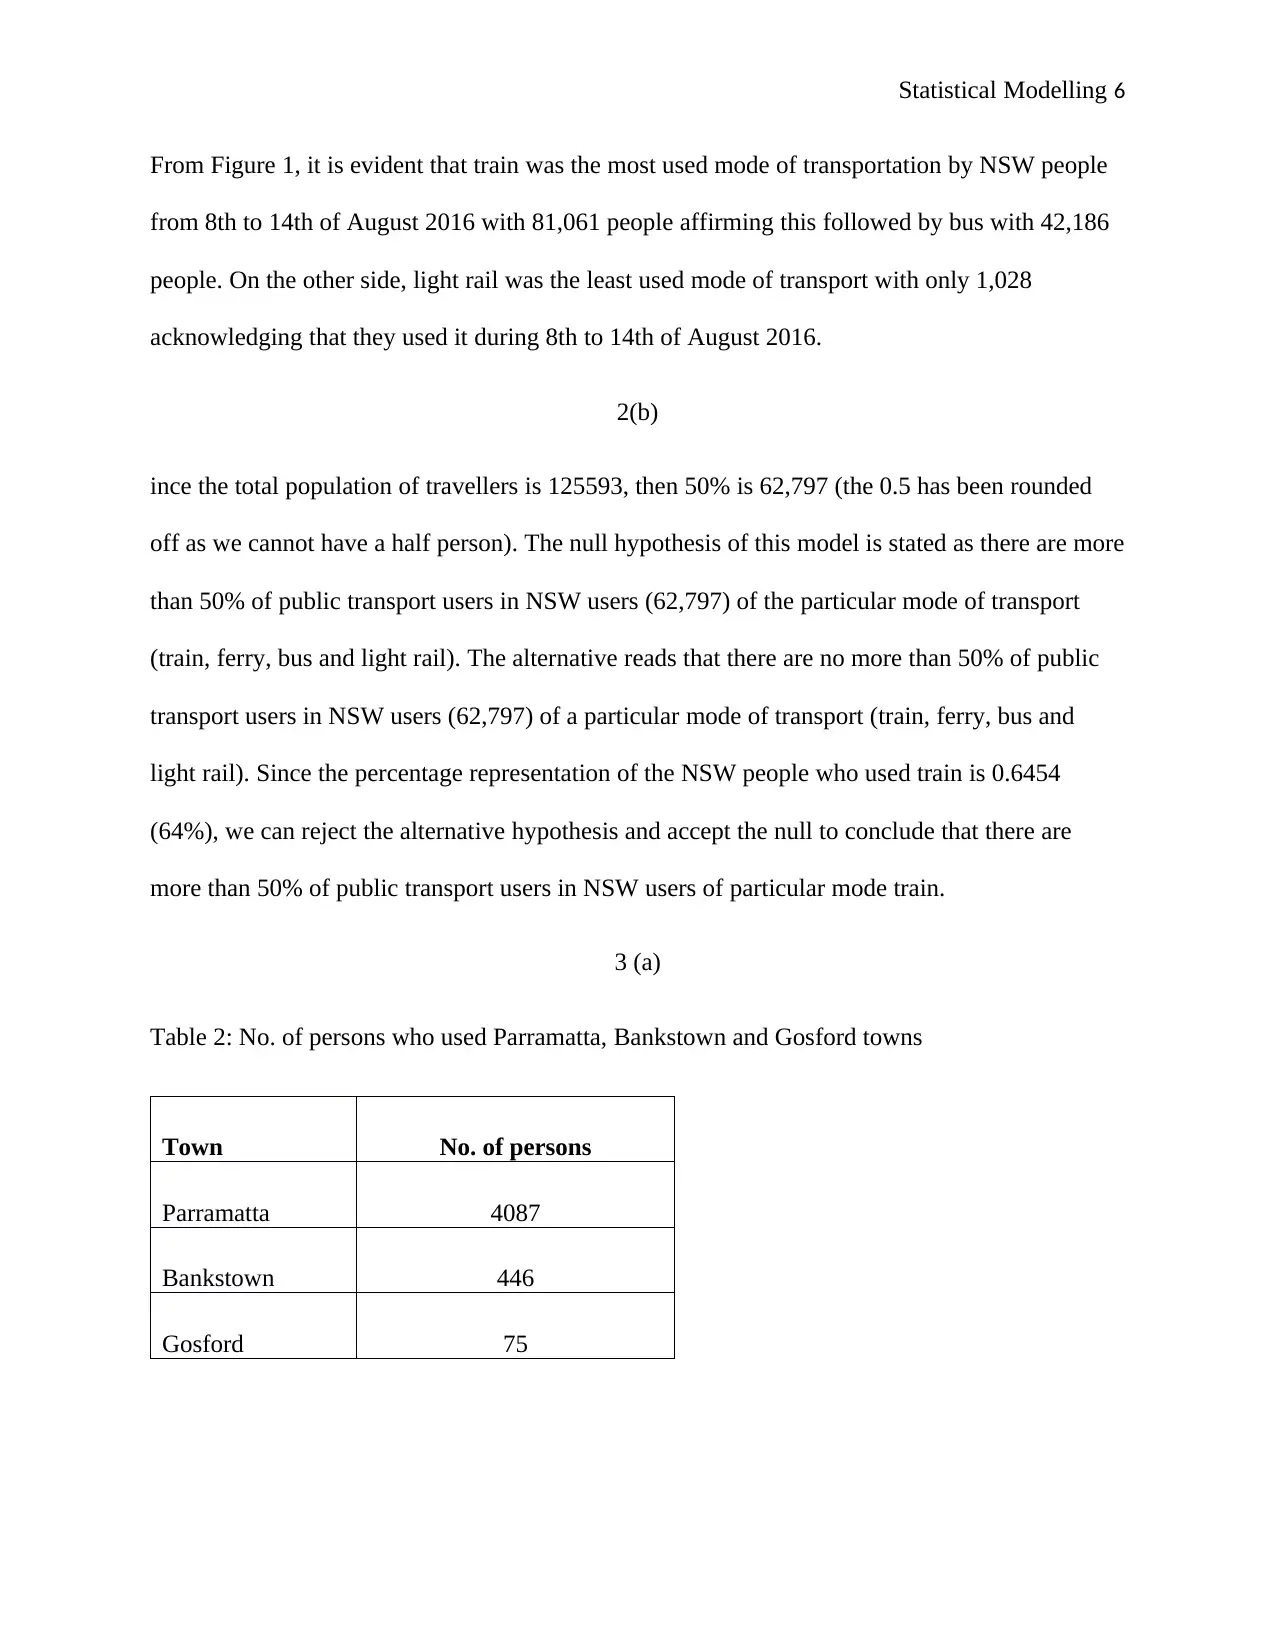
From Figure 1, it is evident that train was the most used mode of transportation by NSW people
from 8th to 14th of August 2016 with 81,061 people affirming this followed by bus with 42,186
people. On the other side, light rail was the least used mode of transport with only 1,028
acknowledging that they used it during 8th to 14th of August 2016.
2(b)
ince the total population of travellers is 125593, then 50% is 62,797 (the 0.5 has been rounded
off as we cannot have a half person). The null hypothesis of this model is stated as there are more
than 50% of public transport users in NSW users (62,797) of the particular mode of transport
(train, ferry, bus and light rail). The alternative reads that there are no more than 50% of public
transport users in NSW users (62,797) of a particular mode of transport (train, ferry, bus and
light rail). Since the percentage representation of the NSW people who used train is 0.6454
(64%), we can reject the alternative hypothesis and accept the null to conclude that there are
more than 50% of public transport users in NSW users of particular mode train.
3 (a)
Table 2: No. of persons who used Parramatta, Bankstown and Gosford towns
Town No. of persons
Parramatta 4087
Bankstown 446
Gosford 75
⊘ This is a preview!⊘
Do you want full access?
Subscribe today to unlock all pages.
Trusted by 1+ million students worldwide
Statistical Modelling 7
89%
10%
2%
Persons who used different towns to access train
services
Parramatta Bankstown Gosford
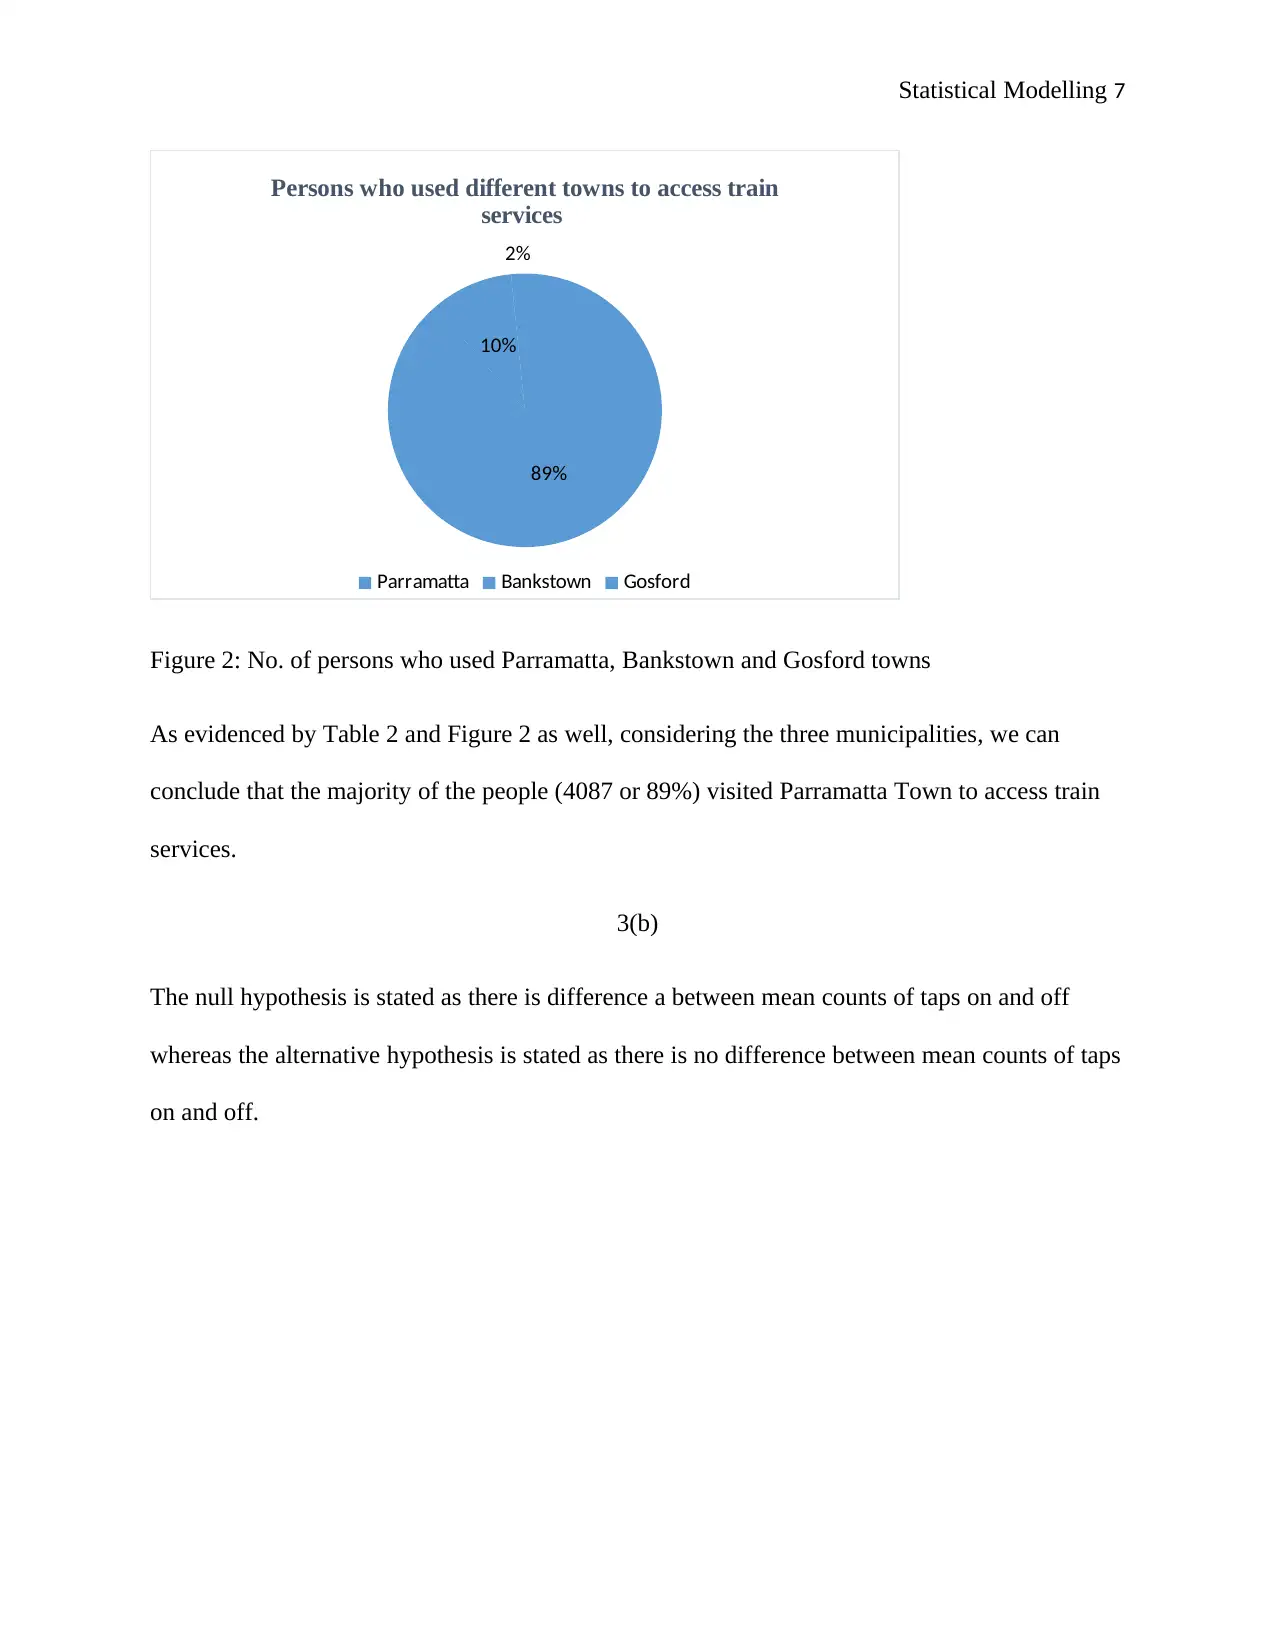
Figure 2: No. of persons who used Parramatta, Bankstown and Gosford towns
As evidenced by Table 2 and Figure 2 as well, considering the three municipalities, we can
conclude that the majority of the people (4087 or 89%) visited Parramatta Town to access train
services.
3(b)
The null hypothesis is stated as there is difference a between mean counts of taps on and off
whereas the alternative hypothesis is stated as there is no difference between mean counts of taps
on and off.
89%
10%
2%
Persons who used different towns to access train
services
Parramatta Bankstown Gosford
Figure 2: No. of persons who used Parramatta, Bankstown and Gosford towns
As evidenced by Table 2 and Figure 2 as well, considering the three municipalities, we can
conclude that the majority of the people (4087 or 89%) visited Parramatta Town to access train
services.
3(b)
The null hypothesis is stated as there is difference a between mean counts of taps on and off
whereas the alternative hypothesis is stated as there is no difference between mean counts of taps
on and off.
Paraphrase This Document
Need a fresh take? Get an instant paraphrase of this document with our AI Paraphraser
Statistical Modelling 8
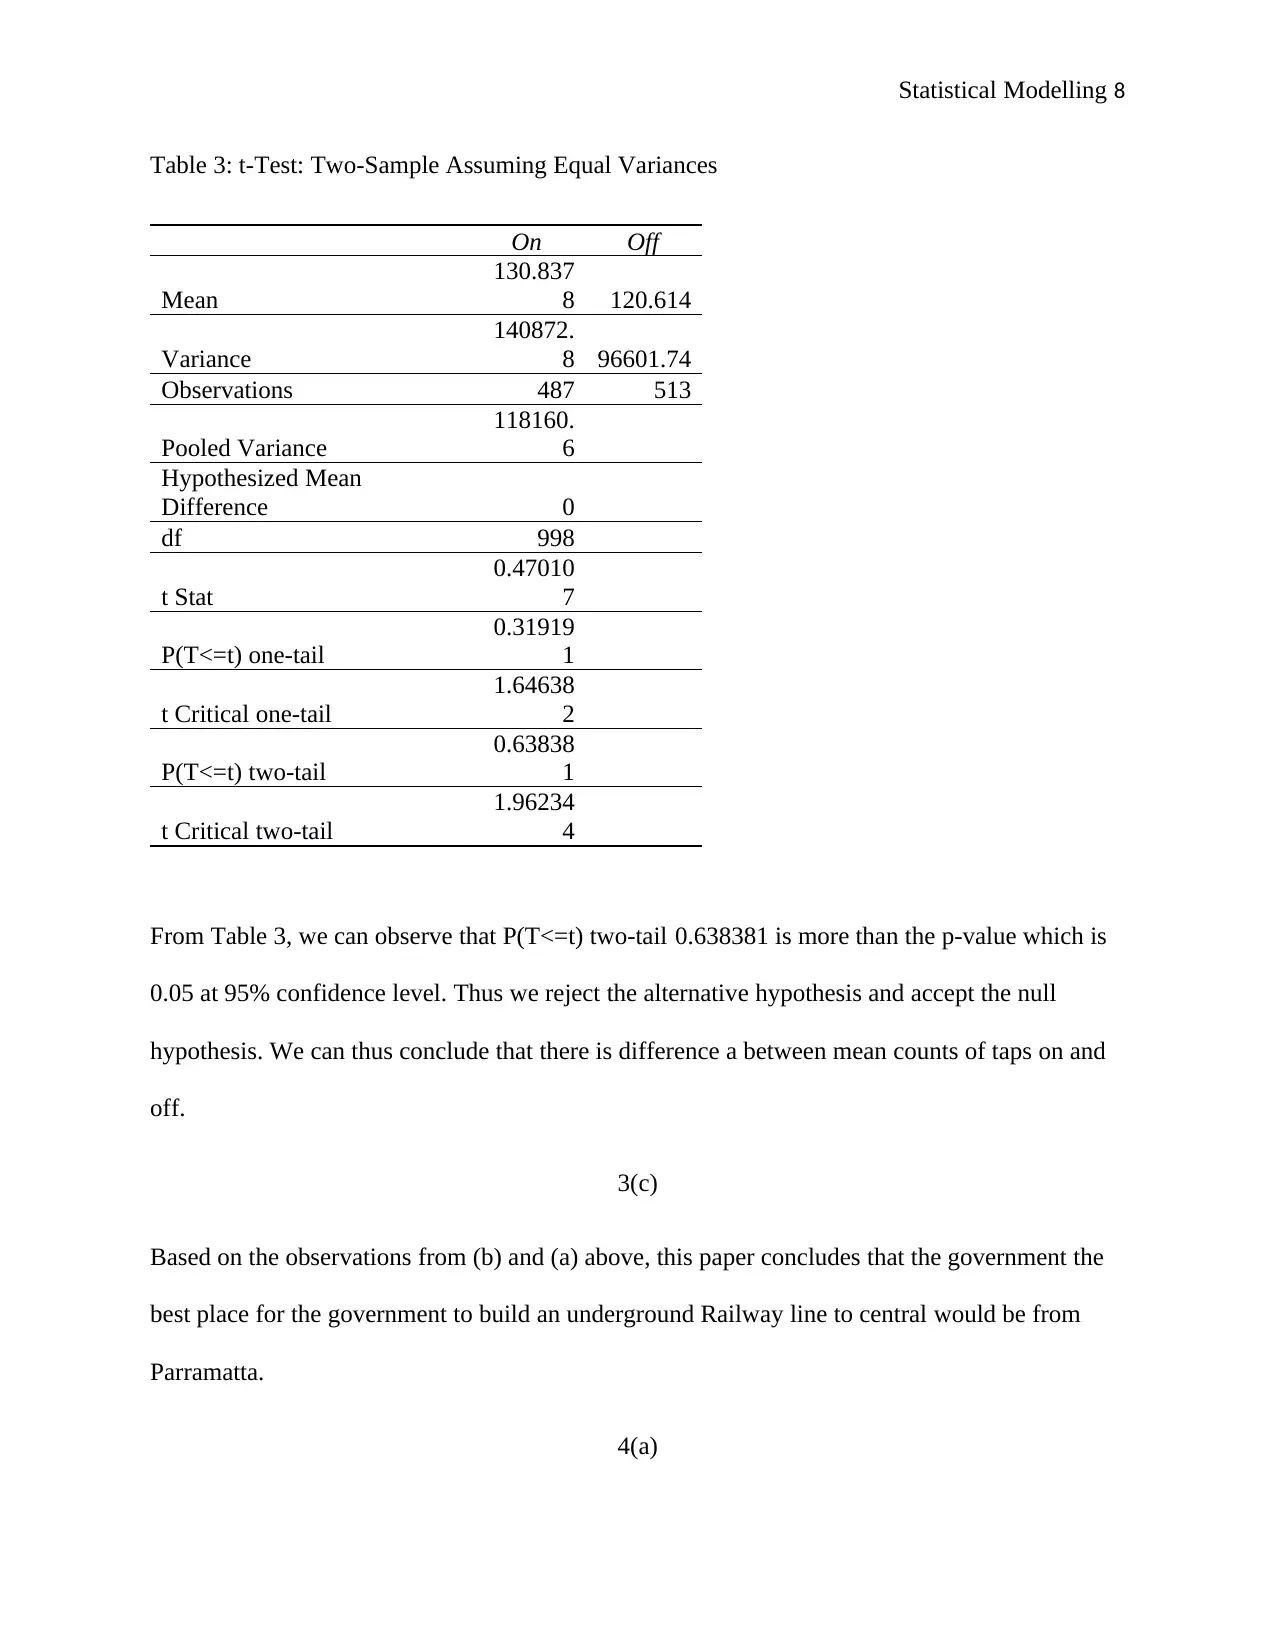
Table 3: t-Test: Two-Sample Assuming Equal Variances
On Off
Mean
130.837
8 120.614
Variance
140872.
8 96601.74
Observations 487 513
Pooled Variance
118160.
6
Hypothesized Mean
Difference 0
df 998
t Stat
0.47010
7
P(T<=t) one-tail
0.31919
1
t Critical one-tail
1.64638
2
P(T<=t) two-tail
0.63838
1
t Critical two-tail
1.96234
4
From Table 3, we can observe that P(T<=t) two-tail 0.638381 is more than the p-value which is
0.05 at 95% confidence level. Thus we reject the alternative hypothesis and accept the null
hypothesis. We can thus conclude that there is difference a between mean counts of taps on and
off.
3(c)
Based on the observations from (b) and (a) above, this paper concludes that the government the
best place for the government to build an underground Railway line to central would be from
Parramatta.
4(a)
Statistical Modelling 9
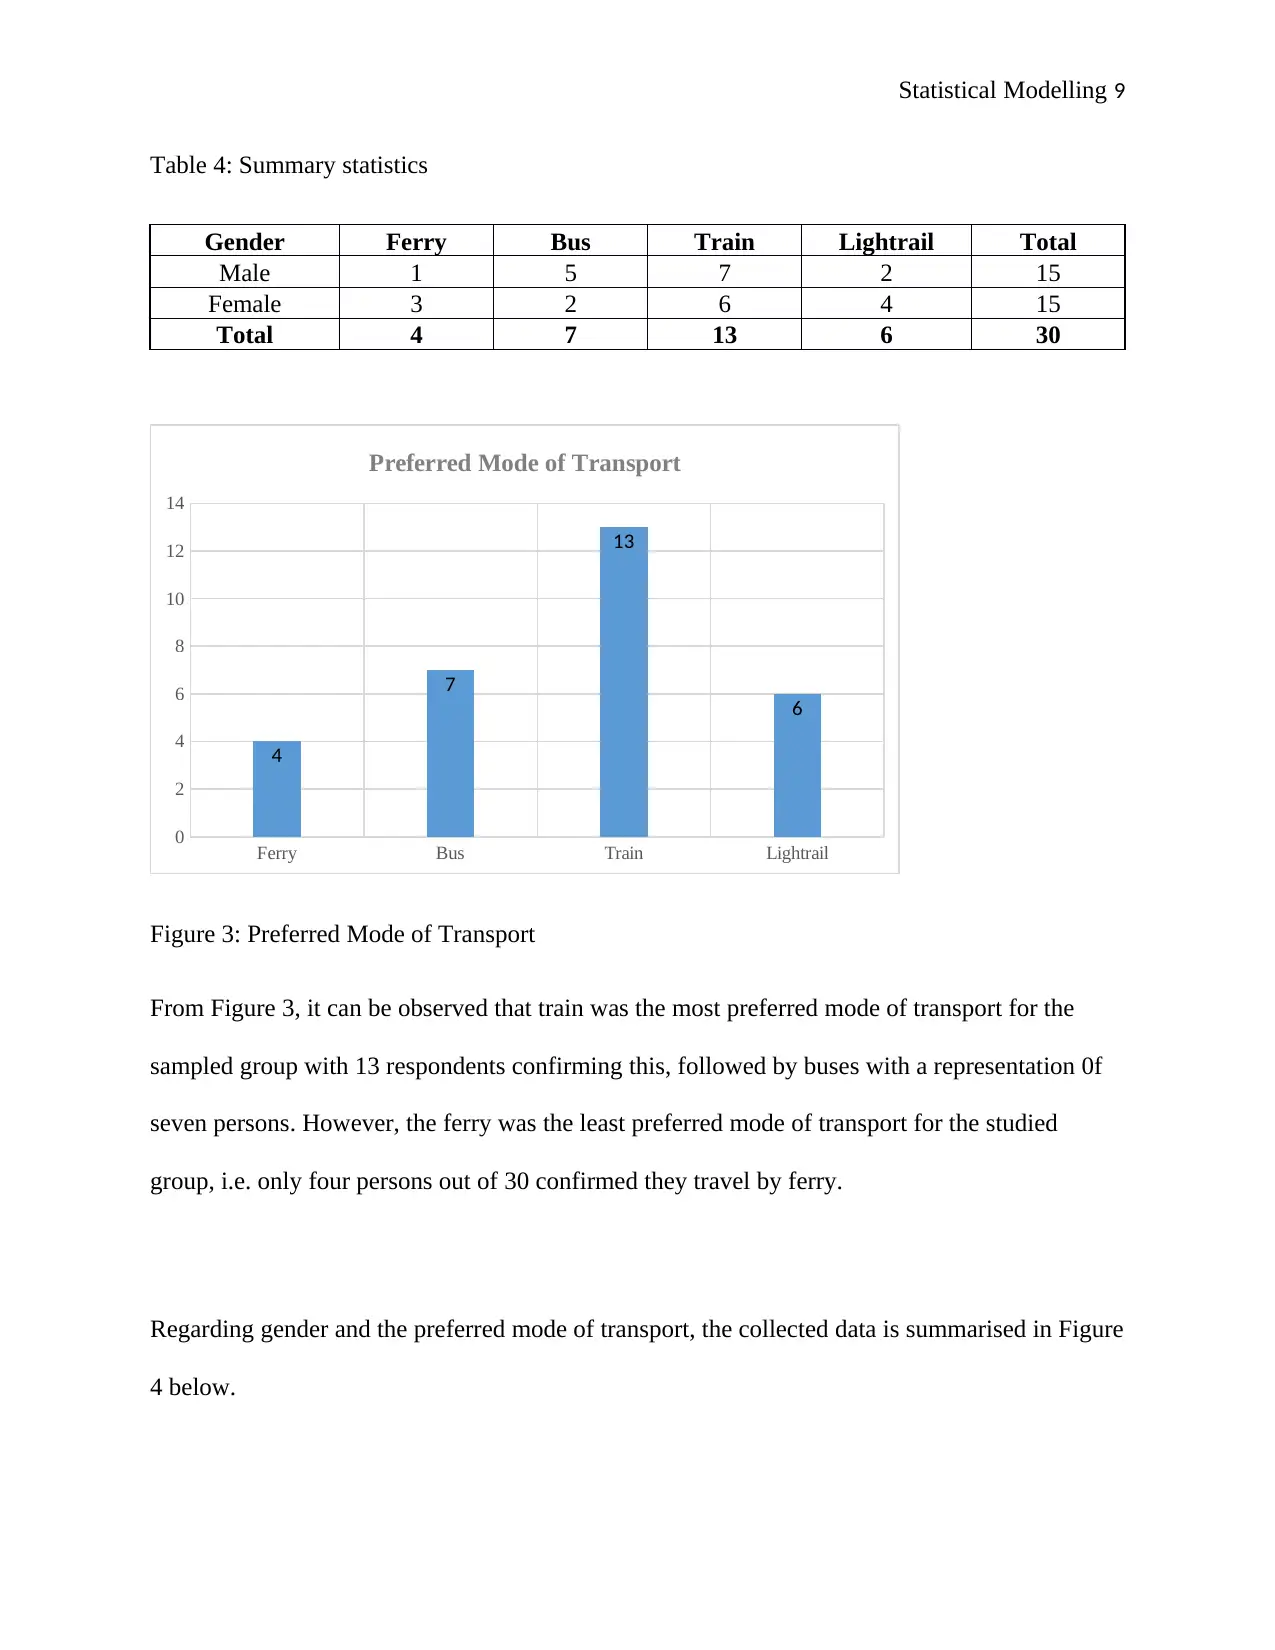
Table 4: Summary statistics
Gender Ferry Bus Train Lightrail Total
Male 1 5 7 2 15
Female 3 2 6 4 15
Total 4 7 13 6 30
Ferry Bus Train Lightrail
0
2
4
6
8
10
12
14
4
7
13
6
Preferred Mode of Transport
Figure 3: Preferred Mode of Transport
From Figure 3, it can be observed that train was the most preferred mode of transport for the
sampled group with 13 respondents confirming this, followed by buses with a representation 0f
seven persons. However, the ferry was the least preferred mode of transport for the studied
group, i.e. only four persons out of 30 confirmed they travel by ferry.
Regarding gender and the preferred mode of transport, the collected data is summarised in Figure
4 below.
⊘ This is a preview!⊘
Do you want full access?
Subscribe today to unlock all pages.
Trusted by 1+ million students worldwide
Statistical Modelling 10
Ferry Bus Train Lightrail
0
1
2
3
4
5
6
7
8
1
5
7
2
3
2
6
4
Preferred Mode of Transport in terms of Gender
Male Female
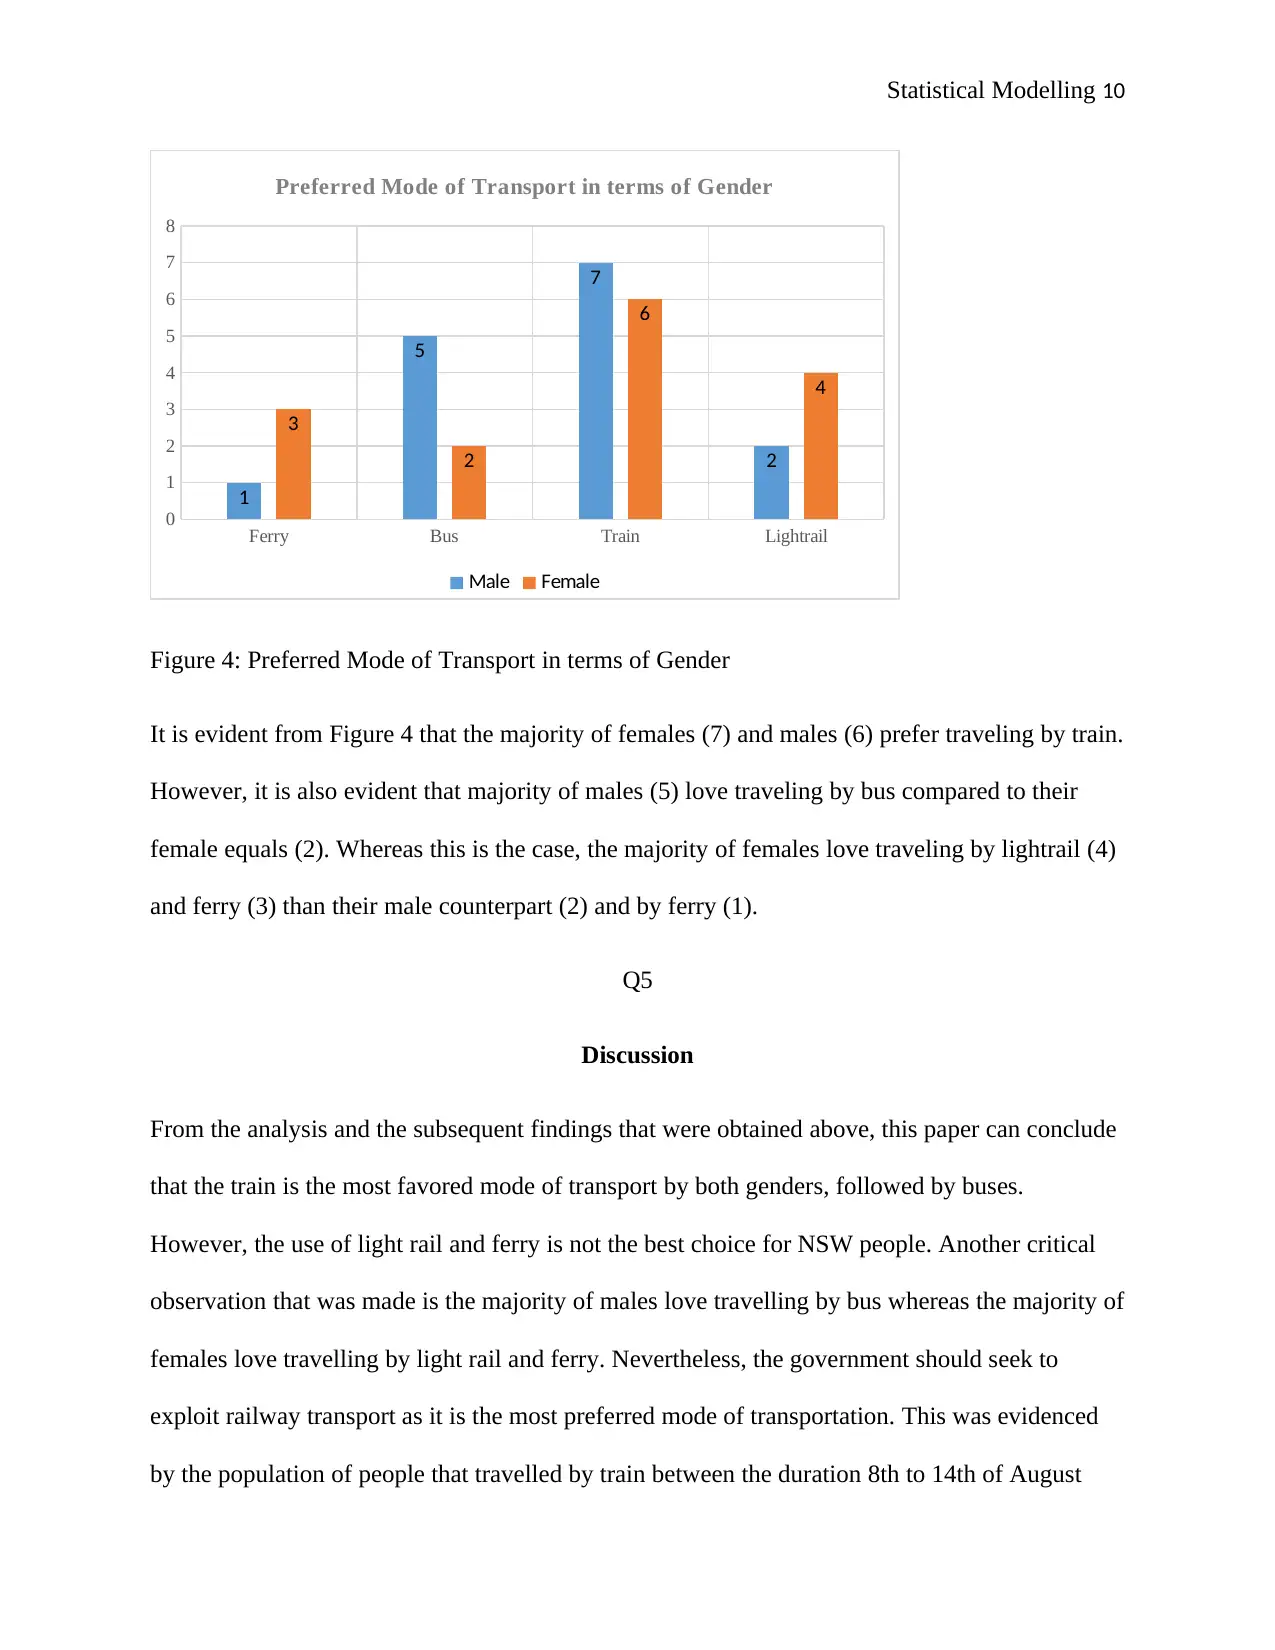
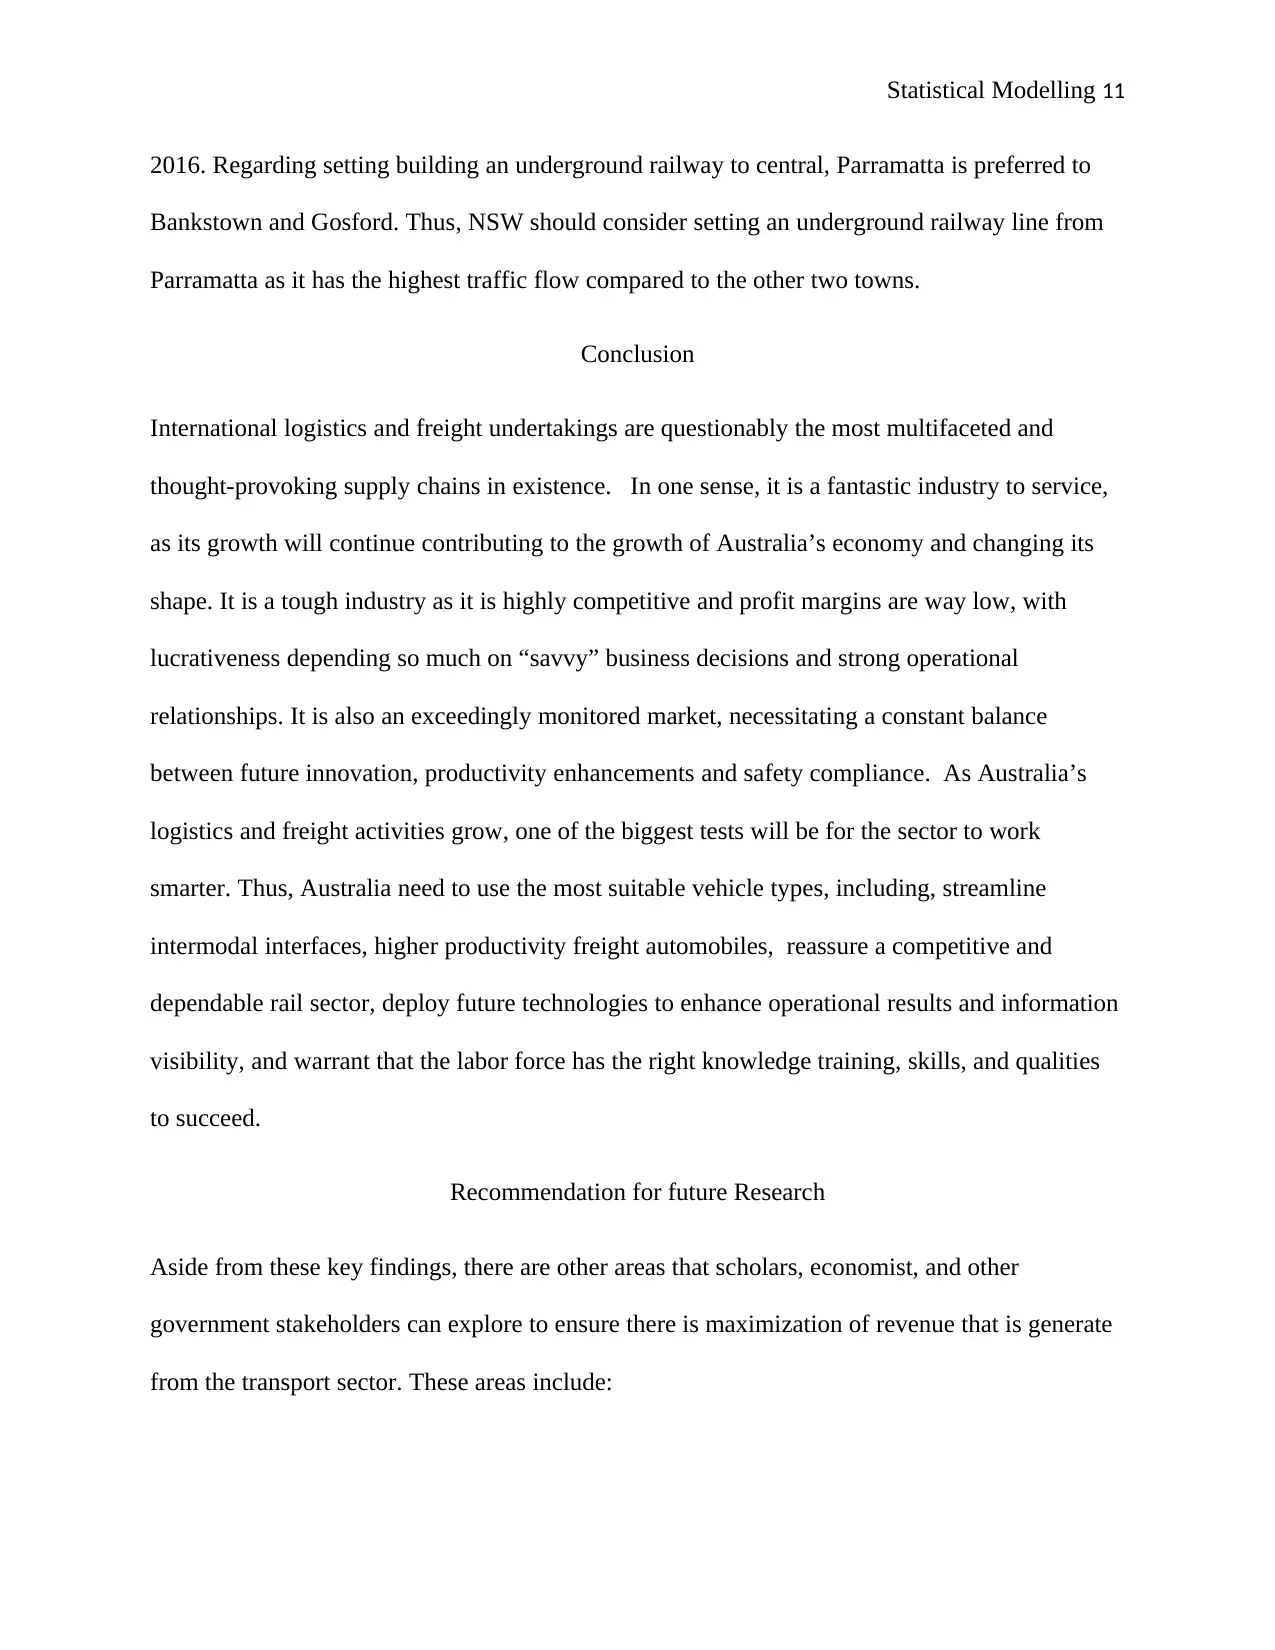
Figure 4: Preferred Mode of Transport in terms of Gender
It is evident from Figure 4 that the majority of females (7) and males (6) prefer traveling by train.
However, it is also evident that majority of males (5) love traveling by bus compared to their
female equals (2). Whereas this is the case, the majority of females love traveling by lightrail (4)
and ferry (3) than their male counterpart (2) and by ferry (1).
Q5
Discussion
From the analysis and the subsequent findings that were obtained above, this paper can conclude
that the train is the most favored mode of transport by both genders, followed by buses.
However, the use of light rail and ferry is not the best choice for NSW people. Another critical
observation that was made is the majority of males love travelling by bus whereas the majority of
females love travelling by light rail and ferry. Nevertheless, the government should seek to
exploit railway transport as it is the most preferred mode of transportation. This was evidenced
by the population of people that travelled by train between the duration 8th to 14th of August
Ferry Bus Train Lightrail
0
1
2
3
4
5
6
7
8
1
5
7
2
3
2
6
4
Preferred Mode of Transport in terms of Gender
Male Female
Figure 4: Preferred Mode of Transport in terms of Gender
It is evident from Figure 4 that the majority of females (7) and males (6) prefer traveling by train.
However, it is also evident that majority of males (5) love traveling by bus compared to their
female equals (2). Whereas this is the case, the majority of females love traveling by lightrail (4)
and ferry (3) than their male counterpart (2) and by ferry (1).
Q5
Discussion
From the analysis and the subsequent findings that were obtained above, this paper can conclude
that the train is the most favored mode of transport by both genders, followed by buses.
However, the use of light rail and ferry is not the best choice for NSW people. Another critical
observation that was made is the majority of males love travelling by bus whereas the majority of
females love travelling by light rail and ferry. Nevertheless, the government should seek to
exploit railway transport as it is the most preferred mode of transportation. This was evidenced
by the population of people that travelled by train between the duration 8th to 14th of August
Paraphrase This Document
Need a fresh take? Get an instant paraphrase of this document with our AI Paraphraser
Statistical Modelling 11
2016. Regarding setting building an underground railway to central, Parramatta is preferred to
Bankstown and Gosford. Thus, NSW should consider setting an underground railway line from
Parramatta as it has the highest traffic flow compared to the other two towns.
Conclusion
International logistics and freight undertakings are questionably the most multifaceted and
thought-provoking supply chains in existence. In one sense, it is a fantastic industry to service,
as its growth will continue contributing to the growth of Australia’s economy and changing its
shape. It is a tough industry as it is highly competitive and profit margins are way low, with
lucrativeness depending so much on “savvy” business decisions and strong operational
relationships. It is also an exceedingly monitored market, necessitating a constant balance
between future innovation, productivity enhancements and safety compliance. As Australia’s
logistics and freight activities grow, one of the biggest tests will be for the sector to work
smarter. Thus, Australia need to use the most suitable vehicle types, including, streamline
intermodal interfaces, higher productivity freight automobiles, reassure a competitive and
dependable rail sector, deploy future technologies to enhance operational results and information
visibility, and warrant that the labor force has the right knowledge training, skills, and qualities
to succeed.
Recommendation for future Research
Aside from these key findings, there are other areas that scholars, economist, and other
government stakeholders can explore to ensure there is maximization of revenue that is generate
from the transport sector. These areas include:

Statistical Modelling 12
1. Studying the correlation between the location of railway, bus, ferry, or lightrail boarding
places and the mode of transport that is chosen.
2. Studying the cost-benefits implication of travelling by different modes of transport
3. Studying the determinants of various modes of transport
1. Studying the correlation between the location of railway, bus, ferry, or lightrail boarding
places and the mode of transport that is chosen.
2. Studying the cost-benefits implication of travelling by different modes of transport
3. Studying the determinants of various modes of transport
⊘ This is a preview!⊘
Do you want full access?
Subscribe today to unlock all pages.
Trusted by 1+ million students worldwide
1 out of 14

Your All-in-One AI-Powered Toolkit for Academic Success.
+13062052269
info@desklib.com
Available 24*7 on WhatsApp / Email
![[object Object]](/_next/static/media/star-bottom.7253800d.svg)
Unlock your academic potential
Copyright © 2020–2026 A2Z Services. All Rights Reserved. Developed and managed by ZUCOL.