Descriptive Statistics Project: University Transportation Statistics

Verified

Added on  2021/10/03

|7
|1009
|131
Project
AI Summary
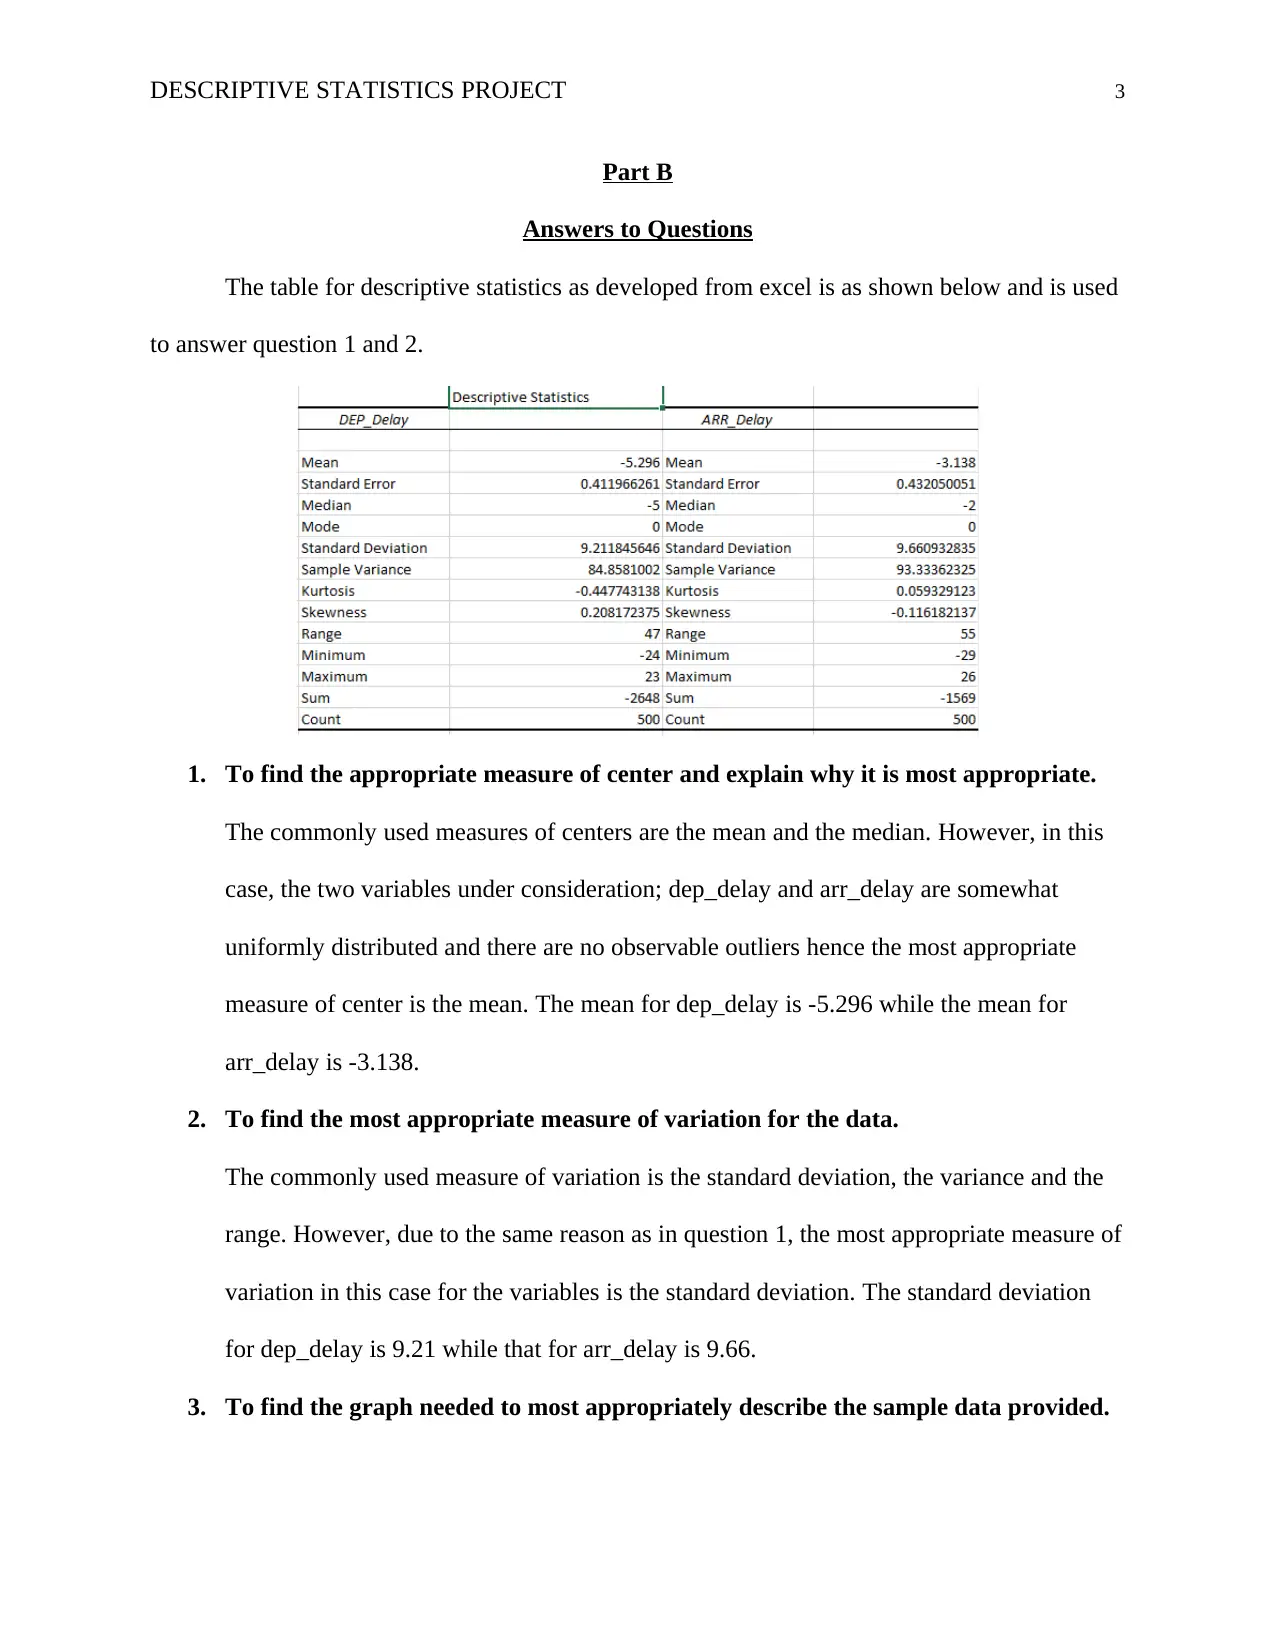
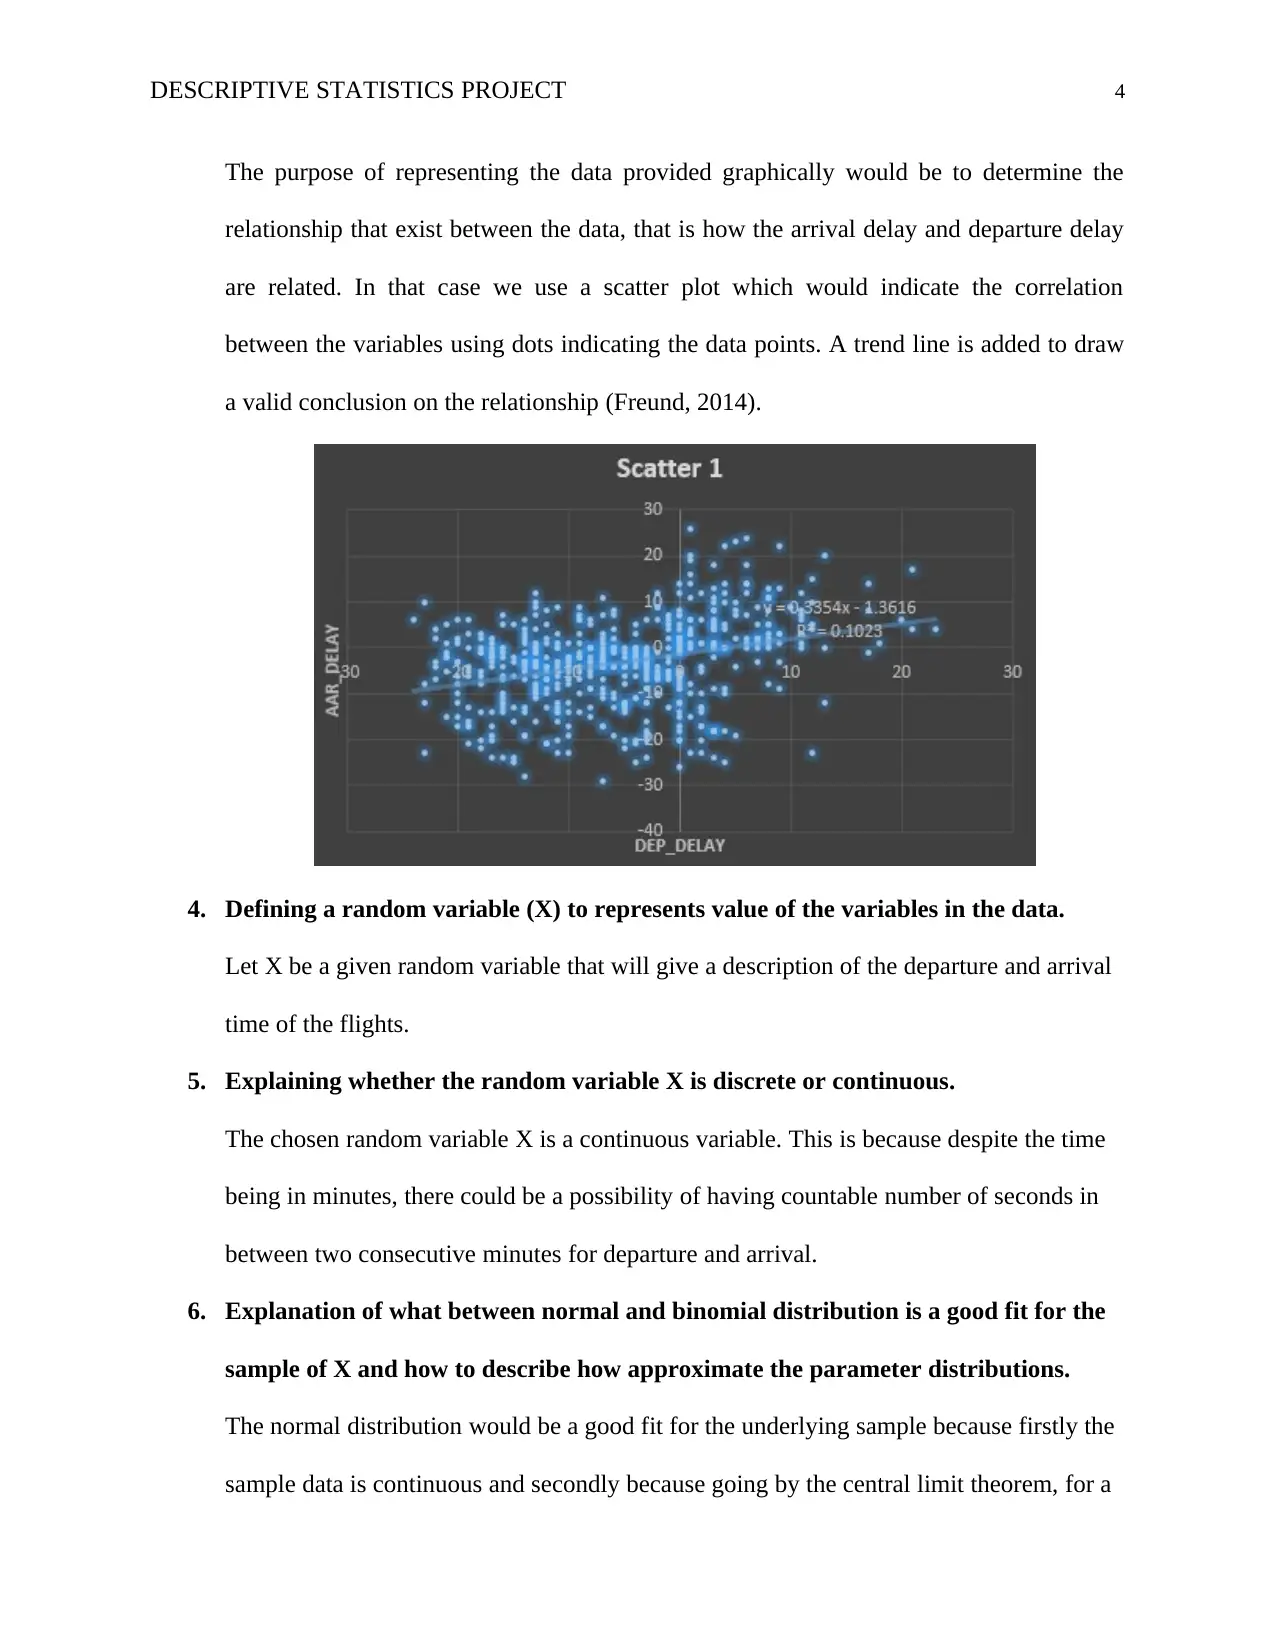
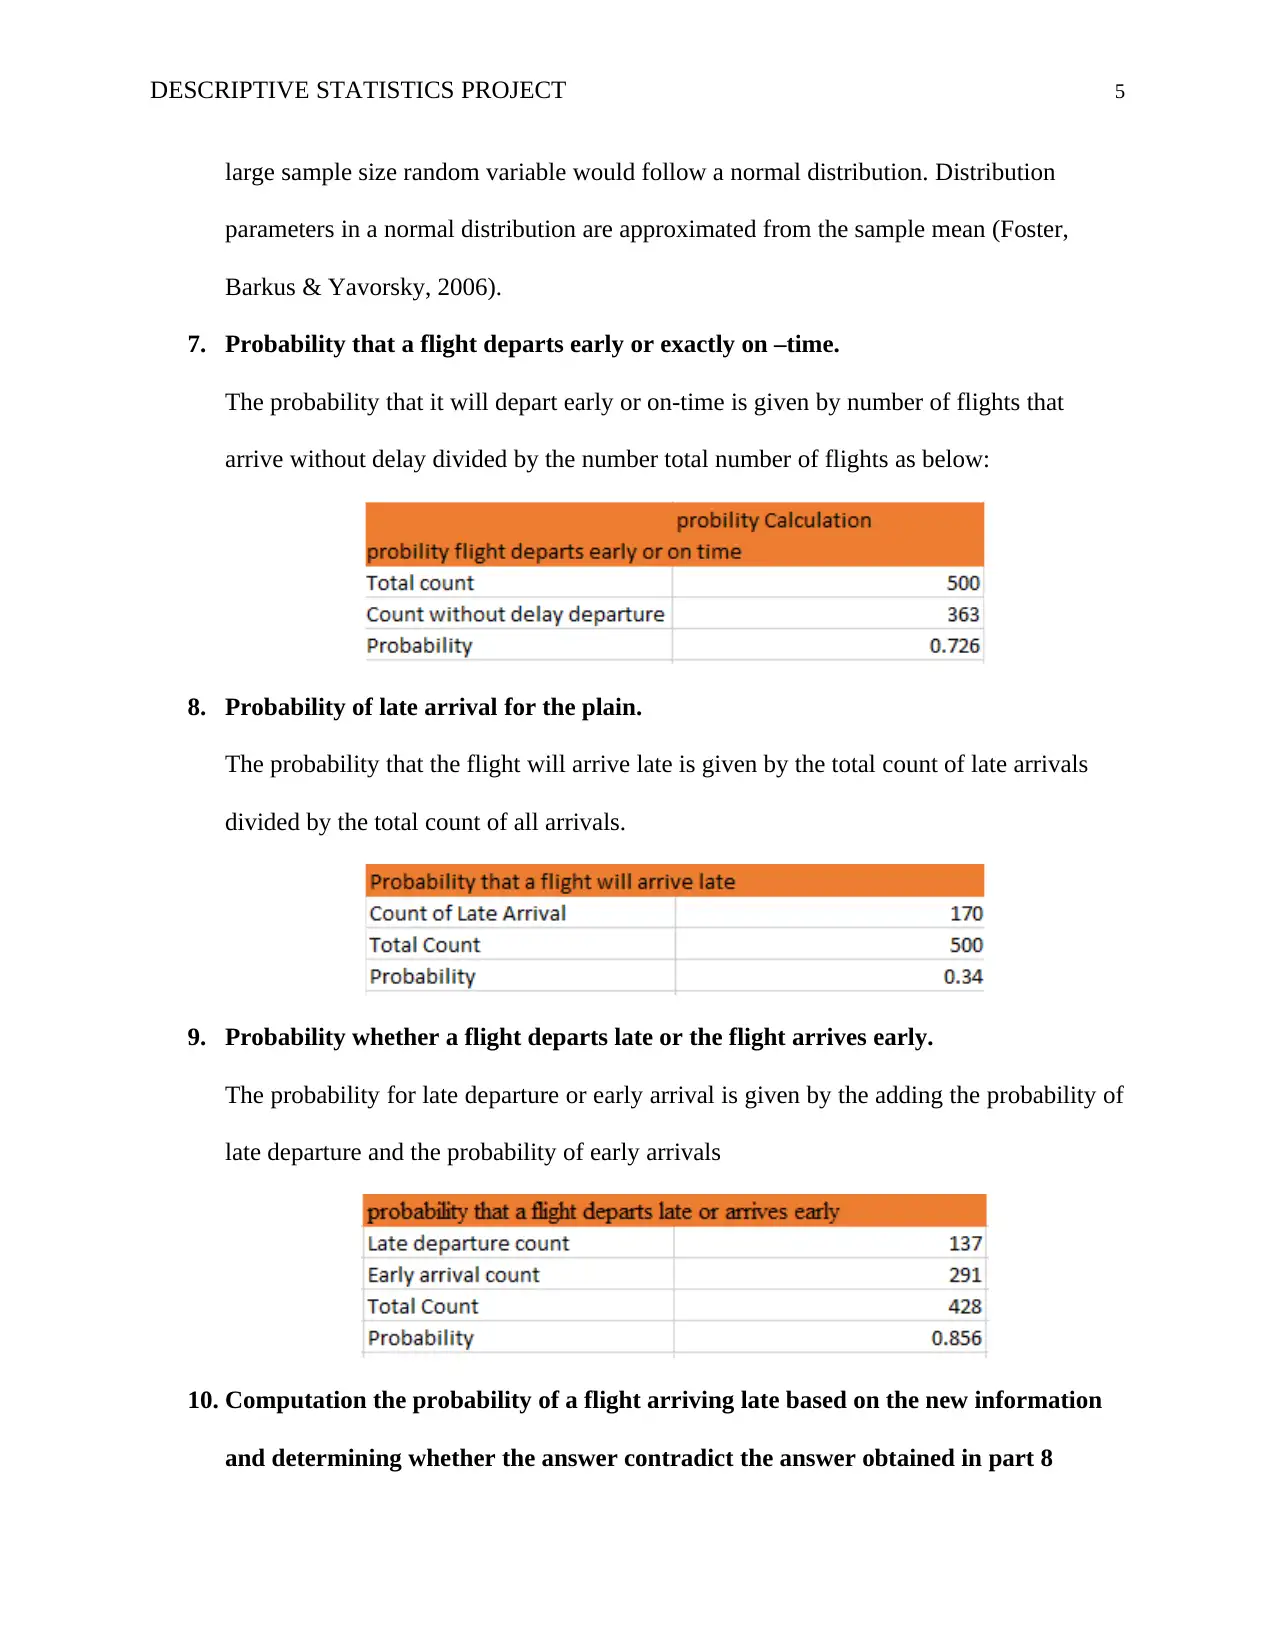
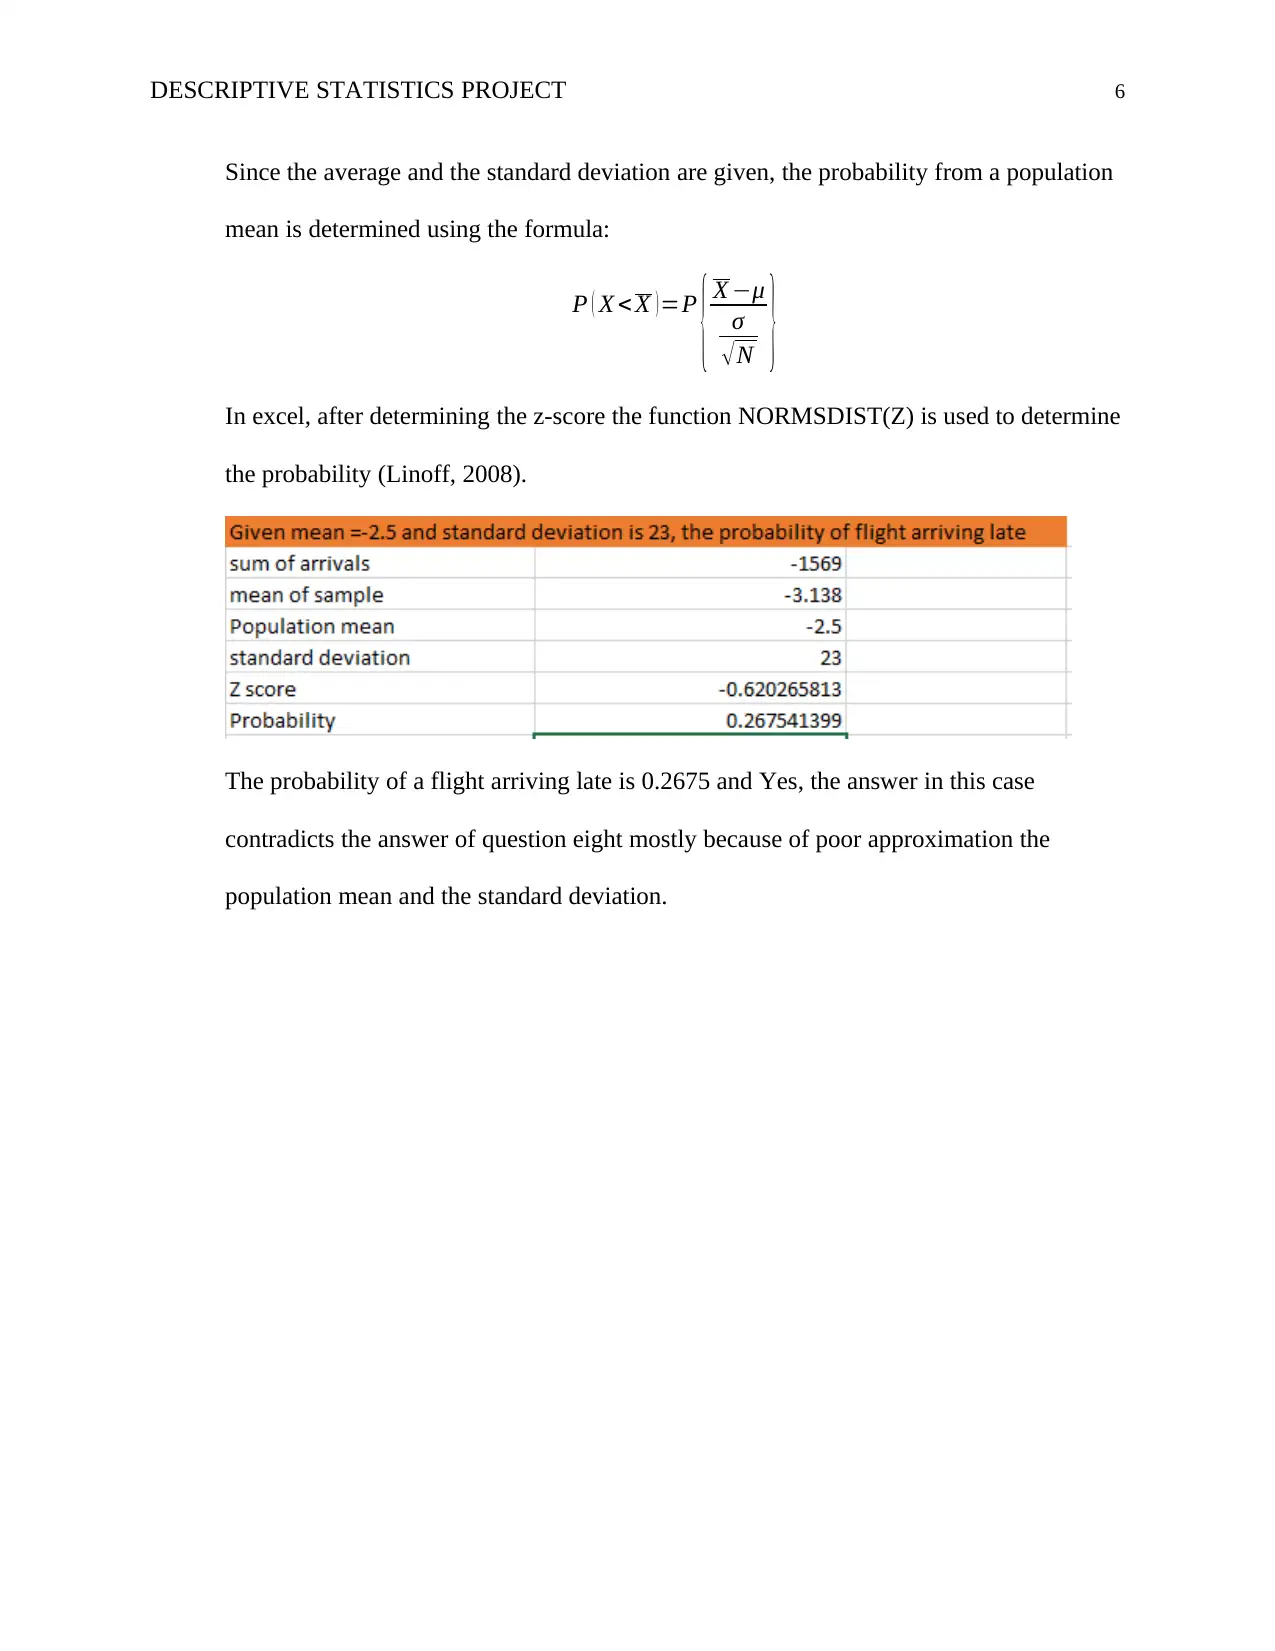
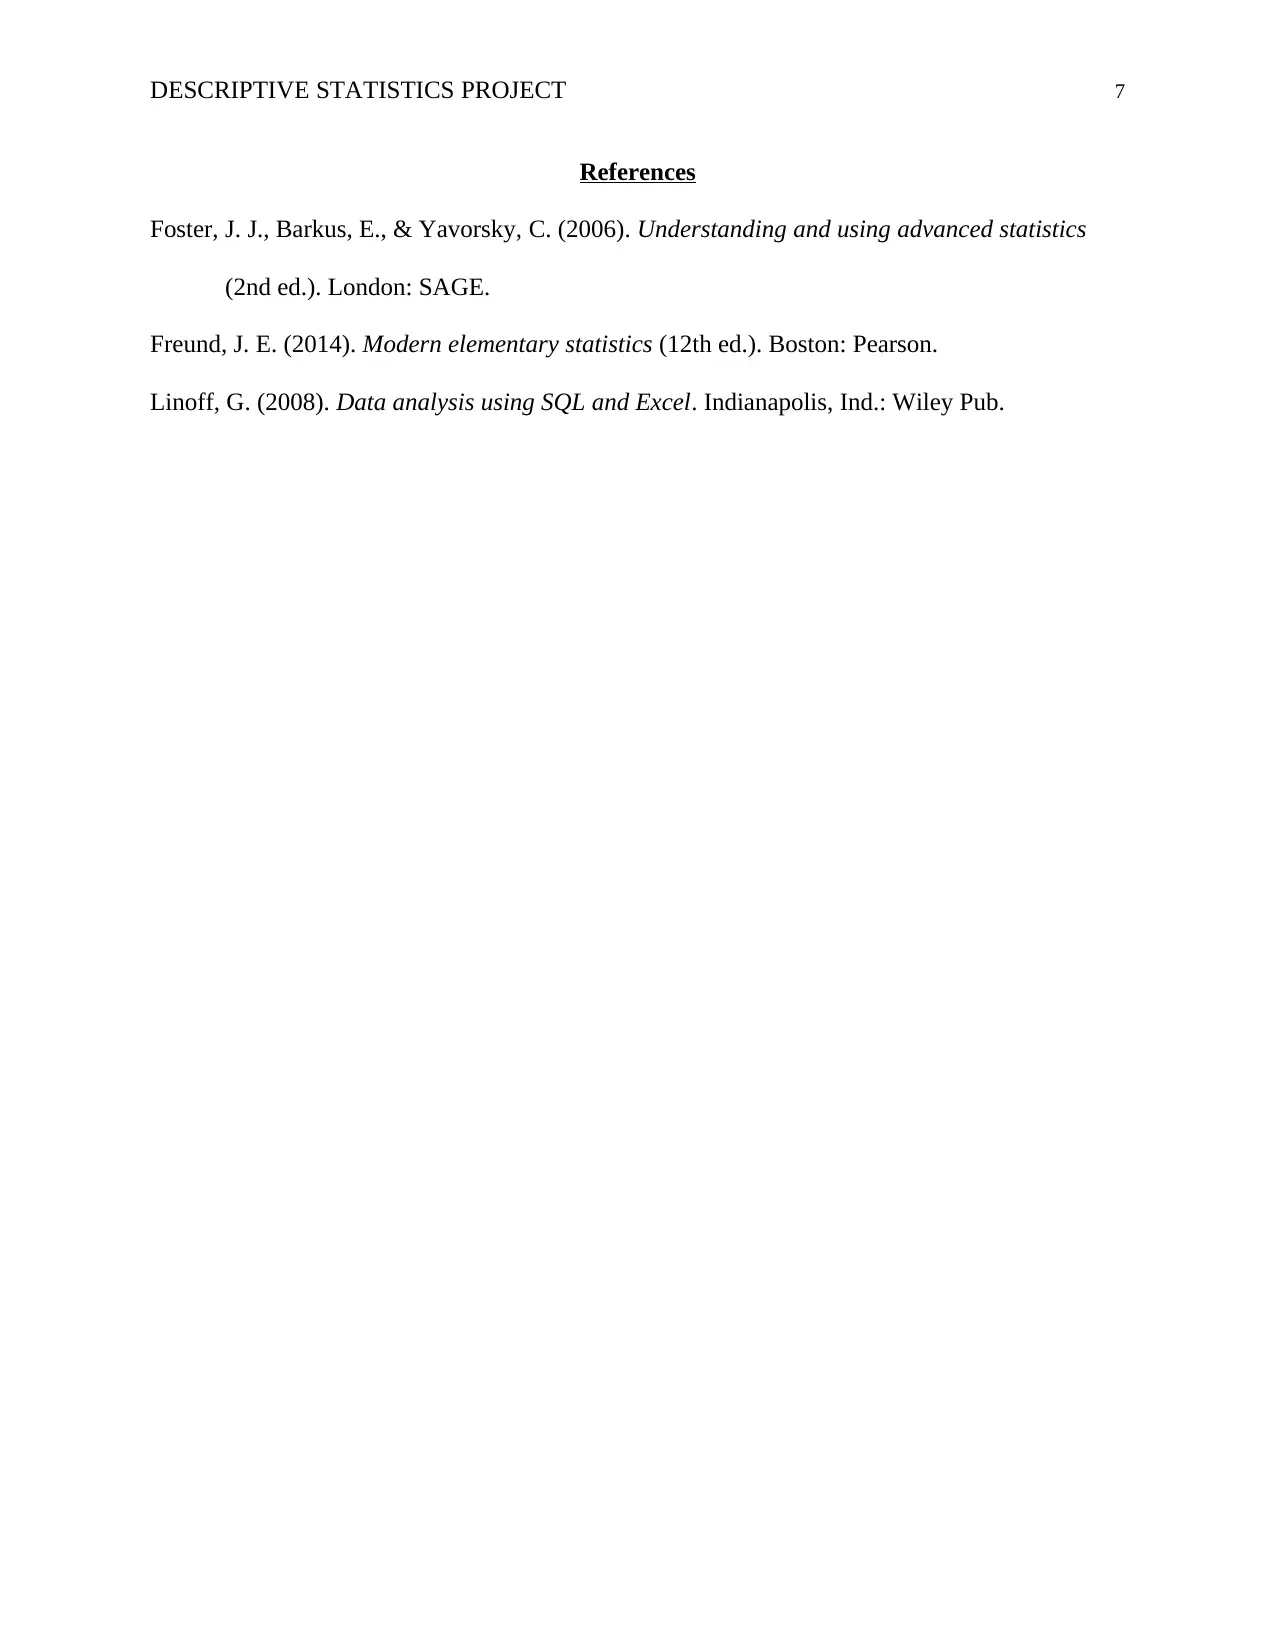
This project analyzes a dataset from the Department of Transportation, focusing on flight arrival and departure delays. The assignment involves descriptive statistics, including determining measures of central tendency (mean) and variation (standard deviation), and selecting appropriate graphical representations (scatter plot). The student defines a random variable, identifies it as continuous, and explains why a normal distribution is a good fit for the data. Probability calculations are performed to determine the likelihood of early or on-time departures and late arrivals. The project concludes with a comparison of probability results and an analysis of the impact of population mean and standard deviation approximations. The project references relevant statistical resources.
Document Page
Running head: DESCRIPTIVE STATISTICS MODEL 1
Benchmark-Descriptive Statistics Project
Student Name
University Name
tabler-icon-diamond-filled.svg

Paraphrase This Document

Need a fresh take? Get an instant paraphrase of this document with our AI Paraphraser
Document Page
DESCRIPTIVE STATISTICS PROJECT 2
Part A
Description of Dataset
The sample dataset provided was provided from the department of transportation and
statistics. It represents “reporting carrier on-time performance.” It has got four variables;
day_of_month and day_of_week are discrete variables that indicates the day of the month and
the day of the week when the data was collected respectively. On the other hand, dep_delay and
arr_delay are continuous variables indicating the difference that exists in minutes between
scheduled and actual departure and arrival times respectively. Early arrival or departure is
denoted by a negative sign. From the data, it is evident that in the year 2015, five hundred
observations on arrival and departure delay were taken on the thirteenth day of a given month
and the second day of a given week in the month. The is normally distributed with an average
departure delay time of -5.296 and an average arrival time was -3.138.
The dataset provided is to be used for carrying out statistical analysis such as determining
the measure of central tendency and variation, creating a plot that best describes the data using
an appropriate graph and use an appropriate probability distribution to estimate parameters.
Additionally, the dataset will be used as an aid to examine statistical viability sources, the
significance of randomness in statistical inference and to analyze the difference that exists
between empirical and theoretical probability and they impact they have on probability
calculations.
Document Page
DESCRIPTIVE STATISTICS PROJECT 3
Part B
Answers to Questions
The table for descriptive statistics as developed from excel is as shown below and is used
to answer question 1 and 2.
1. To find the appropriate measure of center and explain why it is most appropriate.
The commonly used measures of centers are the mean and the median. However, in this
case, the two variables under consideration; dep_delay and arr_delay are somewhat
uniformly distributed and there are no observable outliers hence the most appropriate
measure of center is the mean. The mean for dep_delay is -5.296 while the mean for
arr_delay is -3.138.
2. To find the most appropriate measure of variation for the data.
The commonly used measure of variation is the standard deviation, the variance and the
range. However, due to the same reason as in question 1, the most appropriate measure of
variation in this case for the variables is the standard deviation. The standard deviation
for dep_delay is 9.21 while that for arr_delay is 9.66.
3. To find the graph needed to most appropriately describe the sample data provided.
Document Page
DESCRIPTIVE STATISTICS PROJECT 4
The purpose of representing the data provided graphically would be to determine the
relationship that exist between the data, that is how the arrival delay and departure delay
are related. In that case we use a scatter plot which would indicate the correlation
between the variables using dots indicating the data points. A trend line is added to draw
a valid conclusion on the relationship (Freund, 2014).
4. Defining a random variable (X) to represents value of the variables in the data.
Let X be a given random variable that will give a description of the departure and arrival
time of the flights.
5. Explaining whether the random variable X is discrete or continuous.
The chosen random variable X is a continuous variable. This is because despite the time
being in minutes, there could be a possibility of having countable number of seconds in
between two consecutive minutes for departure and arrival.
6. Explanation of what between normal and binomial distribution is a good fit for the
sample of X and how to describe how approximate the parameter distributions.
The normal distribution would be a good fit for the underlying sample because firstly the
sample data is continuous and secondly because going by the central limit theorem, for a
tabler-icon-diamond-filled.svg

Paraphrase This Document

Need a fresh take? Get an instant paraphrase of this document with our AI Paraphraser
Document Page
DESCRIPTIVE STATISTICS PROJECT 5
large sample size random variable would follow a normal distribution. Distribution
parameters in a normal distribution are approximated from the sample mean (Foster,
Barkus & Yavorsky, 2006).
7. Probability that a flight departs early or exactly on –time.
The probability that it will depart early or on-time is given by number of flights that
arrive without delay divided by the number total number of flights as below:
8. Probability of late arrival for the plain.
The probability that the flight will arrive late is given by the total count of late arrivals
divided by the total count of all arrivals.
9. Probability whether a flight departs late or the flight arrives early.
The probability for late departure or early arrival is given by the adding the probability of
late departure and the probability of early arrivals
10. Computation the probability of a flight arriving late based on the new information
and determining whether the answer contradict the answer obtained in part 8
Document Page
DESCRIPTIVE STATISTICS PROJECT 6
Since the average and the standard deviation are given, the probability from a population
mean is determined using the formula:
P ( X < X ) =P
{ X μ
σ
N }
In excel, after determining the z-score the function NORMSDIST(Z) is used to determine
the probability (Linoff, 2008).
The probability of a flight arriving late is 0.2675 and Yes, the answer in this case
contradicts the answer of question eight mostly because of poor approximation the
population mean and the standard deviation.
Document Page
DESCRIPTIVE STATISTICS PROJECT 7
References
Foster, J. J., Barkus, E., & Yavorsky, C. (2006). Understanding and using advanced statistics
(2nd ed.). London: SAGE.
Freund, J. E. (2014). Modern elementary statistics (12th ed.). Boston: Pearson.
Linoff, G. (2008). Data analysis using SQL and Excel. Indianapolis, Ind.: Wiley Pub.
chevron_up_icon
1 out of 7
circle_padding
hide_on_mobile
zoom_out_icon
[object Object]