BUACC 5901: Financial Performance and SDG Analysis of Transurban Group
VerifiedAdded on 2023/01/20
|14
|2927
|24
Report
AI Summary
This report analyzes the financial performance of Transurban Group for the years 2017 and 2018, utilizing the 2018 annual report. It compares key financial metrics, including revenue, profit after tax, EBITDA, and earnings per share, highlighting improvements in profitability. The analysis includes the use of profitability ratios such as net profit margin and return on total assets to depict the financial performance. The report also assesses Transurban's financial position, examining changes in cash and cash equivalents, market value of securities, and free cash balance. Furthermore, the report evaluates Transurban's progress towards the UN Sustainable Development Goals (SDGs), detailing its initiatives related to SDG 3, 5, 7, 8, 9, 11, 12, 13, and 17, and providing an opinion on these initiatives. Finally, the report includes the income statement and balance sheet for Swan Jet Ski Hire, providing a comprehensive overview of the financial analysis and sustainability efforts of the company.
1
Subject: BUACC 5901, Semester 1, 2019
Subject: BUACC 5901, Semester 1, 2019
Paraphrase This Document
Need a fresh take? Get an instant paraphrase of this document with our AI Paraphraser
2
Contents
Solution 1: Comparison of financial results of Transurban for year 2017-2018 through using the
annual report of year 2018...............................................................................................................3
Comparison of financial performance of Transurban Group to evaluate its profitability through
of narration given in annual report...............................................................................................3
Use of profitability ratios to depict the financial performance....................................................4
Financial position of Transurban Group as provided in annual report of year 2018...................5
Financial Position through use of ratios.......................................................................................5
Solution 2: UN Sustainable Development Goals progress report...................................................5
Solution 3: Income Statement and Balance sheet of Swan Jet Ski Hire..........................................7
References......................................................................................................................................11
3
Solution 1: Comparison of financial results of Transurban for year 2017-2018 through
using the annual report of year 2018
Transurban Group is privately owned company that belongs to the construction sector
and it is based in Melbourne, Australia. Transurban Group main business is to develop the urban
toll roads in Australia and other parts of the world. Some of the important toll roads assets that
have been owned by Transurban Group include Lane Cove Tunnel, Hills M2, CityLink, Eastern
Distributor, Westlink M7 and Logan Motorway (About Us, 2019). There are many other projects
that have owned by Transurban Group and complete list can be found on the company website.
In order make comparison of financial results of year 2018 with financial results of year
2017, information provided in the annual report of year 2018 has been explored and changes in
performance have been discussed in detail below.
Comparison of financial performance of Transurban Group to evaluate its profitability
through of narration given in annual report
Financial performance can be evaluated through the analyzing the income statement and
calculating the profitability ratios. As per the information provided in the annual report 2018 of
Transurban Group it can be said that revenue from main operating business (Toll Road) has been
increased from $ 2083 million in year 2017 to $ 2249 million in year 2018 reflecting the increase
of 8% during the year. The increase in revenue has also been reflected in the value of profit
earned during the year 2018. It has been found that profit after tax from the ordinary activities
(operating the toll roads) has increased from $ 209 million to $ 468 million reflecting the
increase of minimum of 124 % (Annual Report, 2018). It means management at Transurban
Group has made the substantial efforts to control and reduce the operating cost to earn maximum
profit during the year. The proportional amount of profit earned by Transurban Group was 124%
as compared to previous year, while sales has been increased by only 8% during the same period.
Profit before tax, depreciation, amortization, finance cost and other items (EBITDA) has also
increased by 8.1 percent during year 2018 as it has grown from $ 1526 million in year 2017 to
$1649 million in year 2018 (Bragg, 2010). In addition to the disclosed profits earned by
company there was net earnings from significant items of $ 21 million in year 2018 which is
related to related to the integration and transaction cost linked with the acquisition of A25. In
⊘ This is a preview!⊘
Do you want full access?
Subscribe today to unlock all pages.
Trusted by 1+ million students worldwide
4
year 2018, Transurban Group has booked the income tax benefit of $179 million as compared to
$ 35 million in year 2017 (Baker & Powell, 2010). This tax benefit was due to the un-booked tax
losses in the books of accounts of US operations. So it can be said that profitability performance
has been improved in year 2018 as compared to year 2017 (Annual Report, 2018).
Earnings per share (EPS) of company were 11.7 cents in year 2017 and it got increased to
22.7 cents in year 2018. It means profitability performance of Transurban Group has been
improved a lot in current year as compared to year 2017 (Annual Report, 2018).
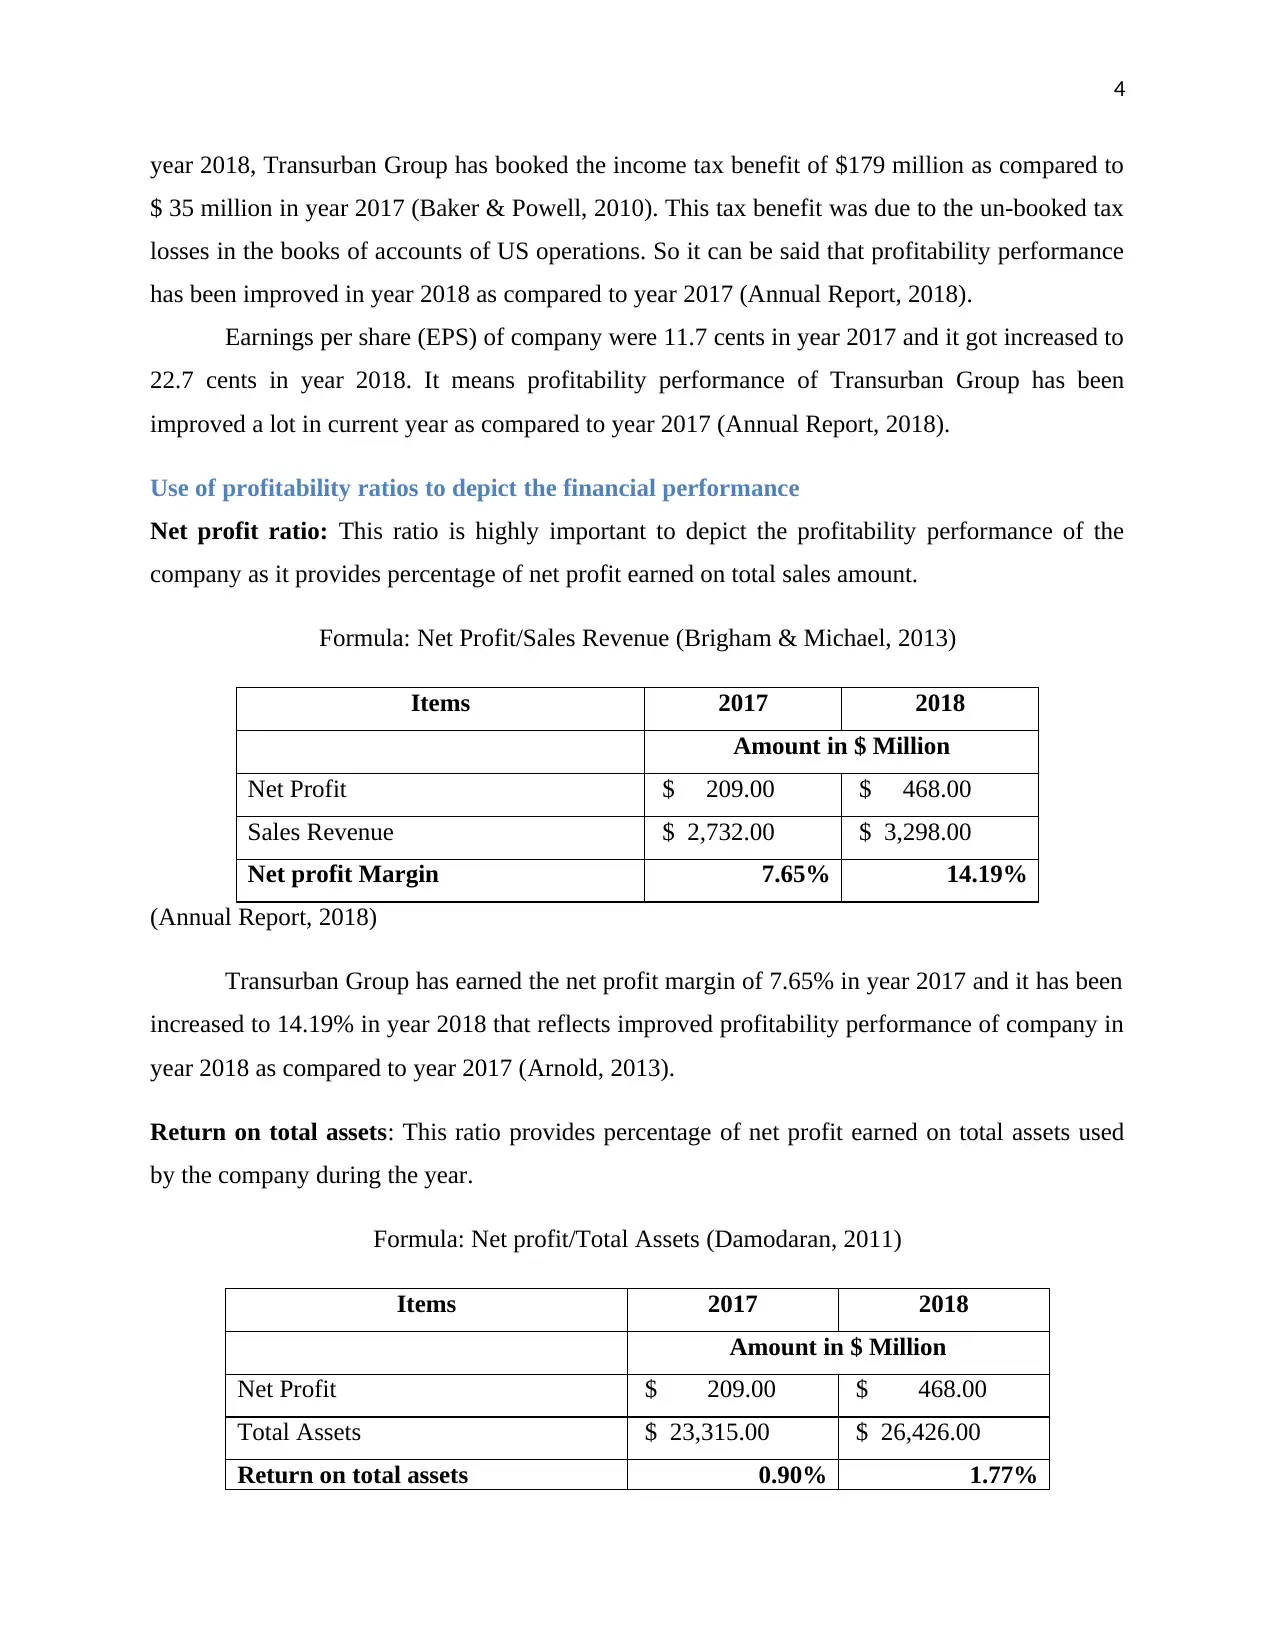
Use of profitability ratios to depict the financial performance
Net profit ratio: This ratio is highly important to depict the profitability performance of the
company as it provides percentage of net profit earned on total sales amount.
Formula: Net Profit/Sales Revenue (Brigham & Michael, 2013)
Items 2017 2018
Amount in $ Million
Net Profit $ 209.00 $ 468.00
Sales Revenue $ 2,732.00 $ 3,298.00
Net profit Margin 7.65% 14.19%
(Annual Report, 2018)
Transurban Group has earned the net profit margin of 7.65% in year 2017 and it has been
increased to 14.19% in year 2018 that reflects improved profitability performance of company in
year 2018 as compared to year 2017 (Arnold, 2013).
Return on total assets: This ratio provides percentage of net profit earned on total assets used
by the company during the year.
Formula: Net profit/Total Assets (Damodaran, 2011)
Items 2017 2018
Amount in $ Million
Net Profit $ 209.00 $ 468.00
Total Assets $ 23,315.00 $ 26,426.00
Return on total assets 0.90% 1.77%
year 2018, Transurban Group has booked the income tax benefit of $179 million as compared to
$ 35 million in year 2017 (Baker & Powell, 2010). This tax benefit was due to the un-booked tax
losses in the books of accounts of US operations. So it can be said that profitability performance
has been improved in year 2018 as compared to year 2017 (Annual Report, 2018).
Earnings per share (EPS) of company were 11.7 cents in year 2017 and it got increased to
22.7 cents in year 2018. It means profitability performance of Transurban Group has been
improved a lot in current year as compared to year 2017 (Annual Report, 2018).
Use of profitability ratios to depict the financial performance
Net profit ratio: This ratio is highly important to depict the profitability performance of the
company as it provides percentage of net profit earned on total sales amount.
Formula: Net Profit/Sales Revenue (Brigham & Michael, 2013)
Items 2017 2018
Amount in $ Million
Net Profit $ 209.00 $ 468.00
Sales Revenue $ 2,732.00 $ 3,298.00
Net profit Margin 7.65% 14.19%
(Annual Report, 2018)
Transurban Group has earned the net profit margin of 7.65% in year 2017 and it has been
increased to 14.19% in year 2018 that reflects improved profitability performance of company in
year 2018 as compared to year 2017 (Arnold, 2013).
Return on total assets: This ratio provides percentage of net profit earned on total assets used
by the company during the year.
Formula: Net profit/Total Assets (Damodaran, 2011)
Items 2017 2018
Amount in $ Million
Net Profit $ 209.00 $ 468.00
Total Assets $ 23,315.00 $ 26,426.00
Return on total assets 0.90% 1.77%
Paraphrase This Document
Need a fresh take? Get an instant paraphrase of this document with our AI Paraphraser
5
(Annual Report, 2018)
Return on total assets is highly important ratio from point of Transurban Group as it
holds very value of assets in from of toll roads and other fixed assets. It is highly important
management make efforts to earn maximum return through use of available assets. The return on
assets earned by Transurban Group in year 2018 as been increased to 1.77% from 0.90% in year
2017 reflects a positive growth of the company in year 2018 (Zimmerman & Yahya-Zadeh,
2011).
Financial position of Transurban Group as provided in annual report of year 2018
The balance of cash and cash equivalent has been increased from $ 988 million in year
2017 to $ 1130 million in year 2018 that shows increase of 14.37% during the year 2018. The
increase in cash and cash equivalent balance in year 2018 reflects the improved liquidity
performance of the company. The market value of securities has been increased from the $2052
million in year 2017 to $ 2225 million in year 2018 that indicates company had utilized the
retained earnings in proper way to earn maximum return (Phillips & Stawarski, 2016). It has
been noticed that value of market capitalization has been increased from $ 24320 million in year
2017 to $ 26630 million in year 2018. It means total value of issued capital has been improved in
current year providing good amount of holding period return to the shareholders. Free cash
balance has been decreased slightly from $ 1220 million to $ 1215 million but it does impact a
financial position of the company in year 2018 (Annual Report, 2018).
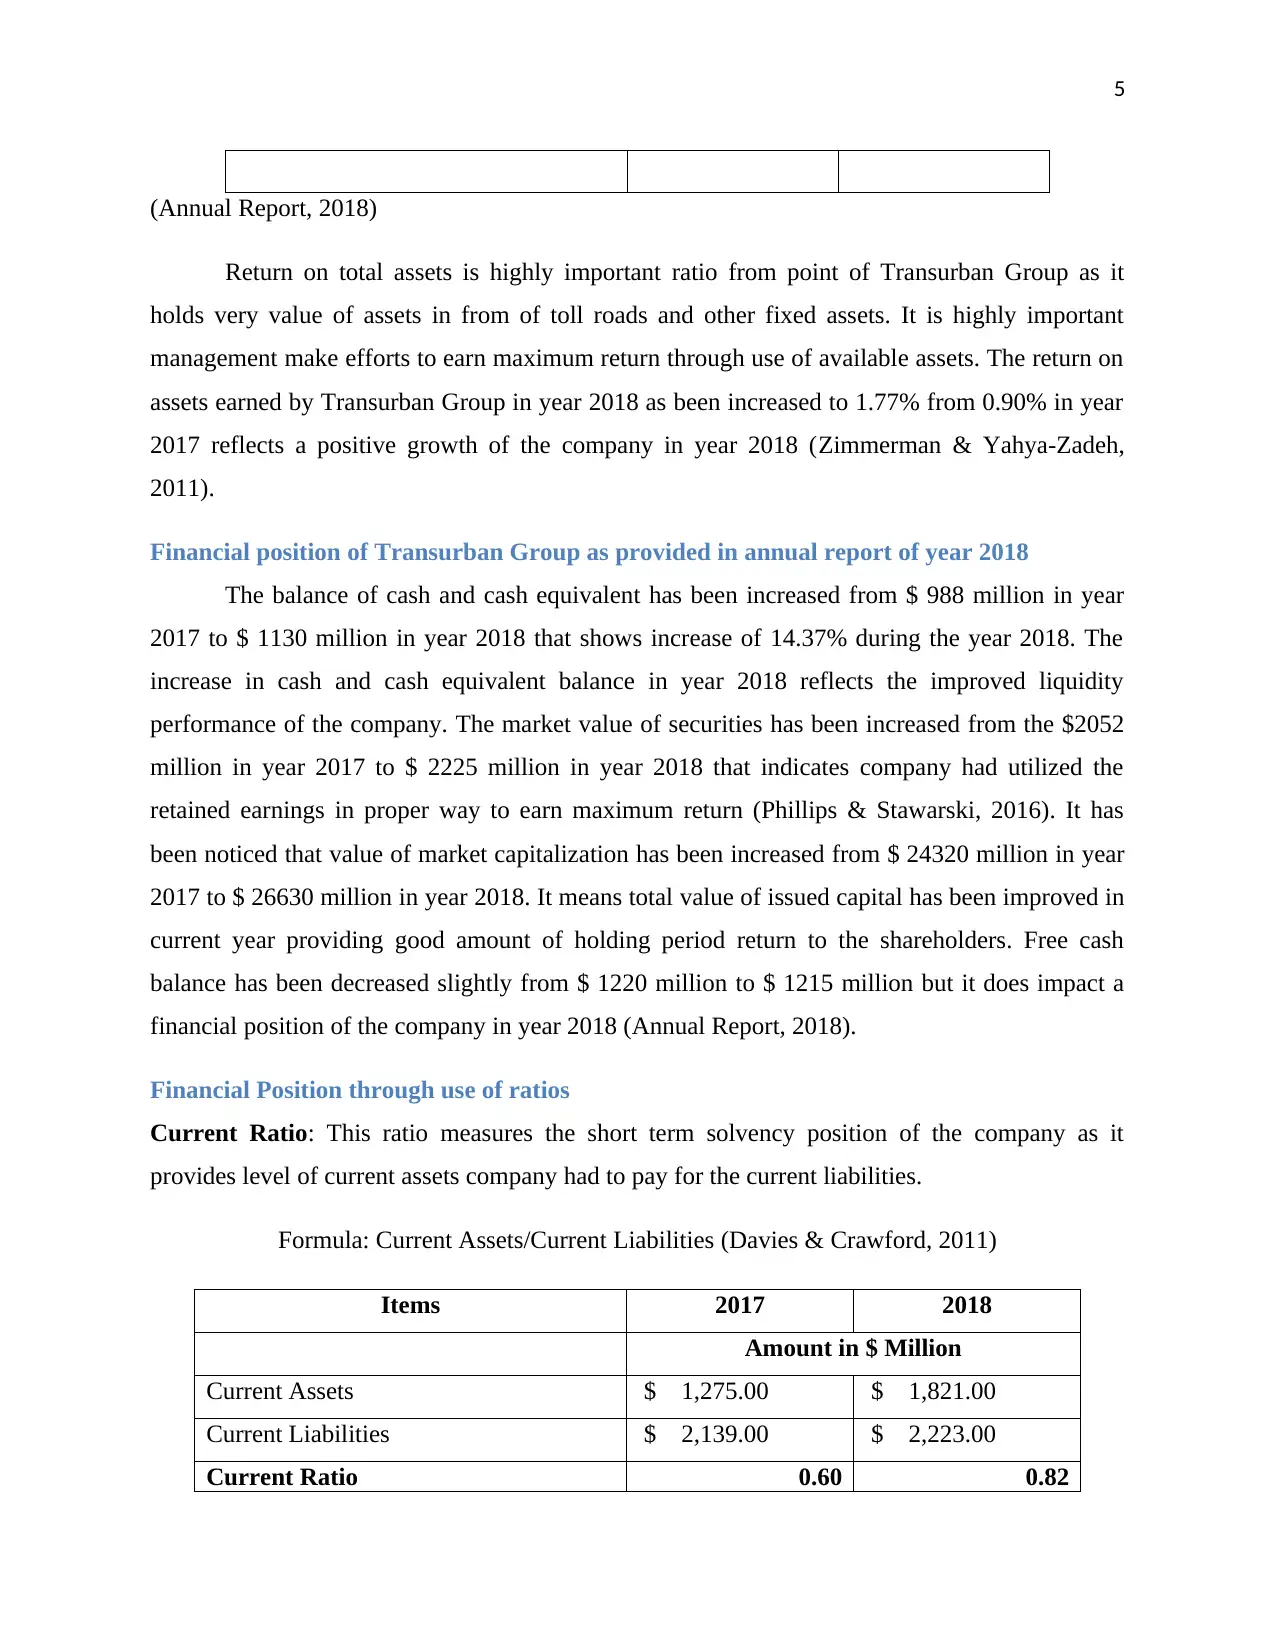
Financial Position through use of ratios
Current Ratio: This ratio measures the short term solvency position of the company as it
provides level of current assets company had to pay for the current liabilities.
Formula: Current Assets/Current Liabilities (Davies & Crawford, 2011)
Items 2017 2018
Amount in $ Million
Current Assets $ 1,275.00 $ 1,821.00
Current Liabilities $ 2,139.00 $ 2,223.00
Current Ratio 0.60 0.82
(Annual Report, 2018)
Return on total assets is highly important ratio from point of Transurban Group as it
holds very value of assets in from of toll roads and other fixed assets. It is highly important
management make efforts to earn maximum return through use of available assets. The return on
assets earned by Transurban Group in year 2018 as been increased to 1.77% from 0.90% in year
2017 reflects a positive growth of the company in year 2018 (Zimmerman & Yahya-Zadeh,
2011).
Financial position of Transurban Group as provided in annual report of year 2018
The balance of cash and cash equivalent has been increased from $ 988 million in year
2017 to $ 1130 million in year 2018 that shows increase of 14.37% during the year 2018. The
increase in cash and cash equivalent balance in year 2018 reflects the improved liquidity
performance of the company. The market value of securities has been increased from the $2052
million in year 2017 to $ 2225 million in year 2018 that indicates company had utilized the
retained earnings in proper way to earn maximum return (Phillips & Stawarski, 2016). It has
been noticed that value of market capitalization has been increased from $ 24320 million in year
2017 to $ 26630 million in year 2018. It means total value of issued capital has been improved in
current year providing good amount of holding period return to the shareholders. Free cash
balance has been decreased slightly from $ 1220 million to $ 1215 million but it does impact a
financial position of the company in year 2018 (Annual Report, 2018).
Financial Position through use of ratios
Current Ratio: This ratio measures the short term solvency position of the company as it
provides level of current assets company had to pay for the current liabilities.
Formula: Current Assets/Current Liabilities (Davies & Crawford, 2011)
Items 2017 2018
Amount in $ Million
Current Assets $ 1,275.00 $ 1,821.00
Current Liabilities $ 2,139.00 $ 2,223.00
Current Ratio 0.60 0.82
6
(Annual Report, 2018)
Liquidity performance has been improved in current year but it is not enough to settle all
the current liabilities due in next year (Lumby & Jones, 2017).
Solution 2: UN Sustainable Development Goals progress report
The Sustainable Development Goals (SDGs) are being developed by the United Nations
(UN) to be used by the UN member states. They indicate the global challenges faced by the
member states that include social, economic and environmental development issues such as
health, education, poverty, equality, energy, global warning, social justice and other such global
challenges. Transurban is a road operator company and has effectively complied with the UN
sustainable development goals that are relevant for the company. The company develops and
published its UN sustainable development goals progress report for providing description
regarding the ways in which business apply SDG targets and measuring the business
performance against the target. The company has indicated that it complies effectively with
sustainable development goals of SDG 3, 5,7,8,9,11,12,13 and 17.
The SDG 3 goals related to ensuring the good health and wellbeing and the company has
disclosed that in relation to this goal the company has undertaken the initiatives of developing a
wellbeing program for employees and working towards eliminating fatalities with the use of its
roads. The company has also undertaken the initiatives for avoiding discrimination in any form
within its workplace by ensuring the use of flexible work practices, recruitment approaches for
enhancing women diversity and ensuring to provide equal participation and opportunities to
women. Transurban has also addressed the SDG 7 goal in relation to promoting affordable and
clean energy and undertaken the initiatives of implementing the use of renewable energy sources
and minimizing energy usage and reducing the energy consumption by about 20% till the
financial year 2023. The company has also followed the SDG 8 goals in relation to adopting the
use of decent work and economic growth (Ford, 2015). It has undertaken initiatives such as
developing projects that relate to maximize economic health and creating job opportunities. It
has also emphasized on development of sustainable materials and waste management strategies.
It has also developed and established development projects for creating employment
⊘ This is a preview!⊘
Do you want full access?
Subscribe today to unlock all pages.
Trusted by 1+ million students worldwide
7
opportunities. Transurban initiative in context of this SDG goal also included elimination of
gender gap and any type of forced labor or slavery practices. In addition to this, it has also
emphasized on protecting the rights of labor for providing safe and securing working
environment to all its employees. The introduction of enterprise risk management and employees
health and safety induction modules are key initiatives that are being undertaken by Transurban
in this context (Transurban, 2018).
SDG 9 goal has fostered innovation and infrastructure development within industries.
Transurban in compliance with this goal has undertaken the initiative of developing quality,
reliable and sustainable infrastructure for carrying out its projects. The company also aims to
upgrade its infrastructure for hennaing the adoption of sustainability within it’s for maximizing
its resource use efficiency and ensuring that it is environmentally sound. Transurban also
integrated the use of innovative technologies and practices for enhancing scientific research and
promoting innovation within its business processes. The company also complies with SDG 11
goal for promoting the development of sustainable cities and communities. In this context, the
company initiatives include promoting development of accessible and safe transport and
reducing the environment impact of its various activities. The SDG 12 goal developed in context
to promoting responsible consumption and production has also been followed by Transurban in
an effective manner. The company in this context has developed partnership with Beyond Zero
Emissions for reducing the material footprint and maximizing the efficient use of natural
resources. It has also developed a waste management strategy that aims to reduce the production
of waste materials from its various business operations through the adoption of tactics such as
reuse and recycling. Lastly, it has complied with the sustainable development goals of SDG 13
for climate action and SDG 17 for undertaking partnership of the goals. The company as such
has developed climate change strategy and creates a multiple stakeholder partnerships for
promoting the adoption of these goals within all the countries (Transurban, 2018).
It can be said from the analysis of the initiatives undertaken by Transurban in relation to
the SDG goals that it is actively involved in developing a better and more sustainable future for
all by addressing effectively the global challenges. The company has placed increased
importance on overcoming the global issues identified by SDG goals and takes necessary
initiatives for addressing all the goals identified. Transurban has meaningfully disclosed the way
Paraphrase This Document
Need a fresh take? Get an instant paraphrase of this document with our AI Paraphraser
8
in which the SDG goals are measured and reporting its contributions adequately. It can be said
that Transurban is actively involved in resolving the global sustainable development challenges
effectively (The Conversation, 2018).
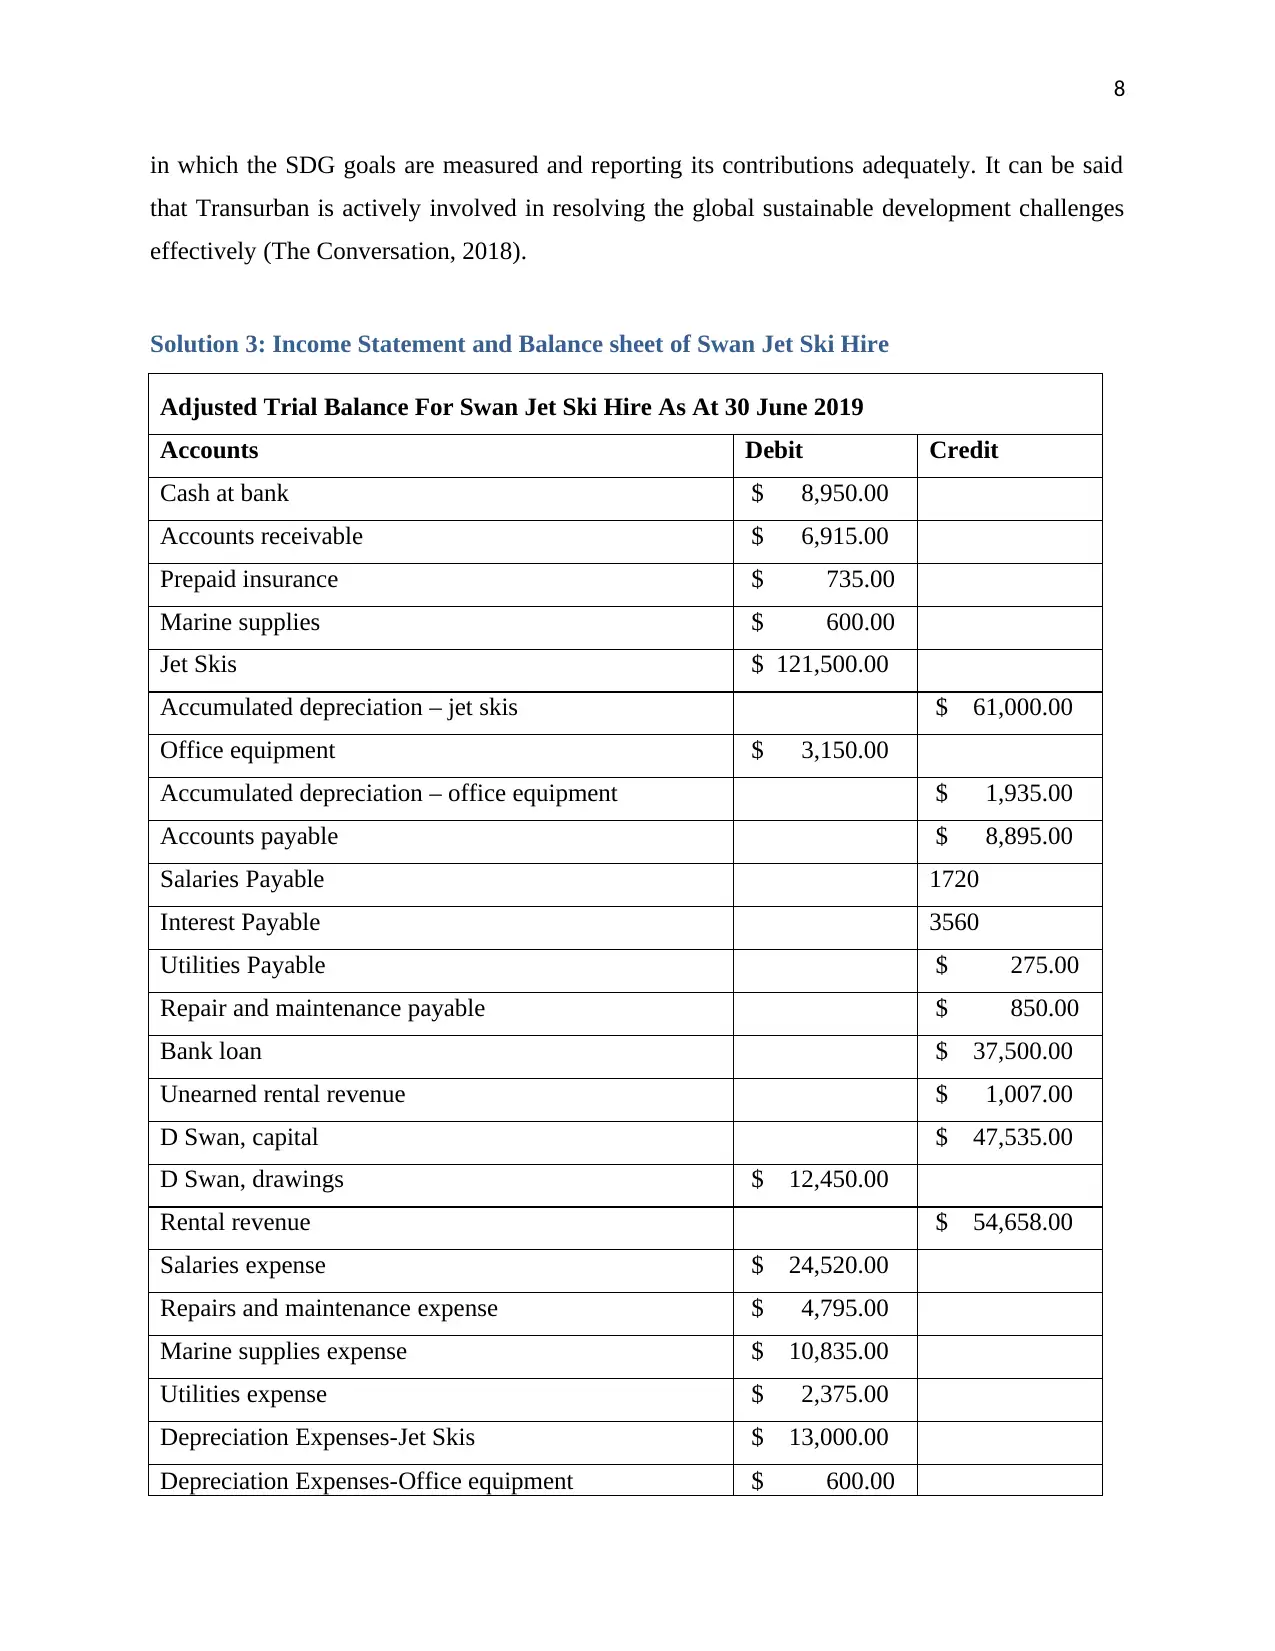
Solution 3: Income Statement and Balance sheet of Swan Jet Ski Hire
Adjusted Trial Balance For Swan Jet Ski Hire As At 30 June 2019
Accounts Debit Credit
Cash at bank $ 8,950.00
Accounts receivable $ 6,915.00
Prepaid insurance $ 735.00
Marine supplies $ 600.00
Jet Skis $ 121,500.00
Accumulated depreciation – jet skis $ 61,000.00
Office equipment $ 3,150.00
Accumulated depreciation – office equipment $ 1,935.00
Accounts payable $ 8,895.00
Salaries Payable 1720
Interest Payable 3560
Utilities Payable $ 275.00
Repair and maintenance payable $ 850.00
Bank loan $ 37,500.00
Unearned rental revenue $ 1,007.00
D Swan, capital $ 47,535.00
D Swan, drawings $ 12,450.00
Rental revenue $ 54,658.00
Salaries expense $ 24,520.00
Repairs and maintenance expense $ 4,795.00
Marine supplies expense $ 10,835.00
Utilities expense $ 2,375.00
Depreciation Expenses-Jet Skis $ 13,000.00
Depreciation Expenses-Office equipment $ 600.00
in which the SDG goals are measured and reporting its contributions adequately. It can be said
that Transurban is actively involved in resolving the global sustainable development challenges
effectively (The Conversation, 2018).
Solution 3: Income Statement and Balance sheet of Swan Jet Ski Hire
Adjusted Trial Balance For Swan Jet Ski Hire As At 30 June 2019
Accounts Debit Credit
Cash at bank $ 8,950.00
Accounts receivable $ 6,915.00
Prepaid insurance $ 735.00
Marine supplies $ 600.00
Jet Skis $ 121,500.00
Accumulated depreciation – jet skis $ 61,000.00
Office equipment $ 3,150.00
Accumulated depreciation – office equipment $ 1,935.00
Accounts payable $ 8,895.00
Salaries Payable 1720
Interest Payable 3560
Utilities Payable $ 275.00
Repair and maintenance payable $ 850.00
Bank loan $ 37,500.00
Unearned rental revenue $ 1,007.00
D Swan, capital $ 47,535.00
D Swan, drawings $ 12,450.00
Rental revenue $ 54,658.00
Salaries expense $ 24,520.00
Repairs and maintenance expense $ 4,795.00
Marine supplies expense $ 10,835.00
Utilities expense $ 2,375.00
Depreciation Expenses-Jet Skis $ 13,000.00
Depreciation Expenses-Office equipment $ 600.00
9
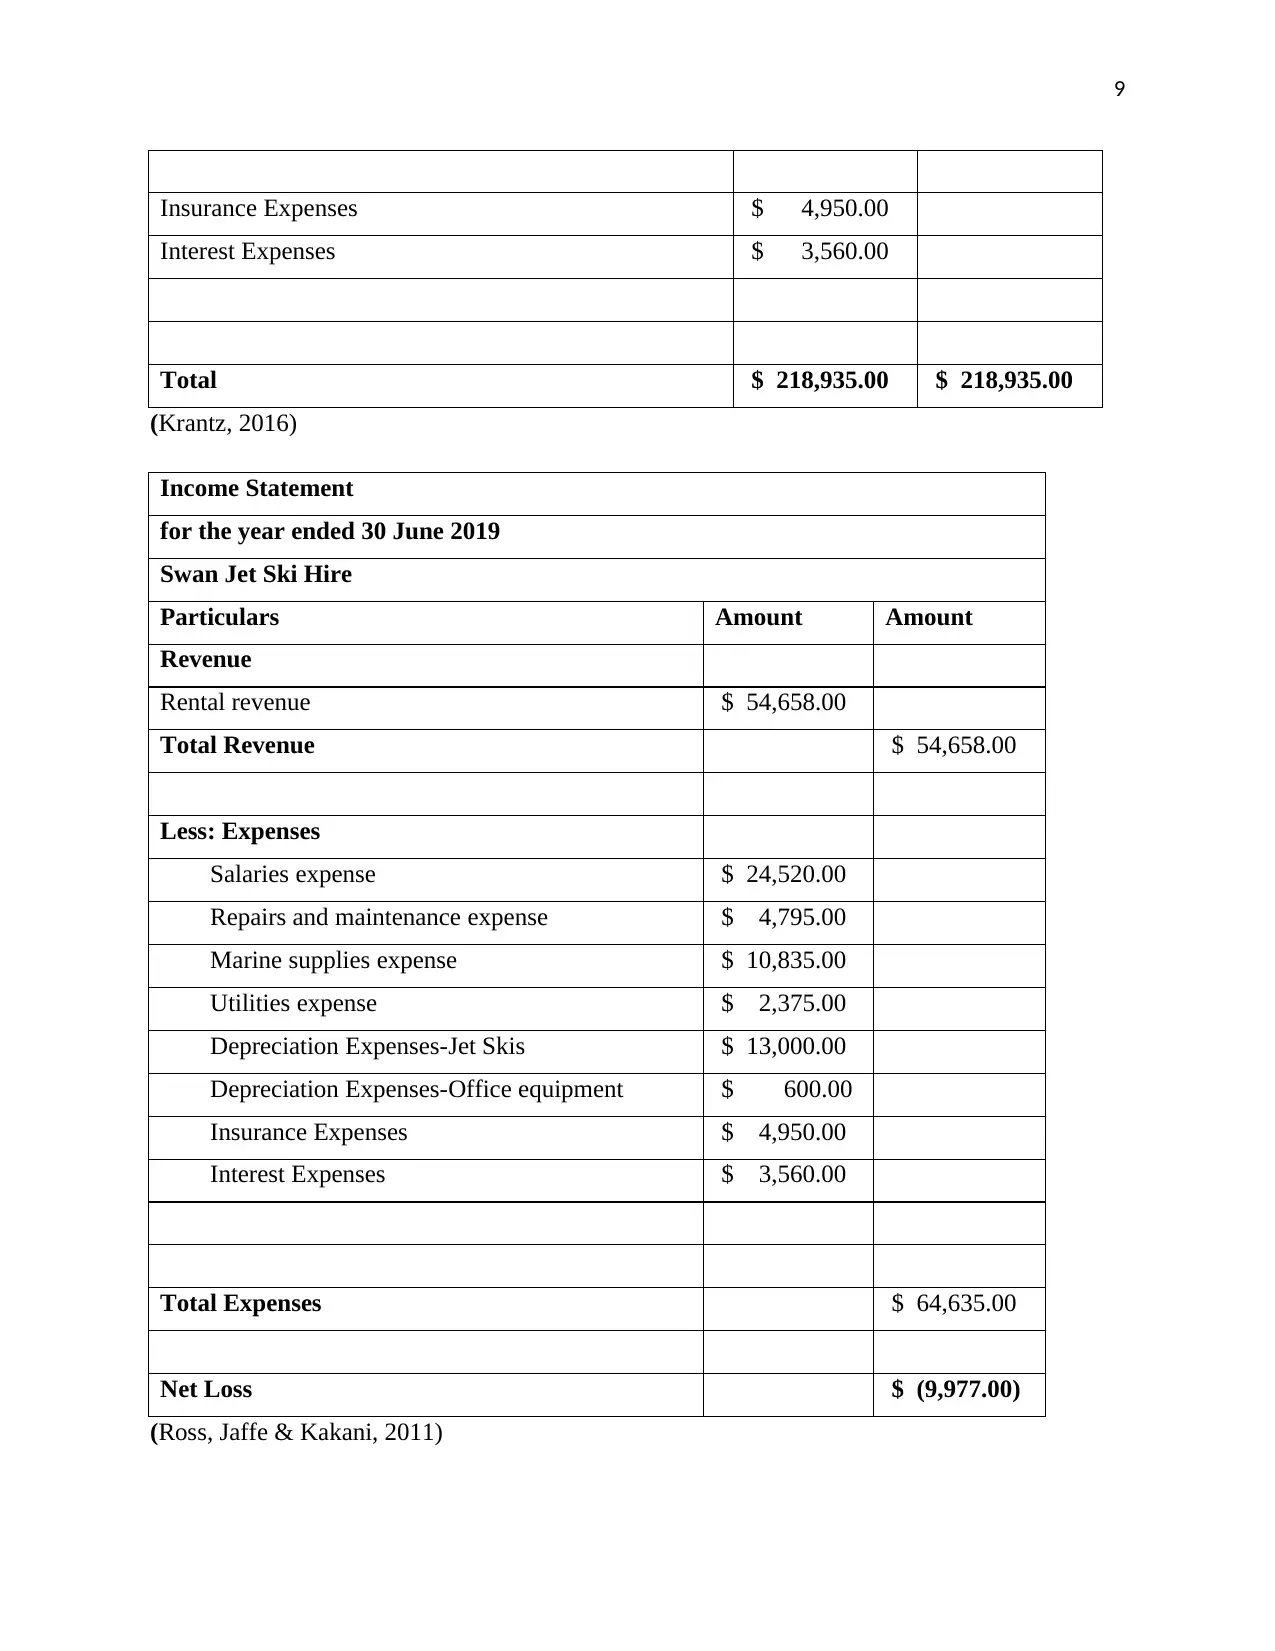
Insurance Expenses $ 4,950.00
Interest Expenses $ 3,560.00
Total $ 218,935.00 $ 218,935.00
(Krantz, 2016)
Income Statement
for the year ended 30 June 2019
Swan Jet Ski Hire
Particulars Amount Amount
Revenue
Rental revenue $ 54,658.00
Total Revenue $ 54,658.00
Less: Expenses
Salaries expense $ 24,520.00
Repairs and maintenance expense $ 4,795.00
Marine supplies expense $ 10,835.00
Utilities expense $ 2,375.00
Depreciation Expenses-Jet Skis $ 13,000.00
Depreciation Expenses-Office equipment $ 600.00
Insurance Expenses $ 4,950.00
Interest Expenses $ 3,560.00
Total Expenses $ 64,635.00
Net Loss $ (9,977.00)
(Ross, Jaffe & Kakani, 2011)
Insurance Expenses $ 4,950.00
Interest Expenses $ 3,560.00
Total $ 218,935.00 $ 218,935.00
(Krantz, 2016)
Income Statement
for the year ended 30 June 2019
Swan Jet Ski Hire
Particulars Amount Amount
Revenue
Rental revenue $ 54,658.00
Total Revenue $ 54,658.00
Less: Expenses
Salaries expense $ 24,520.00
Repairs and maintenance expense $ 4,795.00
Marine supplies expense $ 10,835.00
Utilities expense $ 2,375.00
Depreciation Expenses-Jet Skis $ 13,000.00
Depreciation Expenses-Office equipment $ 600.00
Insurance Expenses $ 4,950.00
Interest Expenses $ 3,560.00
Total Expenses $ 64,635.00
Net Loss $ (9,977.00)
(Ross, Jaffe & Kakani, 2011)
⊘ This is a preview!⊘
Do you want full access?
Subscribe today to unlock all pages.
Trusted by 1+ million students worldwide

10
Balance Sheet
Balance Sheet
Paraphrase This Document
Need a fresh take? Get an instant paraphrase of this document with our AI Paraphraser
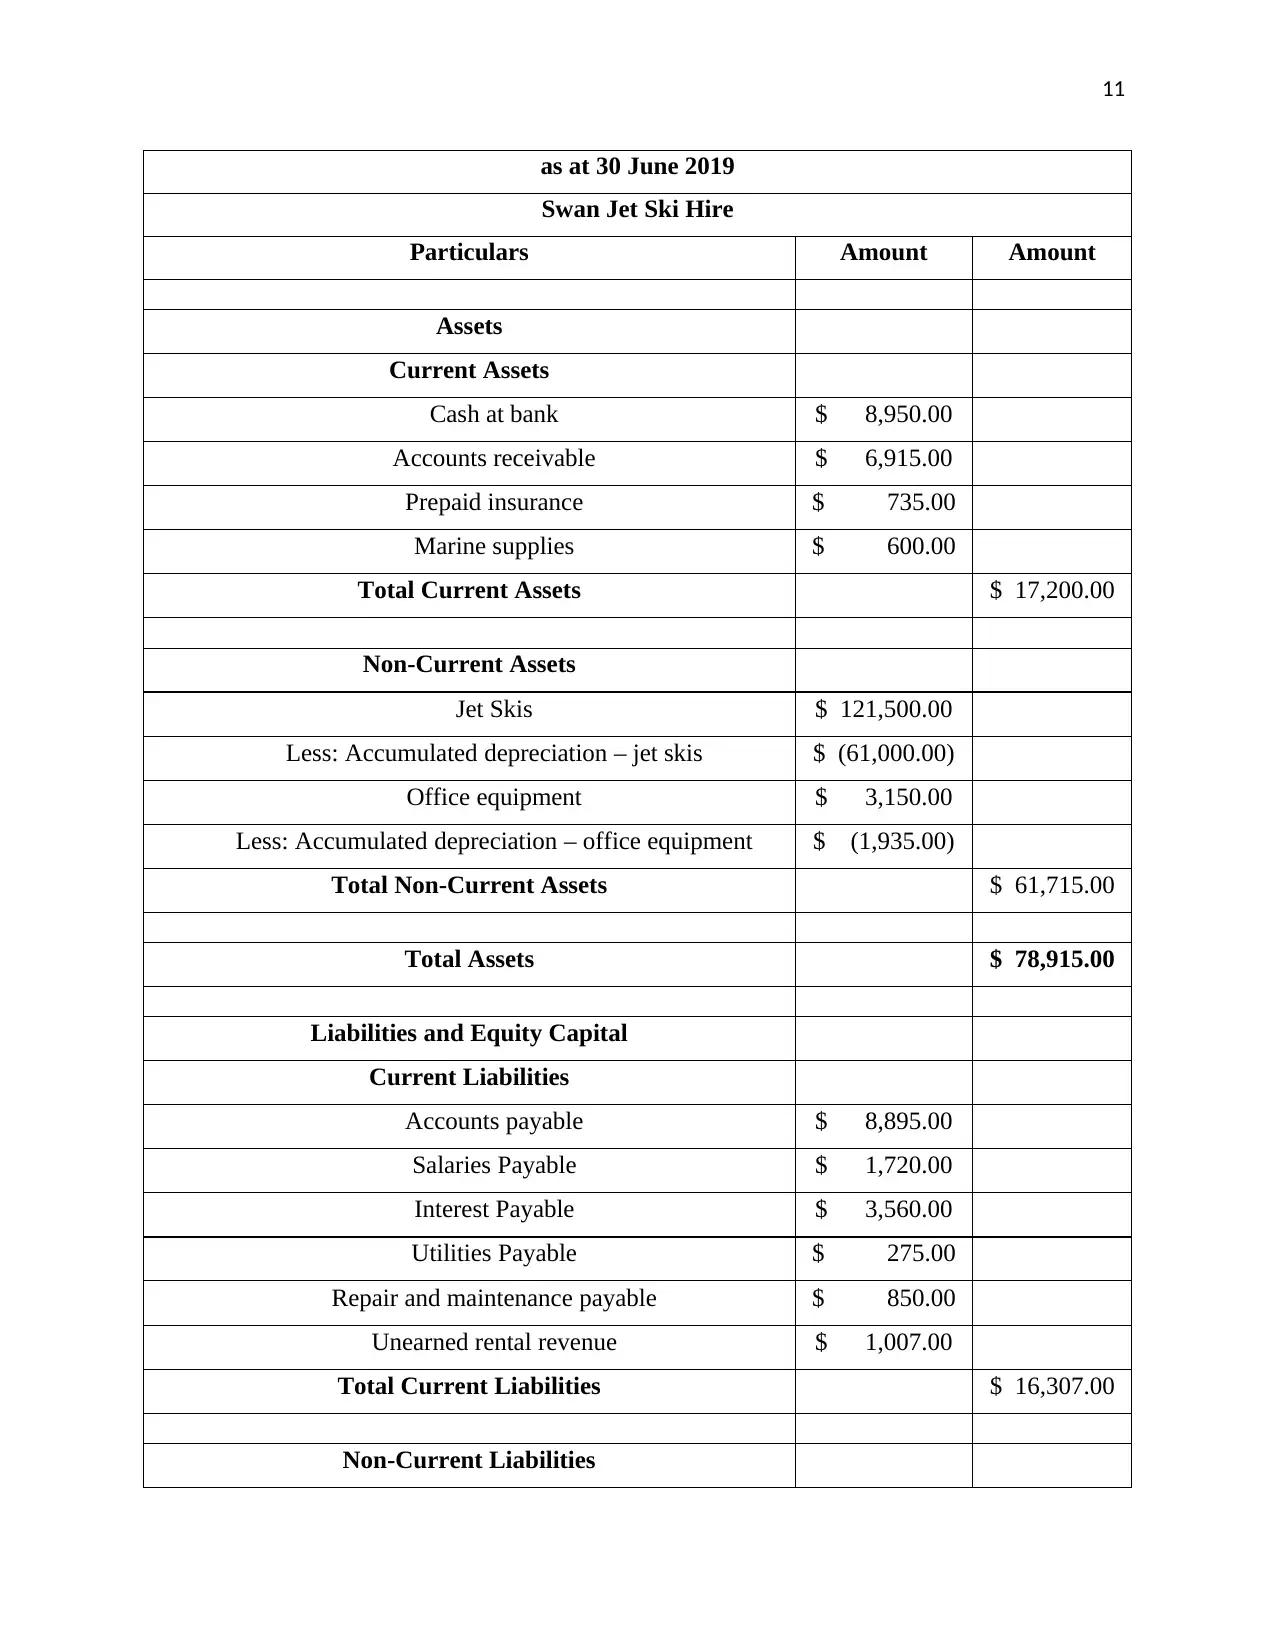
11
as at 30 June 2019
Swan Jet Ski Hire
Particulars Amount Amount
Assets
Current Assets
Cash at bank $ 8,950.00
Accounts receivable $ 6,915.00
Prepaid insurance $ 735.00
Marine supplies $ 600.00
Total Current Assets $ 17,200.00
Non-Current Assets
Jet Skis $ 121,500.00
Less: Accumulated depreciation – jet skis $ (61,000.00)
Office equipment $ 3,150.00
Less: Accumulated depreciation – office equipment $ (1,935.00)
Total Non-Current Assets $ 61,715.00
Total Assets $ 78,915.00
Liabilities and Equity Capital
Current Liabilities
Accounts payable $ 8,895.00
Salaries Payable $ 1,720.00
Interest Payable $ 3,560.00
Utilities Payable $ 275.00
Repair and maintenance payable $ 850.00
Unearned rental revenue $ 1,007.00
Total Current Liabilities $ 16,307.00
Non-Current Liabilities
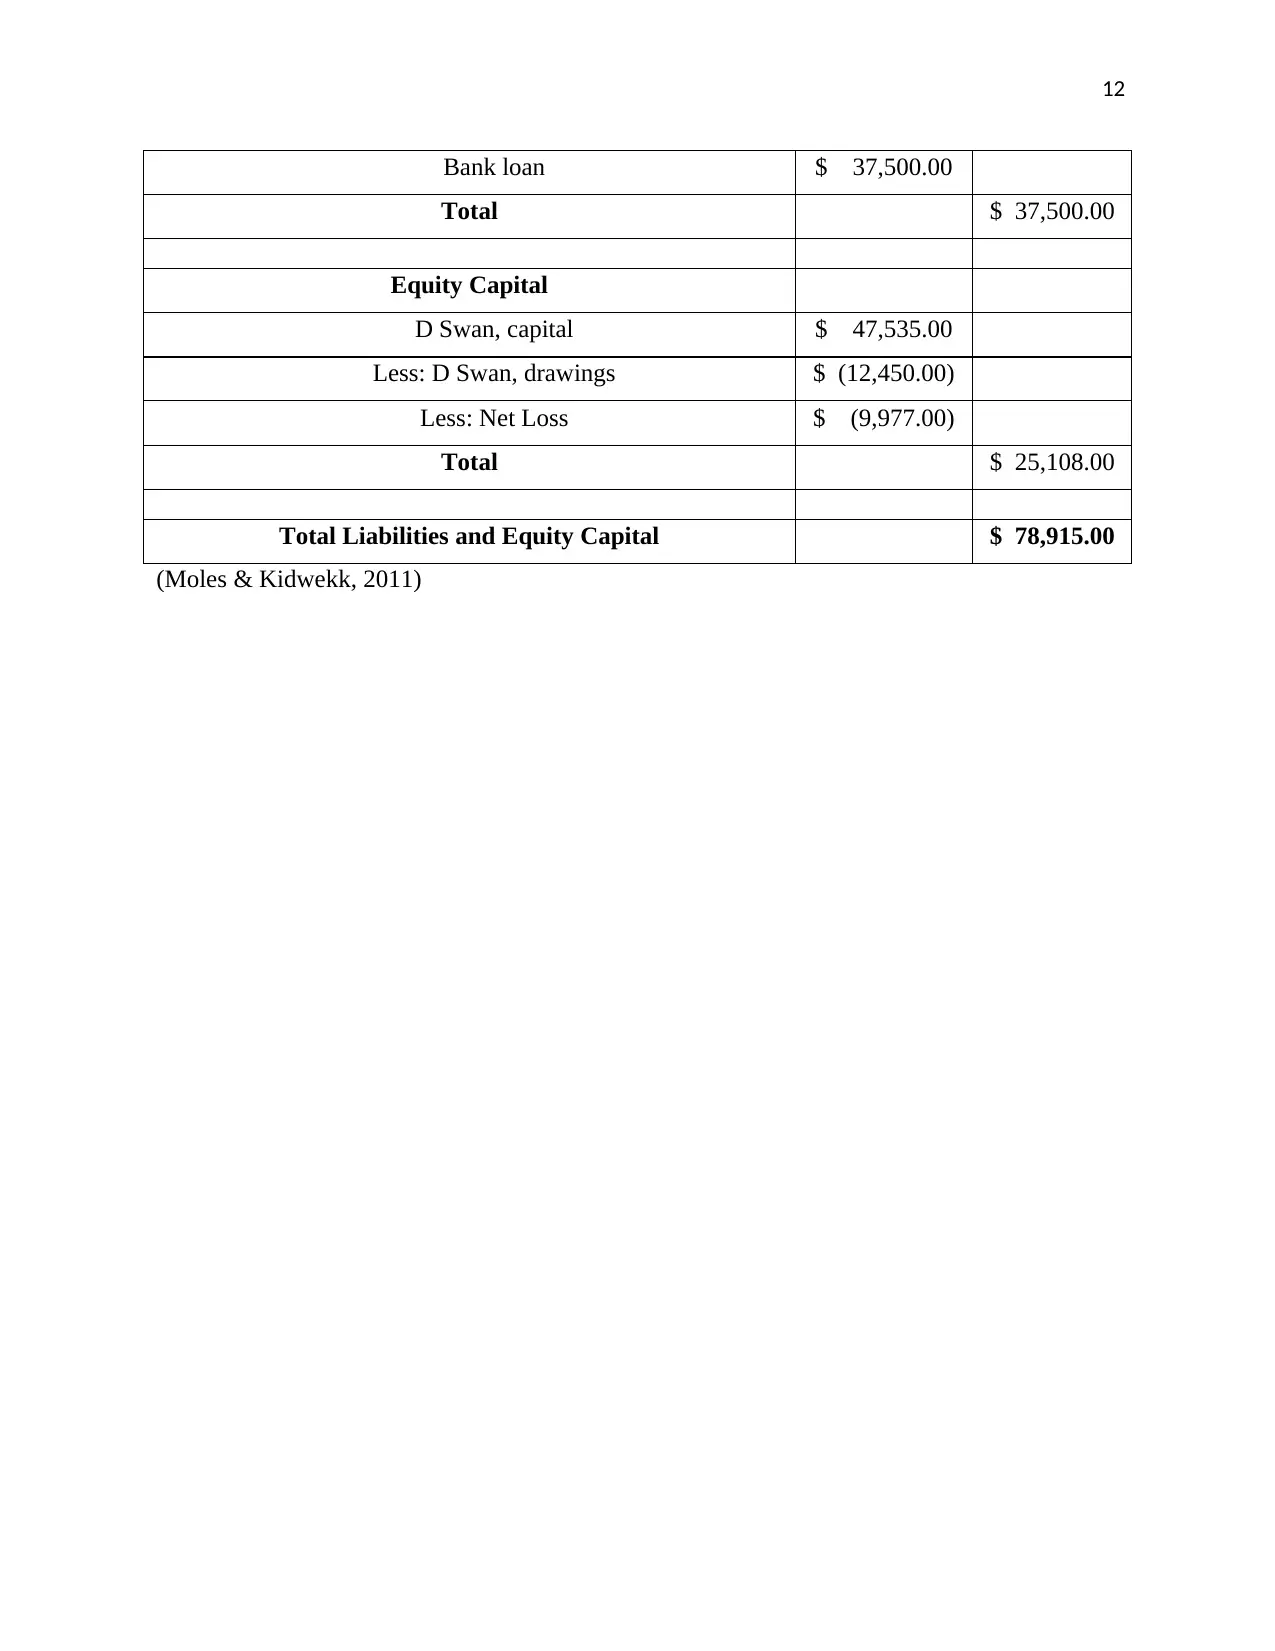
12
Bank loan $ 37,500.00
Total $ 37,500.00
Equity Capital
D Swan, capital $ 47,535.00
Less: D Swan, drawings $ (12,450.00)
Less: Net Loss $ (9,977.00)
Total $ 25,108.00
Total Liabilities and Equity Capital $ 78,915.00
(Moles & Kidwekk, 2011)
Bank loan $ 37,500.00
Total $ 37,500.00
Equity Capital
D Swan, capital $ 47,535.00
Less: D Swan, drawings $ (12,450.00)
Less: Net Loss $ (9,977.00)
Total $ 25,108.00
Total Liabilities and Equity Capital $ 78,915.00
(Moles & Kidwekk, 2011)
⊘ This is a preview!⊘
Do you want full access?
Subscribe today to unlock all pages.
Trusted by 1+ million students worldwide
1 out of 14
Related Documents


Your All-in-One AI-Powered Toolkit for Academic Success.
+13062052269
info@desklib.com
Available 24*7 on WhatsApp / Email
![[object Object]](/_next/static/media/star-bottom.7253800d.svg)
Unlock your academic potential
Copyright © 2020–2026 A2Z Services. All Rights Reserved. Developed and managed by ZUCOL.