Analyzing Travel Data: Patterns of UK and Overseas Residents - Report
VerifiedAdded on 2020/10/05
|19
|2985
|382
Report
AI Summary
This report analyzes travel data from Travelpac to understand the travel patterns of UK and overseas residents. The analysis covers the number of travelers to different countries, differentiating between UK residents and overseas residents. It examines travel modes (air, sea, tunnel) and the purposes of travel (business, holidays, study, VFR, transit). The report includes tables and graphs to visualize the data, providing interpretations of the findings. Standard statistical analyses, including correlations, frequencies, and descriptive statistics, are presented to support the conclusions. The data reveals key trends, such as the popularity of air travel and the dominance of holiday travel among overseas residents. The report aims to provide insights into the travel preferences and behaviors of different groups, offering a comprehensive overview of the data and its implications.

Using Data to Build
Business Practice
Business Practice
Paraphrase This Document
Need a fresh take? Get an instant paraphrase of this document with our AI Paraphraser
Table of Contents
INTRODUCTION ..........................................................................................................................1
ANALYSING DATA......................................................................................................................1
STANDARD STATISTIC...............................................................................................................7
Finding and recommendations.......................................................................................................14
CONCLUSION..............................................................................................................................14
REFRENCES.................................................................................................................................16
INTRODUCTION
In today's era, almost each company use to make decision in context of their business
thus they required simplified, assorted, arranged, authentic data so that desired objective can be
attained (Higgins, Omer and Phillips, 2015). Business statistics are the vital tool that ease the
process of decision making that sociality includes some crucial steps that includes strategy,
determine key areas, data targeting, collecting and analysing data and turning insight into
actions. There are various types of business intelligence tool that are used in simple manner that
help decision maker to take useful decision. In this data of Travelpac that support to analyse and
ascertain the different patter of travel by UK residents and other travellers. Apart this interesting
findings and appropriate recommendations about potential target segments are discussed in this
report.
ANALYSING DATA
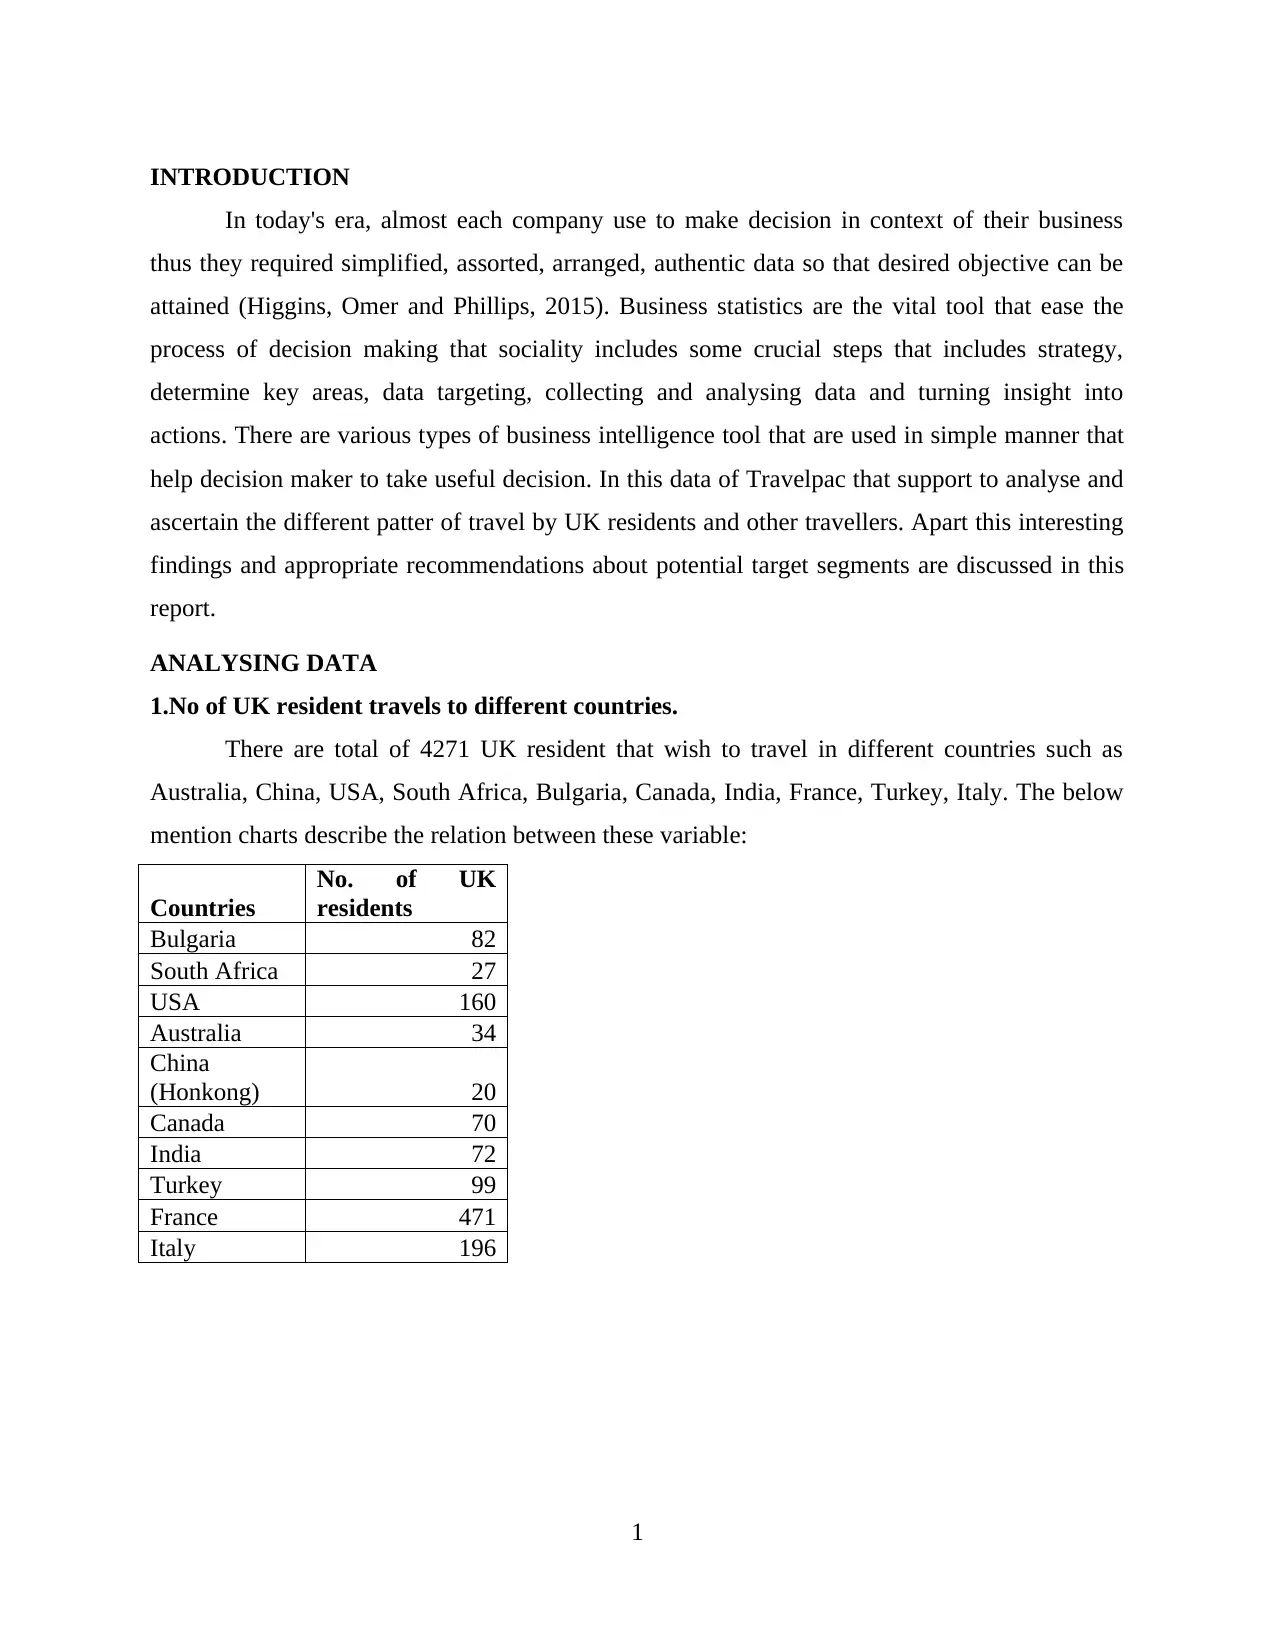
1.No of UK resident travels to different countries.
There are total of 4271 UK resident that wish to travel in different countries such as
Australia, China, USA, South Africa, Bulgaria, Canada, India, France, Turkey, Italy. The below
mention charts describe the relation between these variable:
Countries
No. of UK
residents
Bulgaria 82
South Africa 27
USA 160
Australia 34
China
(Honkong) 20
Canada 70
India 72
Turkey 99
France 471
Italy 196
1
In today's era, almost each company use to make decision in context of their business
thus they required simplified, assorted, arranged, authentic data so that desired objective can be
attained (Higgins, Omer and Phillips, 2015). Business statistics are the vital tool that ease the
process of decision making that sociality includes some crucial steps that includes strategy,
determine key areas, data targeting, collecting and analysing data and turning insight into
actions. There are various types of business intelligence tool that are used in simple manner that
help decision maker to take useful decision. In this data of Travelpac that support to analyse and
ascertain the different patter of travel by UK residents and other travellers. Apart this interesting
findings and appropriate recommendations about potential target segments are discussed in this
report.
ANALYSING DATA
1.No of UK resident travels to different countries.
There are total of 4271 UK resident that wish to travel in different countries such as
Australia, China, USA, South Africa, Bulgaria, Canada, India, France, Turkey, Italy. The below
mention charts describe the relation between these variable:
Countries
No. of UK
residents
Bulgaria 82
South Africa 27
USA 160
Australia 34
China
(Honkong) 20
Canada 70
India 72
Turkey 99
France 471
Italy 196
1
⊘ This is a preview!⊘
Do you want full access?
Subscribe today to unlock all pages.
Trusted by 1+ million students worldwide
Bulgaria
South Africa
USA
Australia
China (Honkong)
Canada
India
Turkey
France
Italy
0
50
100
150
200
250
300
350
400
450
500
82
27
160
34 20
70 72 99
471
196
No. of UK residents
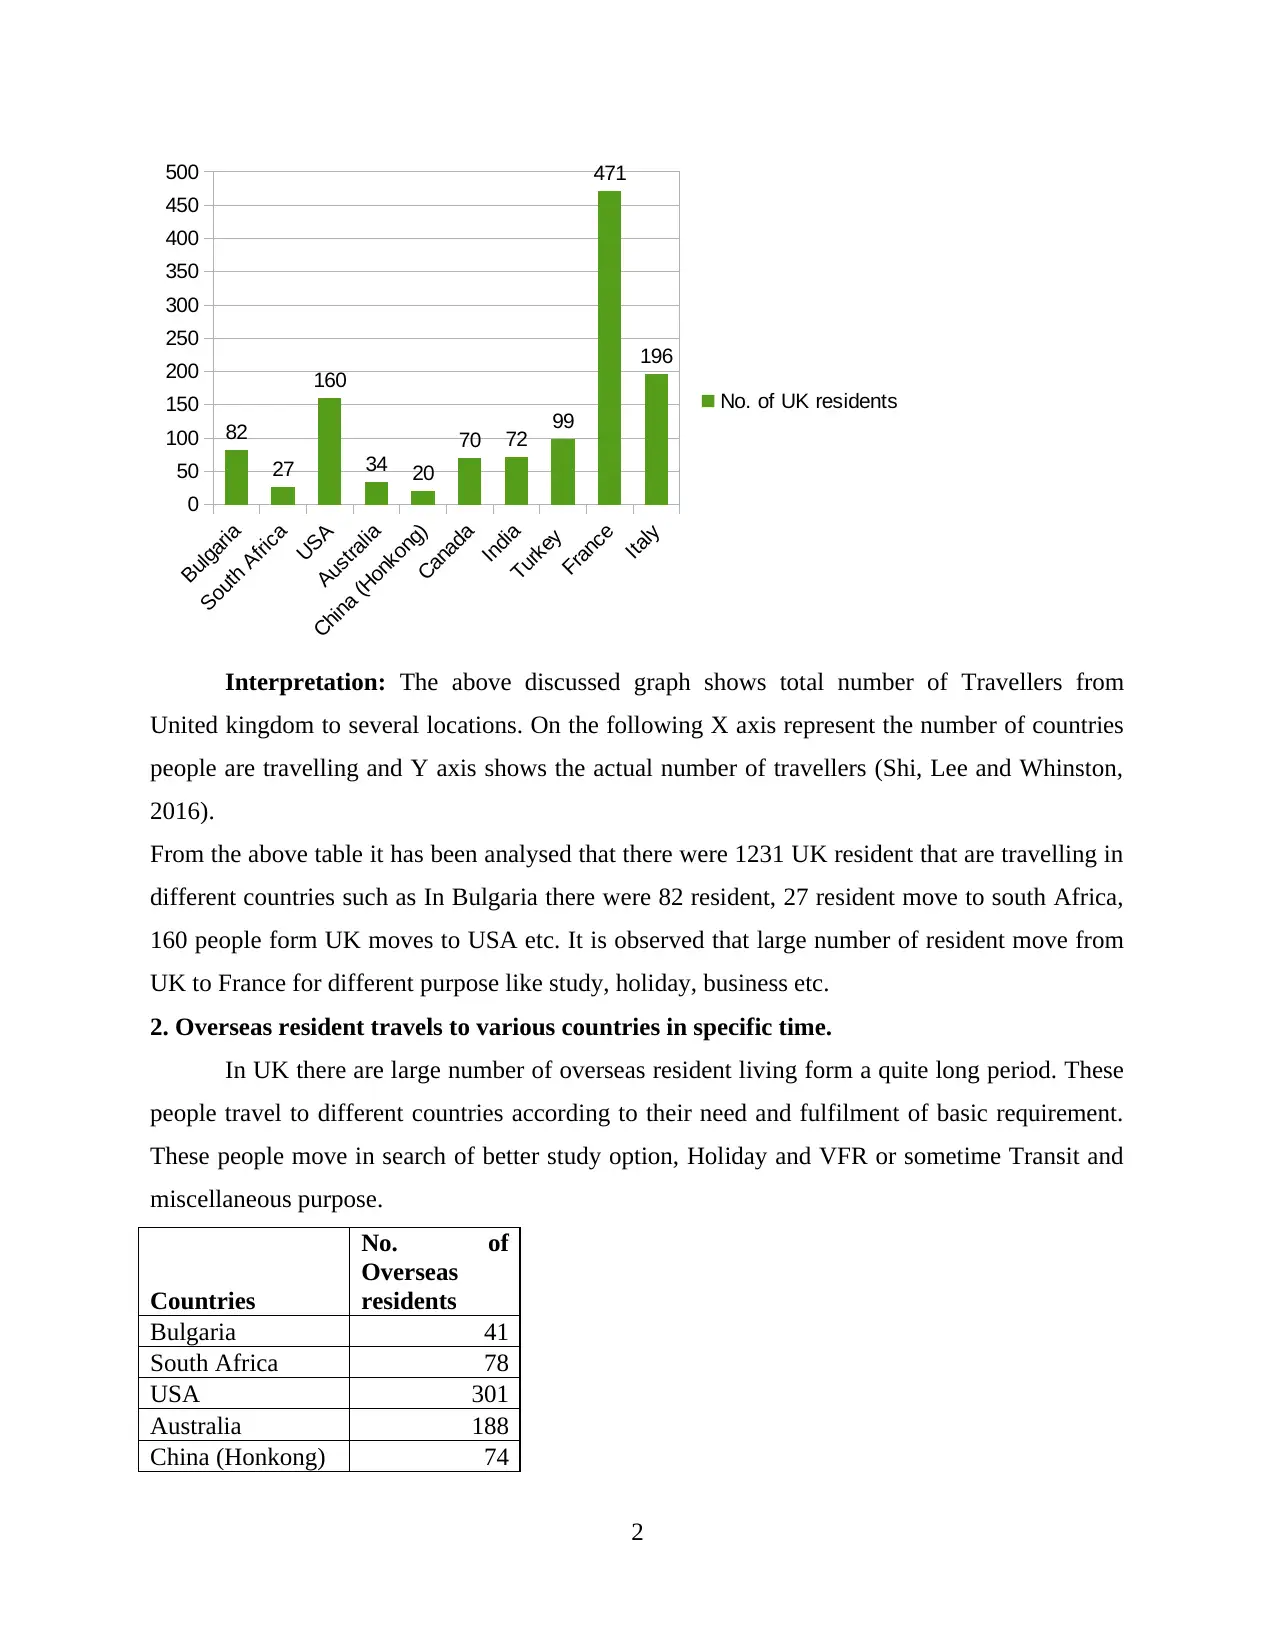
Interpretation: The above discussed graph shows total number of Travellers from
United kingdom to several locations. On the following X axis represent the number of countries
people are travelling and Y axis shows the actual number of travellers (Shi, Lee and Whinston,
2016).
From the above table it has been analysed that there were 1231 UK resident that are travelling in
different countries such as In Bulgaria there were 82 resident, 27 resident move to south Africa,
160 people form UK moves to USA etc. It is observed that large number of resident move from
UK to France for different purpose like study, holiday, business etc.
2. Overseas resident travels to various countries in specific time.
In UK there are large number of overseas resident living form a quite long period. These
people travel to different countries according to their need and fulfilment of basic requirement.
These people move in search of better study option, Holiday and VFR or sometime Transit and
miscellaneous purpose.
Countries
No. of
Overseas
residents
Bulgaria 41
South Africa 78
USA 301
Australia 188
China (Honkong) 74
2
South Africa
USA
Australia
China (Honkong)
Canada
India
Turkey
France
Italy
0
50
100
150
200
250
300
350
400
450
500
82
27
160
34 20
70 72 99
471
196
No. of UK residents
Interpretation: The above discussed graph shows total number of Travellers from
United kingdom to several locations. On the following X axis represent the number of countries
people are travelling and Y axis shows the actual number of travellers (Shi, Lee and Whinston,
2016).
From the above table it has been analysed that there were 1231 UK resident that are travelling in
different countries such as In Bulgaria there were 82 resident, 27 resident move to south Africa,
160 people form UK moves to USA etc. It is observed that large number of resident move from
UK to France for different purpose like study, holiday, business etc.
2. Overseas resident travels to various countries in specific time.
In UK there are large number of overseas resident living form a quite long period. These
people travel to different countries according to their need and fulfilment of basic requirement.
These people move in search of better study option, Holiday and VFR or sometime Transit and
miscellaneous purpose.
Countries
No. of
Overseas
residents
Bulgaria 41
South Africa 78
USA 301
Australia 188
China (Honkong) 74
2
Paraphrase This Document
Need a fresh take? Get an instant paraphrase of this document with our AI Paraphraser
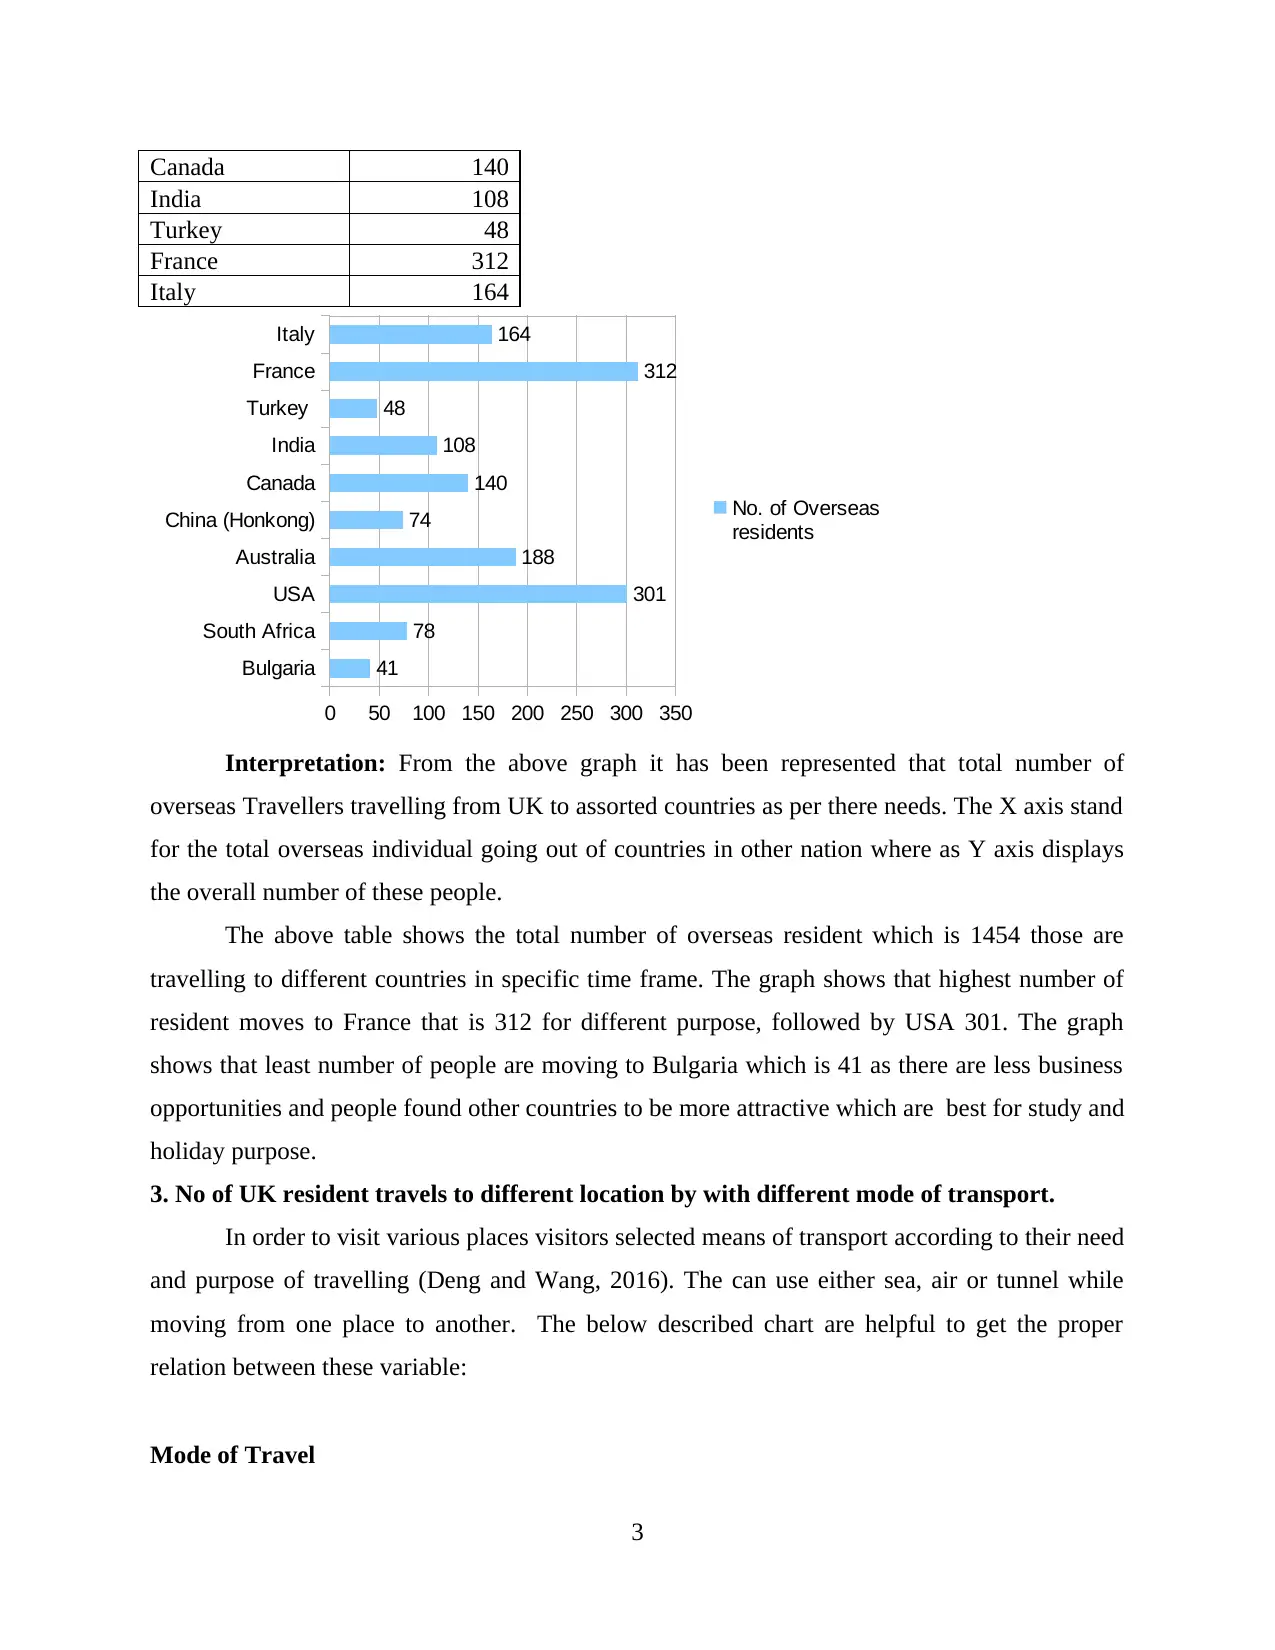
Canada 140
India 108
Turkey 48
France 312
Italy 164
Bulgaria
South Africa
USA
Australia
China (Honkong)
Canada
India
Turkey
France
Italy
0 50 100 150 200 250 300 350
41
78
301
188
74
140
108
48
312
164
No. of Overseas
residents
Interpretation: From the above graph it has been represented that total number of
overseas Travellers travelling from UK to assorted countries as per there needs. The X axis stand
for the total overseas individual going out of countries in other nation where as Y axis displays
the overall number of these people.
The above table shows the total number of overseas resident which is 1454 those are
travelling to different countries in specific time frame. The graph shows that highest number of
resident moves to France that is 312 for different purpose, followed by USA 301. The graph
shows that least number of people are moving to Bulgaria which is 41 as there are less business
opportunities and people found other countries to be more attractive which are best for study and
holiday purpose.
3. No of UK resident travels to different location by with different mode of transport.
In order to visit various places visitors selected means of transport according to their need
and purpose of travelling (Deng and Wang, 2016). The can use either sea, air or tunnel while
moving from one place to another. The below described chart are helpful to get the proper
relation between these variable:
Mode of Travel
3
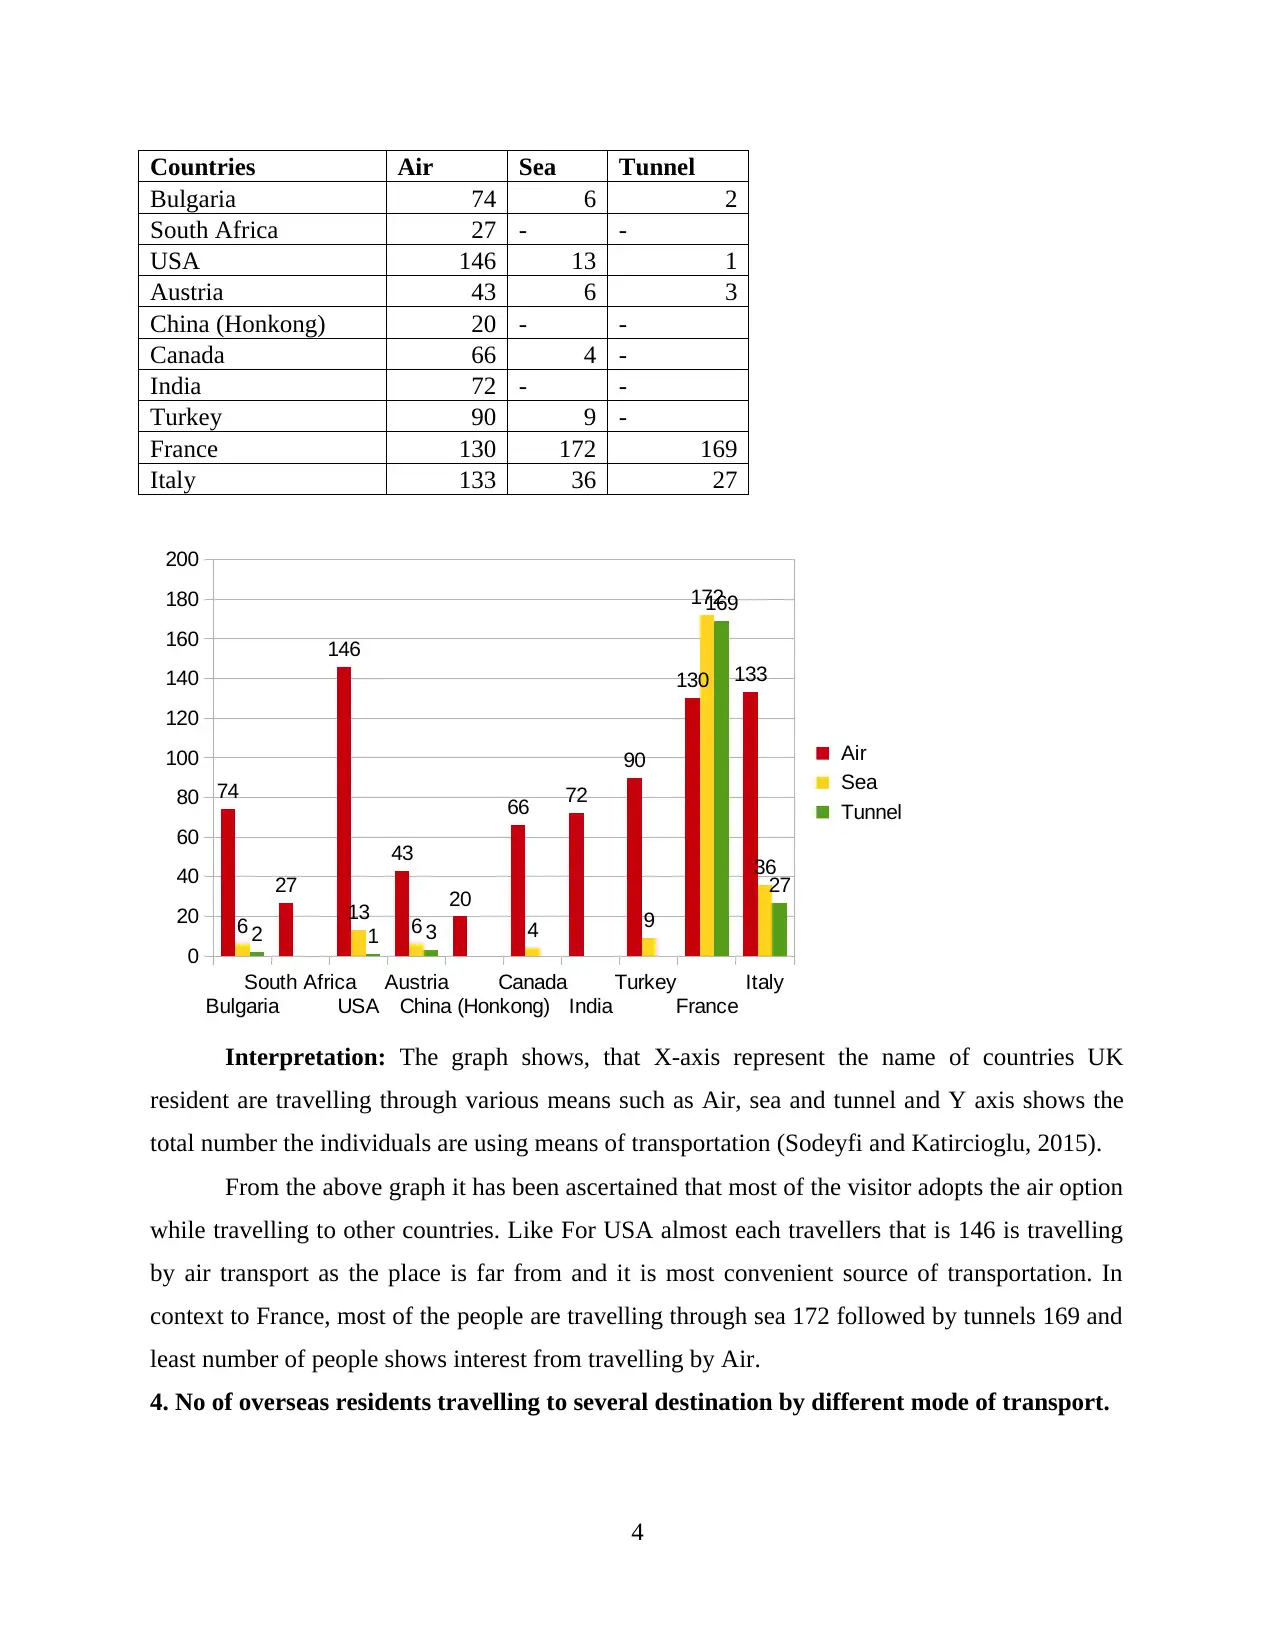
Countries Air Sea Tunnel
Bulgaria 74 6 2
South Africa 27 - -
USA 146 13 1
Austria 43 6 3
China (Honkong) 20 - -
Canada 66 4 -
India 72 - -
Turkey 90 9 -
France 130 172 169
Italy 133 36 27
Bulgaria
South Africa
USA
Austria
China (Honkong)
Canada
India
Turkey
France
Italy
0
20
40
60
80
100
120
140
160
180
200
74
27
146
43
20
66 72
90
130 133
6 13 6 4 9
172
36
2 1 3
169
27
Air
Sea
Tunnel
Interpretation: The graph shows, that X-axis represent the name of countries UK
resident are travelling through various means such as Air, sea and tunnel and Y axis shows the
total number the individuals are using means of transportation (Sodeyfi and Katircioglu, 2015).
From the above graph it has been ascertained that most of the visitor adopts the air option
while travelling to other countries. Like For USA almost each travellers that is 146 is travelling
by air transport as the place is far from and it is most convenient source of transportation. In
context to France, most of the people are travelling through sea 172 followed by tunnels 169 and
least number of people shows interest from travelling by Air.
4. No of overseas residents travelling to several destination by different mode of transport.
4
⊘ This is a preview!⊘
Do you want full access?
Subscribe today to unlock all pages.
Trusted by 1+ million students worldwide
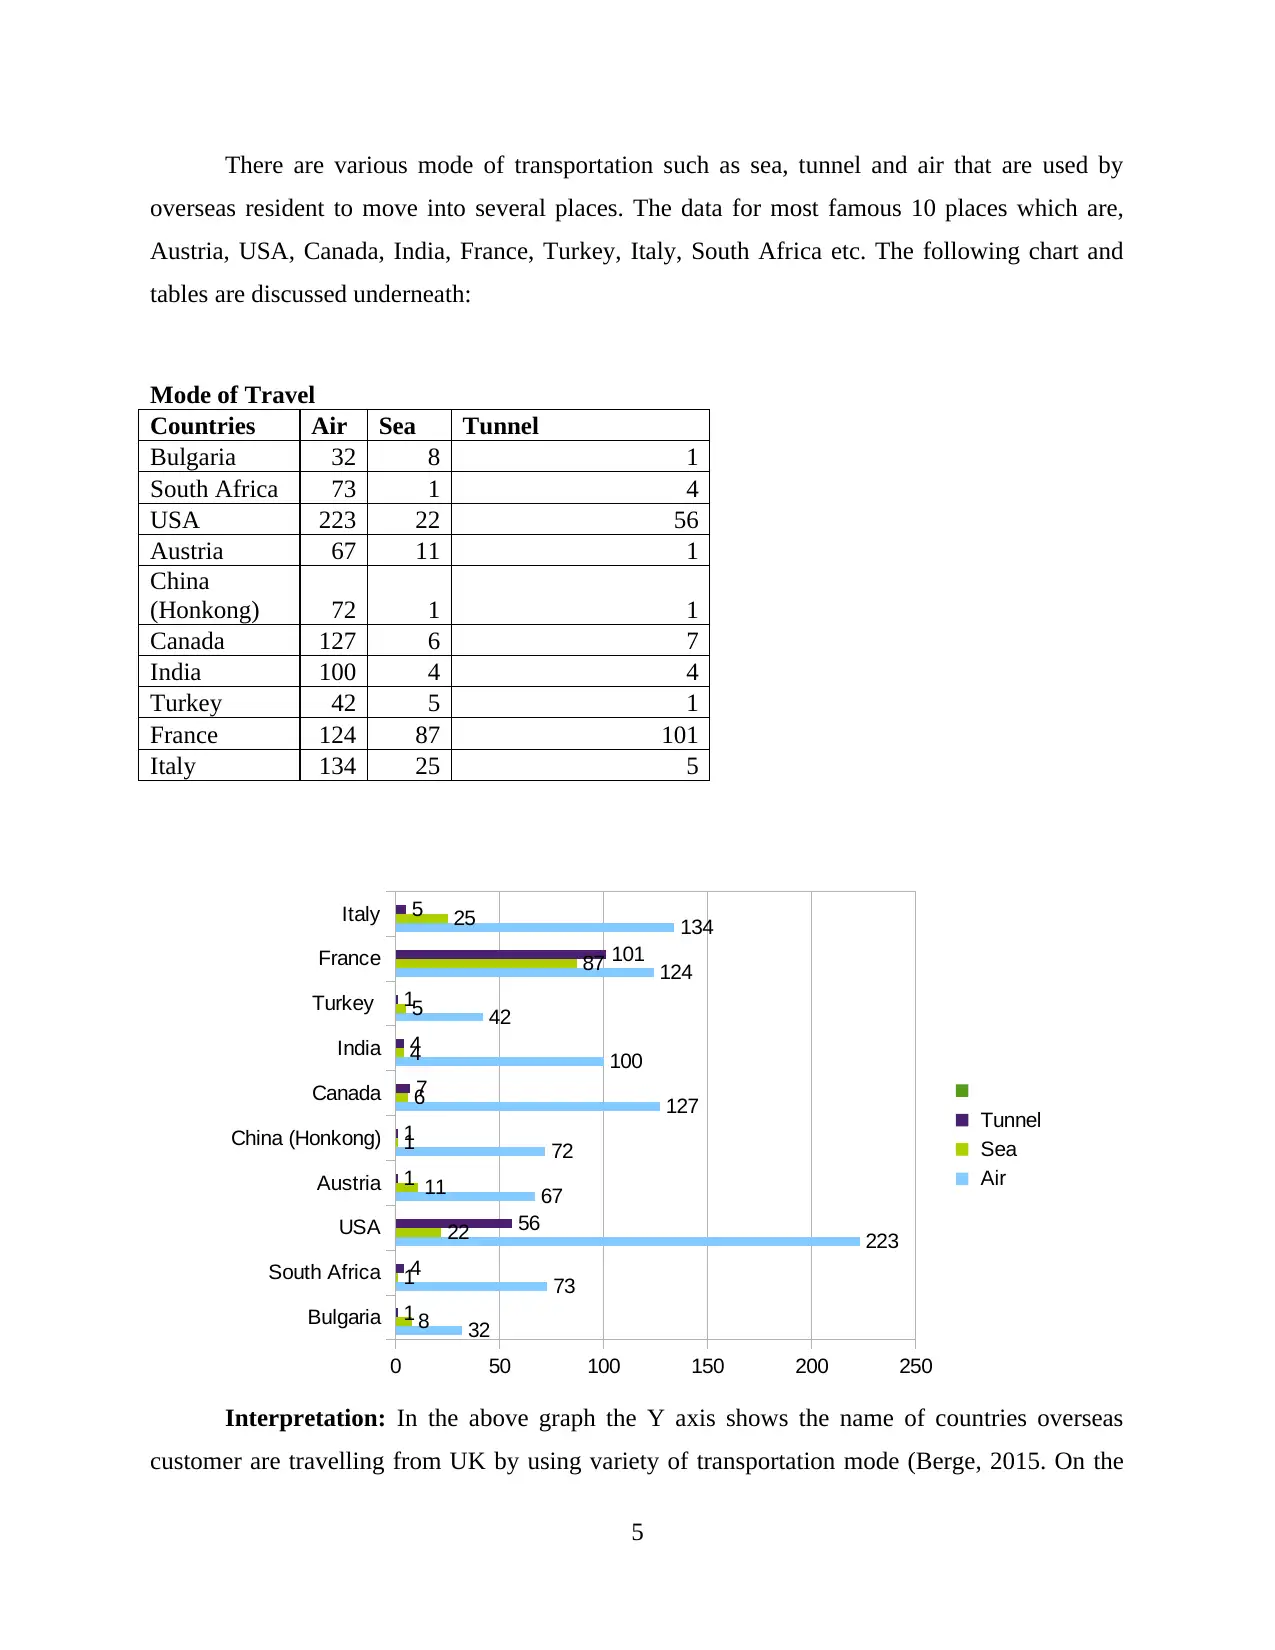
There are various mode of transportation such as sea, tunnel and air that are used by
overseas resident to move into several places. The data for most famous 10 places which are,
Austria, USA, Canada, India, France, Turkey, Italy, South Africa etc. The following chart and
tables are discussed underneath:
Mode of Travel
Countries Air Sea Tunnel
Bulgaria 32 8 1
South Africa 73 1 4
USA 223 22 56
Austria 67 11 1
China
(Honkong) 72 1 1
Canada 127 6 7
India 100 4 4
Turkey 42 5 1
France 124 87 101
Italy 134 25 5
Interpretation: In the above graph the Y axis shows the name of countries overseas
customer are travelling from UK by using variety of transportation mode (Berge, 2015. On the
5
Bulgaria
South Africa
USA
Austria
China (Honkong)
Canada
India
Turkey
France
Italy
0 50 100 150 200 250
32
73
223
67
72
127
100
42
124
134
8
1
22
11
1
6
4
5
87
25
1
4
56
1
1
7
4
1
101
5
Tunnel
Sea
Air
Paraphrase This Document
Need a fresh take? Get an instant paraphrase of this document with our AI Paraphraser
other side X axis shows the total number of visitors going out by using air, tunnel and sea
transportation.
It has been ascertained from the graph that larger number of overseas resident from UK
are travelling to USA by using Air that is 223. The graph shows that most of the people love to
travel by air and give least preference to sea routes. This is because it is one of the most time
consuming means of transport and people get board while travelling for long distances. In order
to increase the craze of sea transport UK government must make valuable services and give
additional benefit to travellers as they only focus on business purpose.
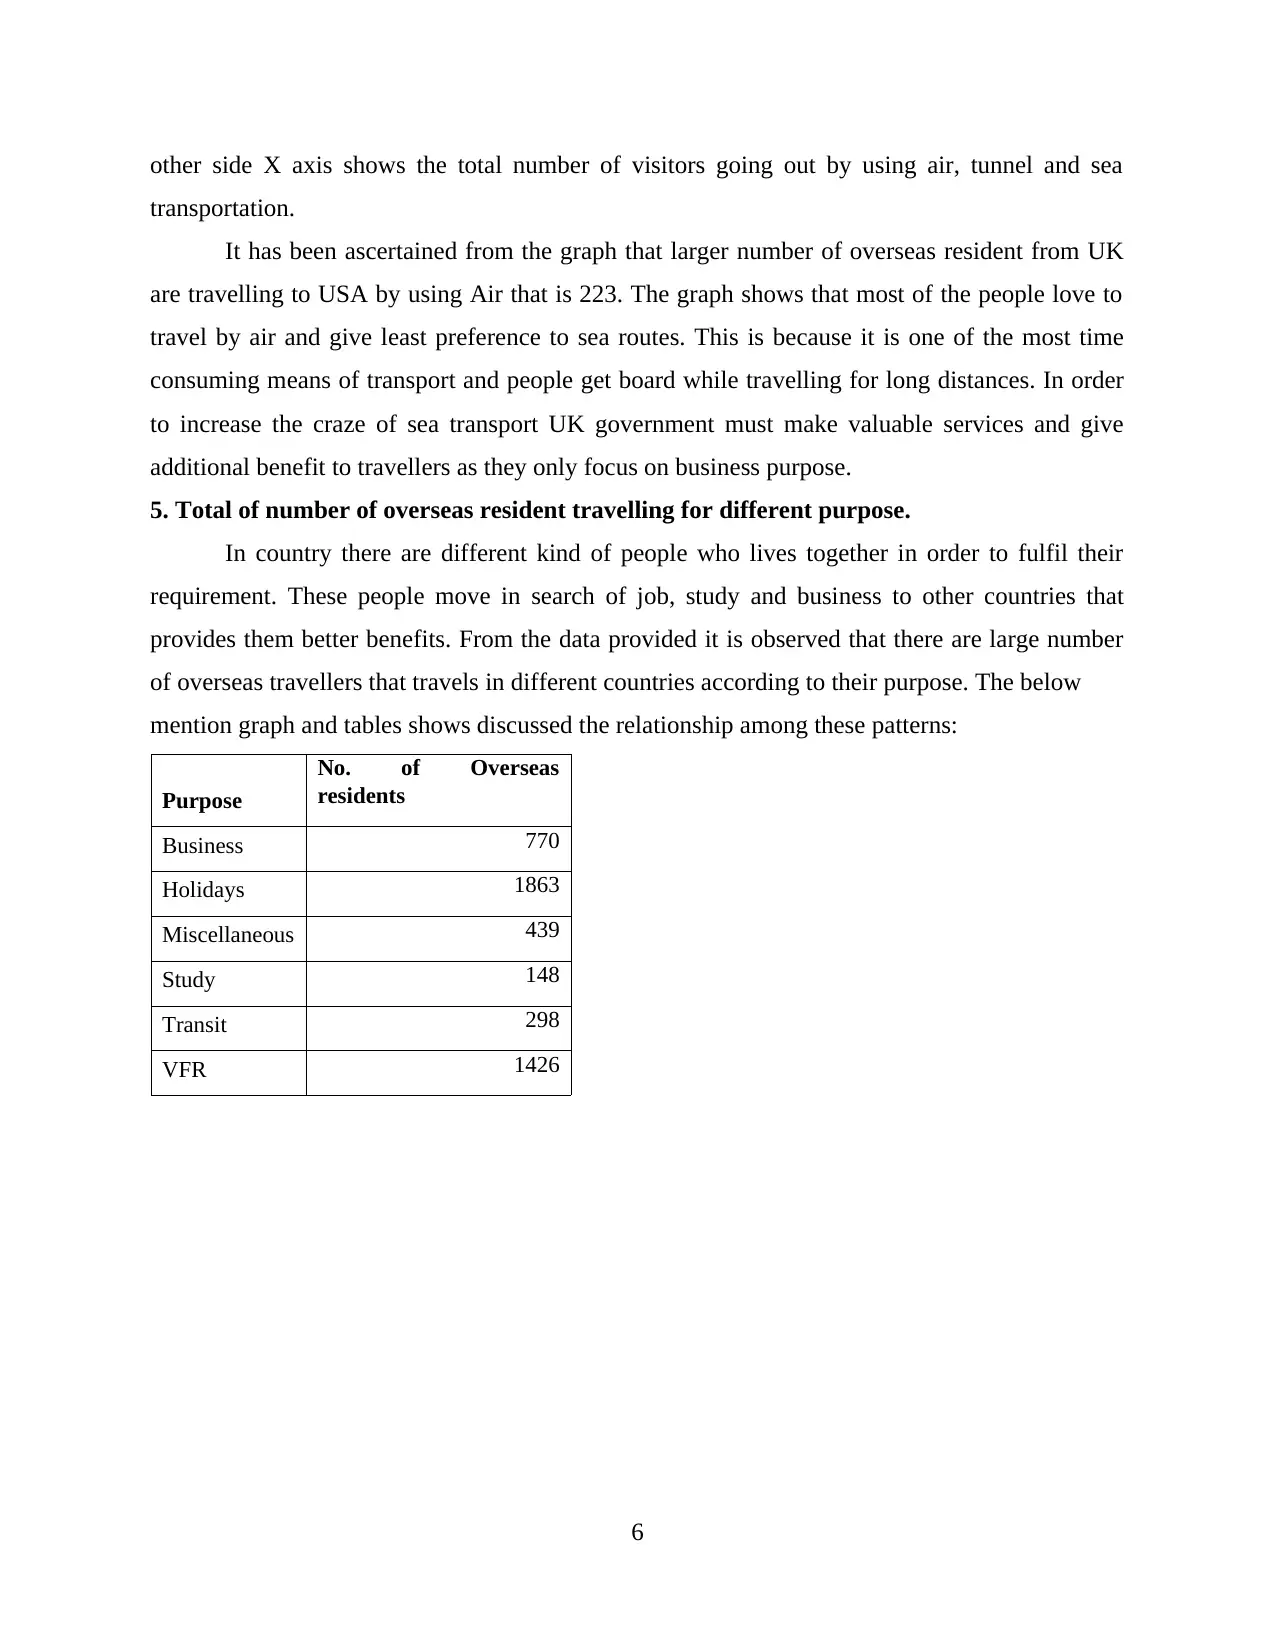
5. Total of number of overseas resident travelling for different purpose.
In country there are different kind of people who lives together in order to fulfil their
requirement. These people move in search of job, study and business to other countries that
provides them better benefits. From the data provided it is observed that there are large number
of overseas travellers that travels in different countries according to their purpose. The below
mention graph and tables shows discussed the relationship among these patterns:
Purpose
No. of Overseas
residents
Business 770
Holidays 1863
Miscellaneous 439
Study 148
Transit 298
VFR 1426
6
transportation.
It has been ascertained from the graph that larger number of overseas resident from UK
are travelling to USA by using Air that is 223. The graph shows that most of the people love to
travel by air and give least preference to sea routes. This is because it is one of the most time
consuming means of transport and people get board while travelling for long distances. In order
to increase the craze of sea transport UK government must make valuable services and give
additional benefit to travellers as they only focus on business purpose.
5. Total of number of overseas resident travelling for different purpose.
In country there are different kind of people who lives together in order to fulfil their
requirement. These people move in search of job, study and business to other countries that
provides them better benefits. From the data provided it is observed that there are large number
of overseas travellers that travels in different countries according to their purpose. The below
mention graph and tables shows discussed the relationship among these patterns:
Purpose
No. of Overseas
residents
Business 770
Holidays 1863
Miscellaneous 439
Study 148
Transit 298
VFR 1426
6
Business
Holidays
Miscellaneous
Study
Transit
VFR
0
200
400
600
800
1000
1200
1400
1600
1800
2000
770
1863
439
148
298
1426
No. of Overseas
residents
Interpretation: From the above table it has been stated that there were large number of
people those are moving to different countries for various purposes such as business 770,
Holidays 1863, study 148, VFR 1426 etc. With the help of graph it has been ascertained that
maximum number of overseas visitors are moving for Holiday purpose.
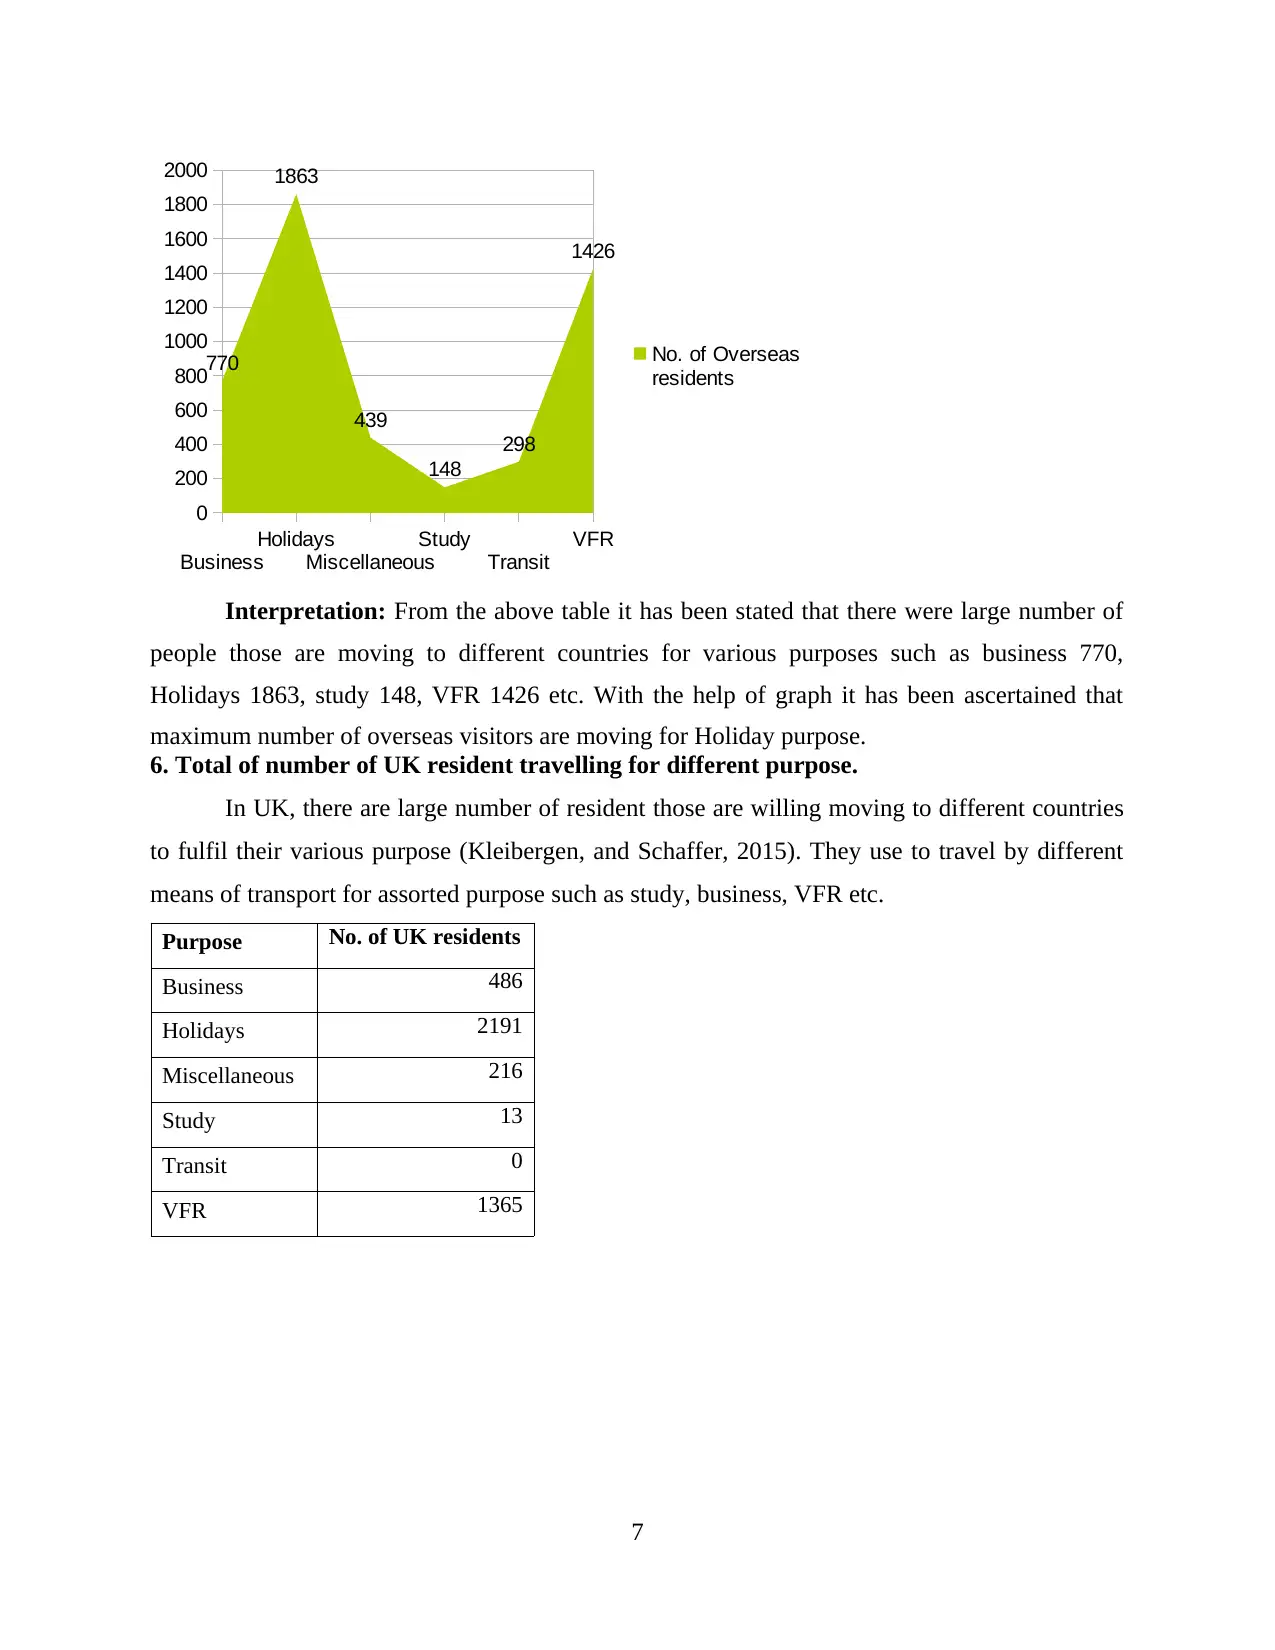
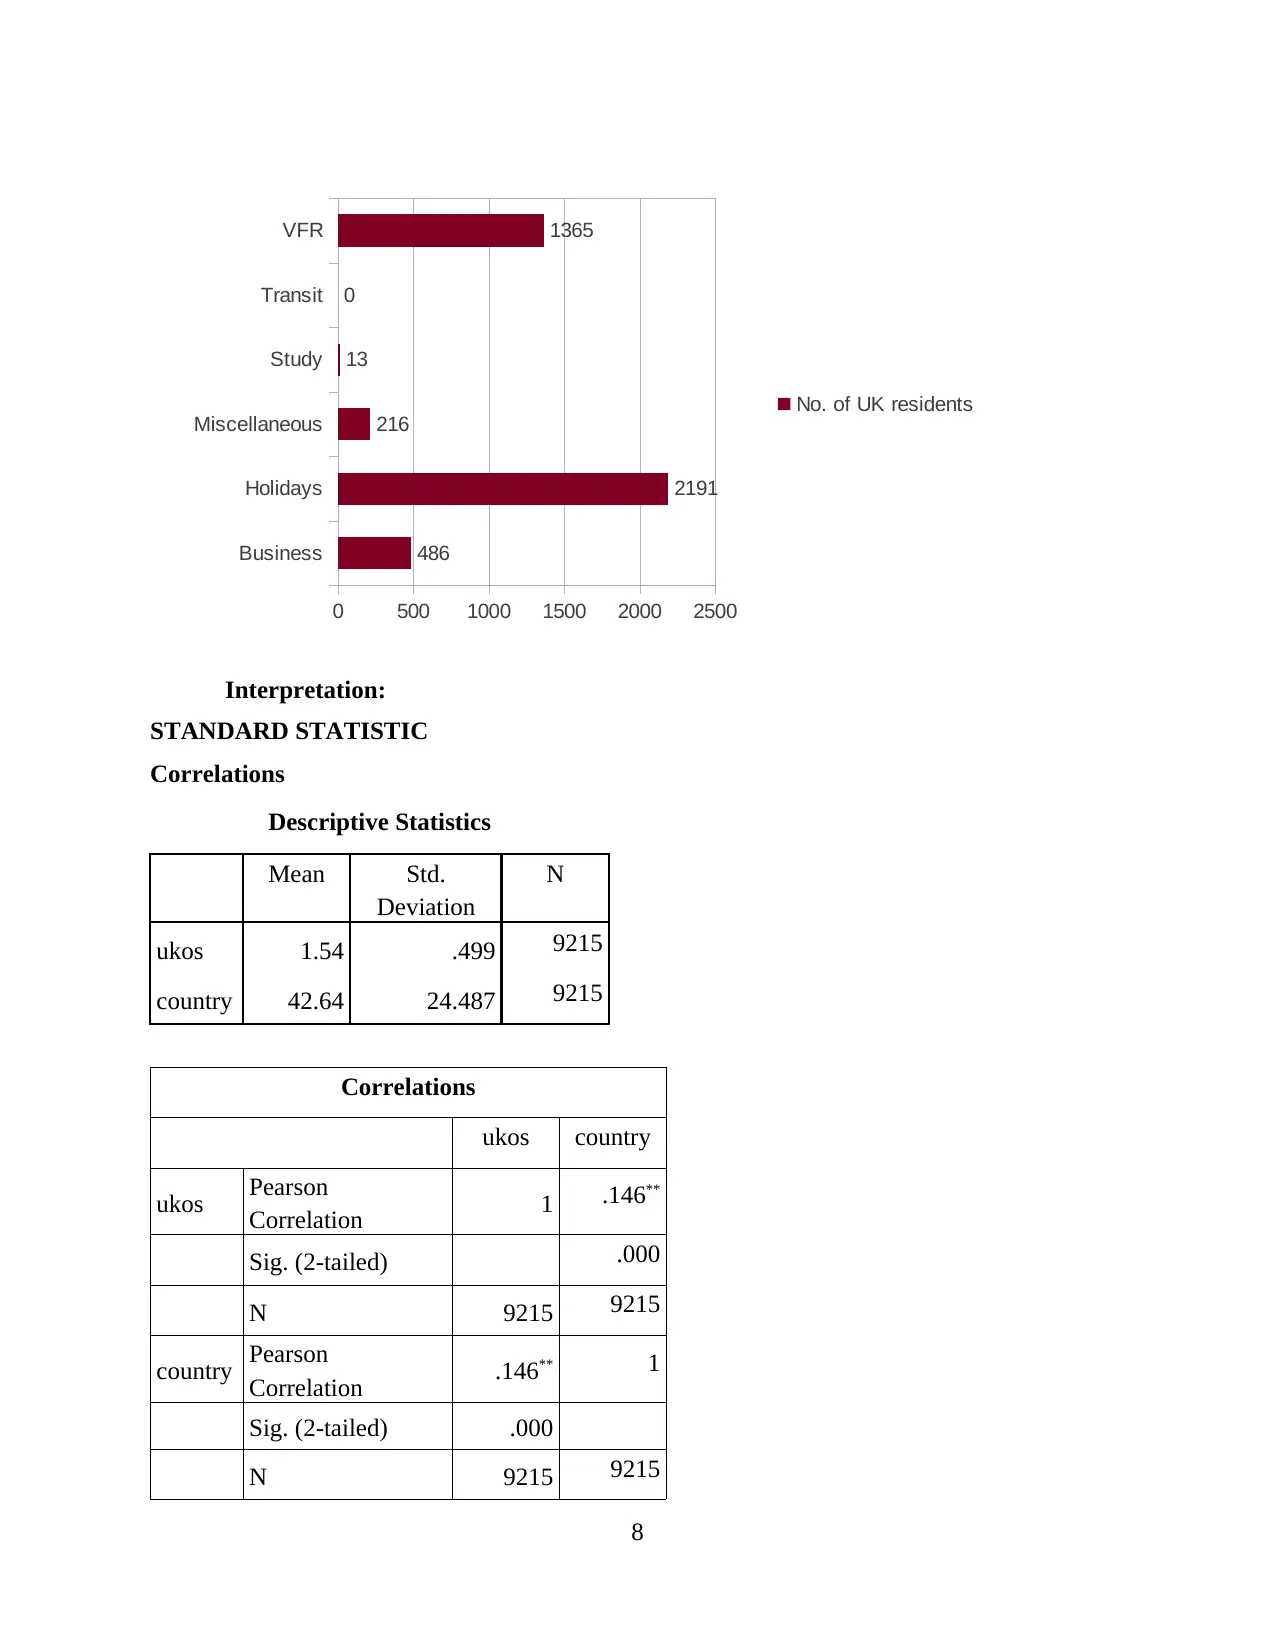
6. Total of number of UK resident travelling for different purpose.
In UK, there are large number of resident those are willing moving to different countries
to fulfil their various purpose (Kleibergen, and Schaffer, 2015). They use to travel by different
means of transport for assorted purpose such as study, business, VFR etc.
Purpose No. of UK residents
Business 486
Holidays 2191
Miscellaneous 216
Study 13
Transit 0
VFR 1365
7
Holidays
Miscellaneous
Study
Transit
VFR
0
200
400
600
800
1000
1200
1400
1600
1800
2000
770
1863
439
148
298
1426
No. of Overseas
residents
Interpretation: From the above table it has been stated that there were large number of
people those are moving to different countries for various purposes such as business 770,
Holidays 1863, study 148, VFR 1426 etc. With the help of graph it has been ascertained that
maximum number of overseas visitors are moving for Holiday purpose.
6. Total of number of UK resident travelling for different purpose.
In UK, there are large number of resident those are willing moving to different countries
to fulfil their various purpose (Kleibergen, and Schaffer, 2015). They use to travel by different
means of transport for assorted purpose such as study, business, VFR etc.
Purpose No. of UK residents
Business 486
Holidays 2191
Miscellaneous 216
Study 13
Transit 0
VFR 1365
7
⊘ This is a preview!⊘
Do you want full access?
Subscribe today to unlock all pages.
Trusted by 1+ million students worldwide
Business
Holidays
Miscellaneous
Study
Transit
VFR
0 500 1000 1500 2000 2500
486
2191
216
13
0
1365
No. of UK residents
Interpretation:
STANDARD STATISTIC
Correlations
Descriptive Statistics
Mean Std.
Deviation
N
ukos 1.54 .499 9215
country 42.64 24.487 9215
Correlations
ukos country
ukos Pearson
Correlation 1 .146**
Sig. (2-tailed) .000
N 9215 9215
country Pearson
Correlation .146** 1
Sig. (2-tailed) .000
N 9215 9215
8
Paraphrase This Document
Need a fresh take? Get an instant paraphrase of this document with our AI Paraphraser
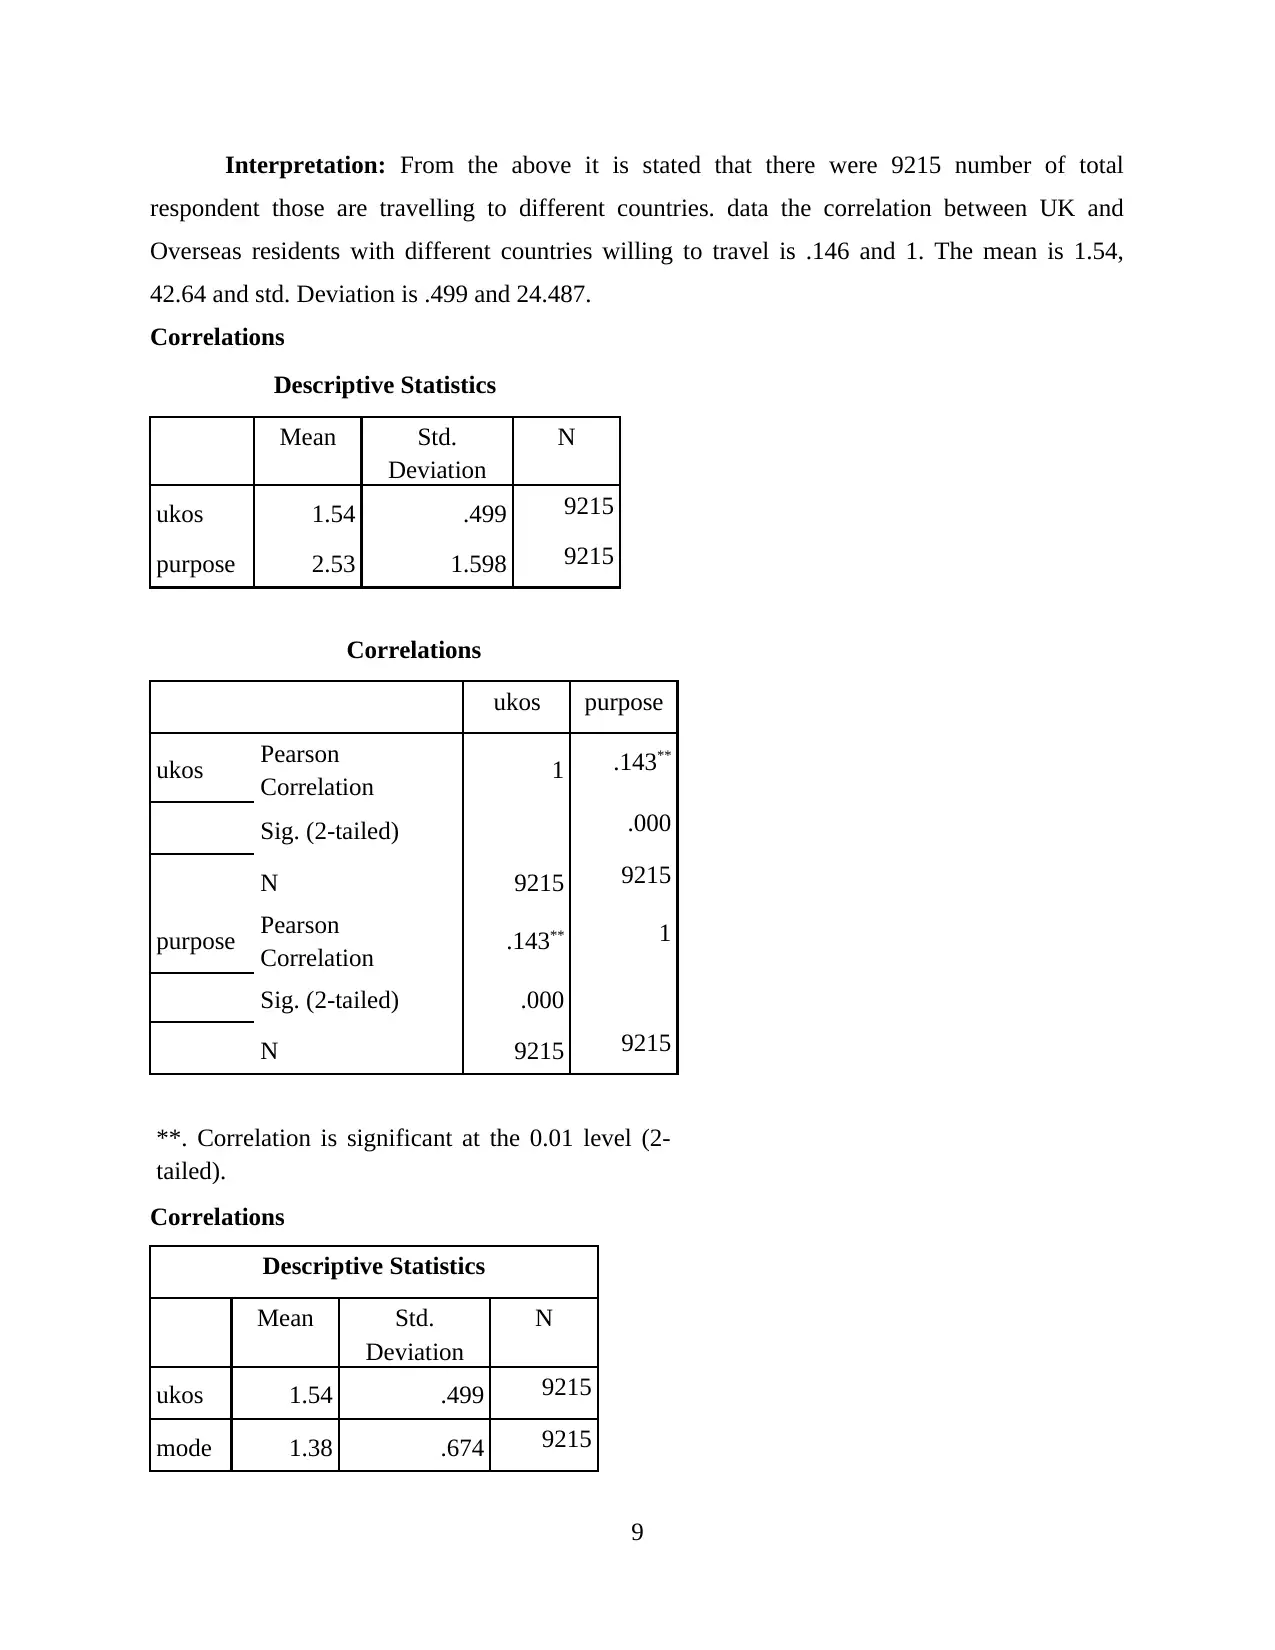
Interpretation: From the above it is stated that there were 9215 number of total
respondent those are travelling to different countries. data the correlation between UK and
Overseas residents with different countries willing to travel is .146 and 1. The mean is 1.54,
42.64 and std. Deviation is .499 and 24.487.
Correlations
Descriptive Statistics
Mean Std.
Deviation
N
ukos 1.54 .499 9215
purpose 2.53 1.598 9215
Correlations
ukos purpose
ukos Pearson
Correlation 1 .143**
Sig. (2-tailed) .000
N 9215 9215
purpose Pearson
Correlation .143** 1
Sig. (2-tailed) .000
N 9215 9215
**. Correlation is significant at the 0.01 level (2-
tailed).
Correlations
Descriptive Statistics
Mean Std.
Deviation
N
ukos 1.54 .499 9215
mode 1.38 .674 9215
9
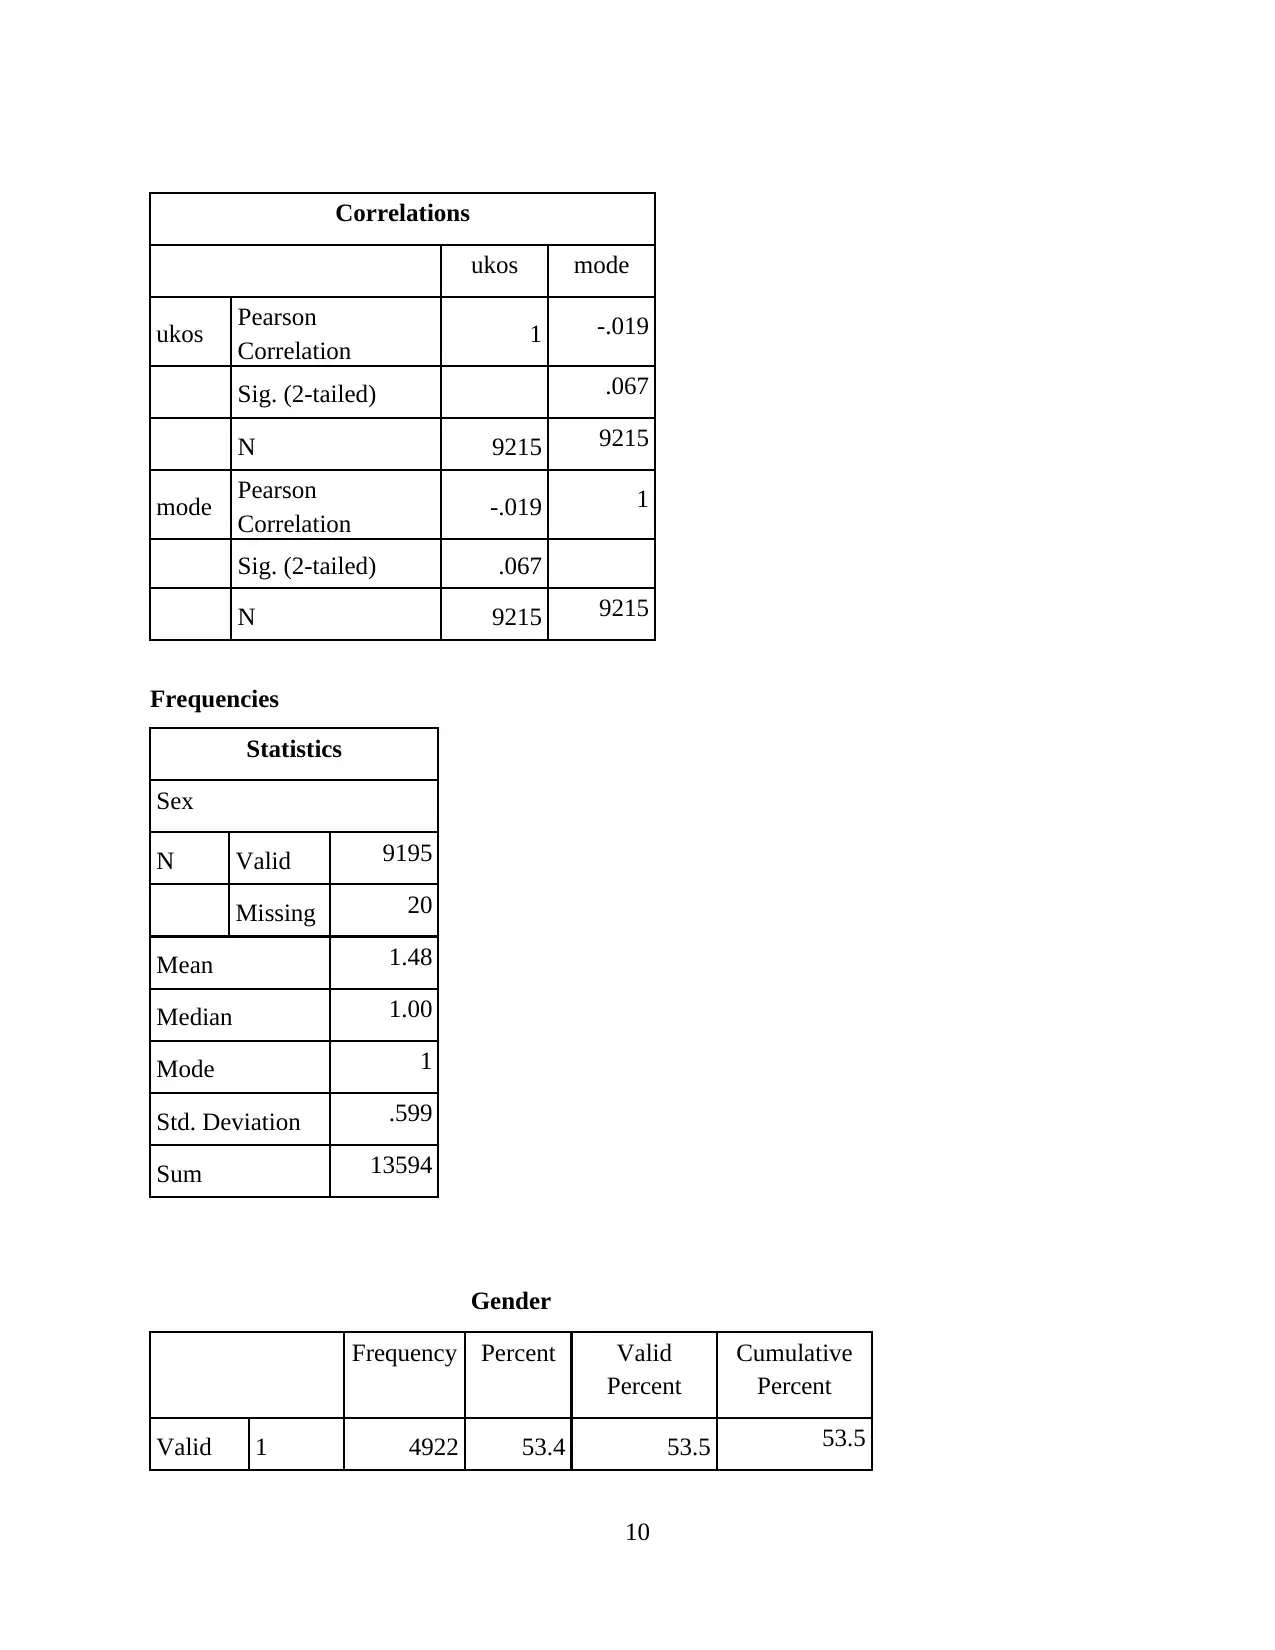
Correlations
ukos mode
ukos Pearson
Correlation 1 -.019
Sig. (2-tailed) .067
N 9215 9215
mode Pearson
Correlation -.019 1
Sig. (2-tailed) .067
N 9215 9215
Frequencies
Statistics
Sex
N Valid 9195
Missing 20
Mean 1.48
Median 1.00
Mode 1
Std. Deviation .599
Sum 13594
Gender
Frequency Percent Valid
Percent
Cumulative
Percent
Valid 1 4922 53.4 53.5 53.5
10
⊘ This is a preview!⊘
Do you want full access?
Subscribe today to unlock all pages.
Trusted by 1+ million students worldwide
1 out of 19

Your All-in-One AI-Powered Toolkit for Academic Success.
+13062052269
info@desklib.com
Available 24*7 on WhatsApp / Email
![[object Object]](/_next/static/media/star-bottom.7253800d.svg)
Unlock your academic potential
Copyright © 2020–2026 A2Z Services. All Rights Reserved. Developed and managed by ZUCOL.