Business Statistics: Analyzing TravelPac Data for Business Practices
VerifiedAdded on 2020/12/18
|13
|3059
|293
Report
AI Summary
This report presents an analysis of TravelPac data, focusing on traveler preferences and behaviors. It examines the modes of transport used by UK residents, including air, sea, and tunnel, and identifies the most popular destinations. The analysis includes a breakdown of travelers using independent and non-independent packages, categorized by travel purpose (business, holiday, transit, study, miscellaneous, and VFR). The report calculates mean and standard deviation for both package types, providing statistical insights into traveler choices. Furthermore, the study utilizes SPSS to evaluate numeric variables such as the total number of UK and overseas residents and the mode of transport. Correlation and regression analyses are also conducted to identify relationships between variables. The findings reveal key trends, such as the preference for air travel and the popularity of France and Spain as destinations. The report concludes with recommendations for TravelPac, based on the data-driven insights.

USING DATA TO
BUILD BUSINESS
PRACTICE
BUILD BUSINESS
PRACTICE
Paraphrase This Document
Need a fresh take? Get an instant paraphrase of this document with our AI Paraphraser
Table of Contents
INTRODUCTION...........................................................................................................................1
ANALYSING DATA......................................................................................................................1
1. Determining Number of Travellers based on Mode of Transport preferred......................1
2. Evaluating number of travellers availing Independent Package for various purposes in Q3
2017........................................................................................................................................3
3. Analysing number of travellers availing Non-Independent Package for different purposes in
Q3 2017..................................................................................................................................4
4. Calculating the Mean and Standard Deviation for both packages.....................................5
5. Evaluating Numeric variables using SPSS.........................................................................6
6. Correlation and regression analysis....................................................................................7
CONCLUSION..............................................................................................................................10
REFERENCES..............................................................................................................................11
INTRODUCTION
Business Statistics are used as a tool in business decision making process. It is a science
of decision making while facing uncertainty and is used in many areas of business which
includes financial analysis, auditing, econometrics, operations and production (Bell, Bryman and
Harley, 2018). It is used as a decision making tool and taking sound decisions for the company in
order to improve the efficiency of the business operations. These data plan an important role in
the decision making process as it analyses the data and find the ways in which it can improve the
efficiency of its employees and business operations. The following report contains the analyses
the data in the TravelPac in order to find out the mode of transport used by various travellers. It
also shows the recommendations about the potential target segment.
ANALYSING DATA
1. Determining Number of Travellers based on Mode of Transport preferred
Australia
Belgium
Channel Islands
Croatia
Czech Republic
Estonia
Germany
Hungary
Irish Republic
Jamaica
Lithuania
Mexico
Norway
Other Caribbean
Other Europe
Pakistan
Romania
Slovenia
Sri Lanka
Thailand
United Arab Emirates
0 50 100 150 200 250 300 350 400 450 500
Modes of Travel used by UK Residents for various destinations (Q3 2017)
Tunnel
Sea
Air
Number of Travellers
Countries
Interpretation:
1
⊘ This is a preview!⊘
Do you want full access?
Subscribe today to unlock all pages.
Trusted by 1+ million students worldwide
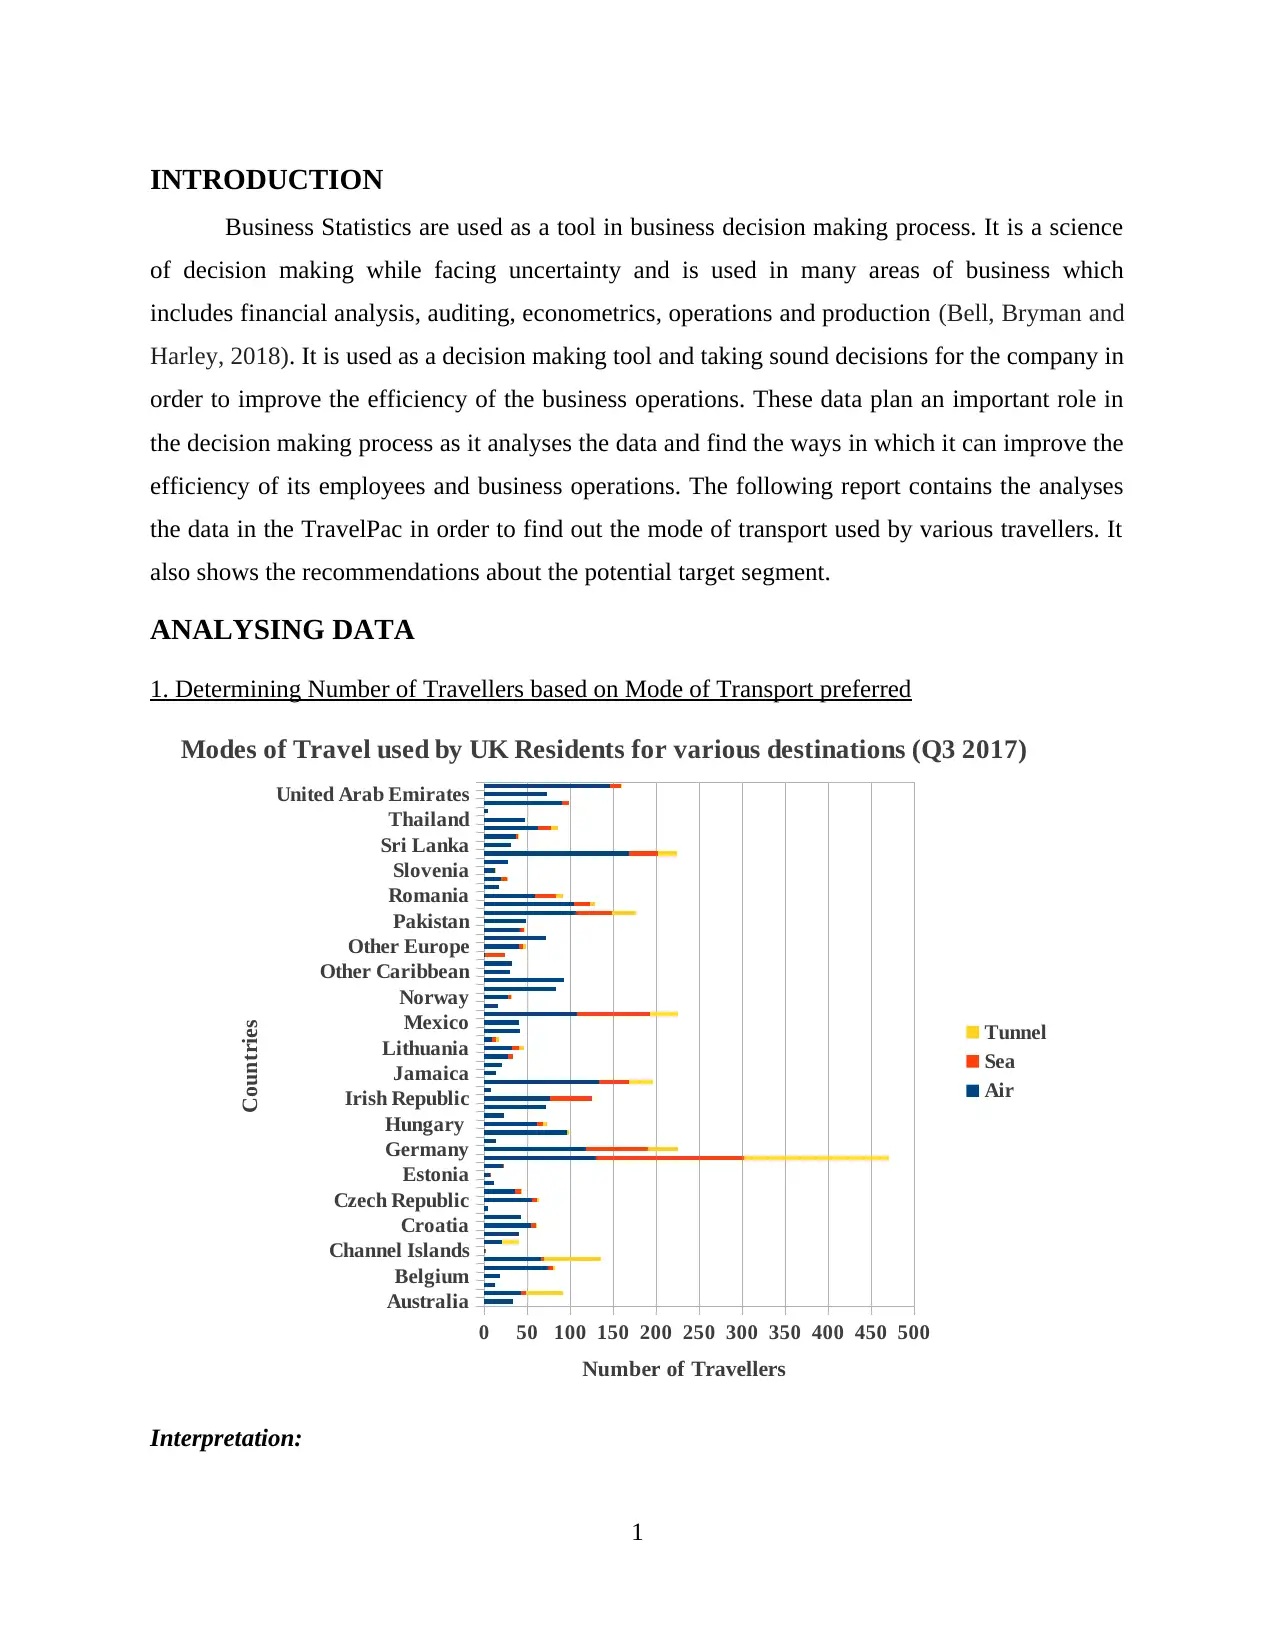
The above graph represent the number of Travellers travelling through various means of
transport visiting various location. On the X axis it shows the number of travellers travelling to
different locations whereas on the Y axis it shows the countries to which the residents of United
Kingdom Travelling.
From the above graph shows the number of United Kingdom resident travelling to various
location using different modes which includes air, sea and tunnel. From the above given data it
can be interpreted that the total number of UK travellers are 4175 from which the maximum
travellers are using the air mode to visit various location, total number of travellers travelling
through air mode are stated at 3002 in which the maximum number of travellers going to the
Spain are stated as 169 where as the total number of travellers travelling through Sea mode are
stated as 675 from which 172 travellers travelled to France making it the maximum number
using sea mode to travel where as in the case of tunnel the total number of travellers using the
mode of tunnel are 498 and 169 travellers uses this mode to travel to France. Maximum number
of Sea and Tunnel mode are used by UK travellers to travel to France whereas the Air mode is
used maximum to travel to Spain (Berenson and et.al., 2012).
The above graph also shows that to travel to Thailand residents of United Kingdom uses
only Air mode where as to travel to Channel Islands only air mode is used by travellers. The
graph also shows that the maximum used mode by travellers to traveller to travel to various
destinations are the Air mode, and the second maximum used mode to travel is the Tunnel Mode.
The frequency of travellers travelling to France is the highest which shows that the people of
United Kingdom maximum travel to France. As per the above given graph the place least visited
by traveller is Channel Islands. From the above graph trend is analysed that the place after
France which is most visited by the UK residents is Spain and Netherlands, total number of
travellers going to Spain and Netherlands is 225 each. The graph shows that after Spain the
maximum number of travel using Air mode is to travel to United States of America stated at 146.
The above graph shows that residents of United Kingdom who are travelling to United Arab
Emirates are using only one mode i.e., Air mode no other mode are used to travel to UAE and
also to travel to Middle East only Air mode is used.
Thus, it can be inferred that the most preferred mode of transport among the UK Resident
travellers is by Air flying to and from among various destinations in the recent quarter.
2
Paraphrase This Document
Need a fresh take? Get an instant paraphrase of this document with our AI Paraphraser
2. Evaluating number of travellers availing Independent Package for various purposes in Q3
2017
Australia
Canada
Cyprus EU
Estonia
Greece
Israel
Lithuania
New Zealand
Other Central & South America
Pakistan
Slovakia
Sweden
United Arab Emirates
0 50 100 150 200 250
UK Residents travelling with Business purpose on Independent Package
VFR
Miscellaneous
Study
Transit
Holiday
Business
Number of Travellers
Countries
Interpretation:
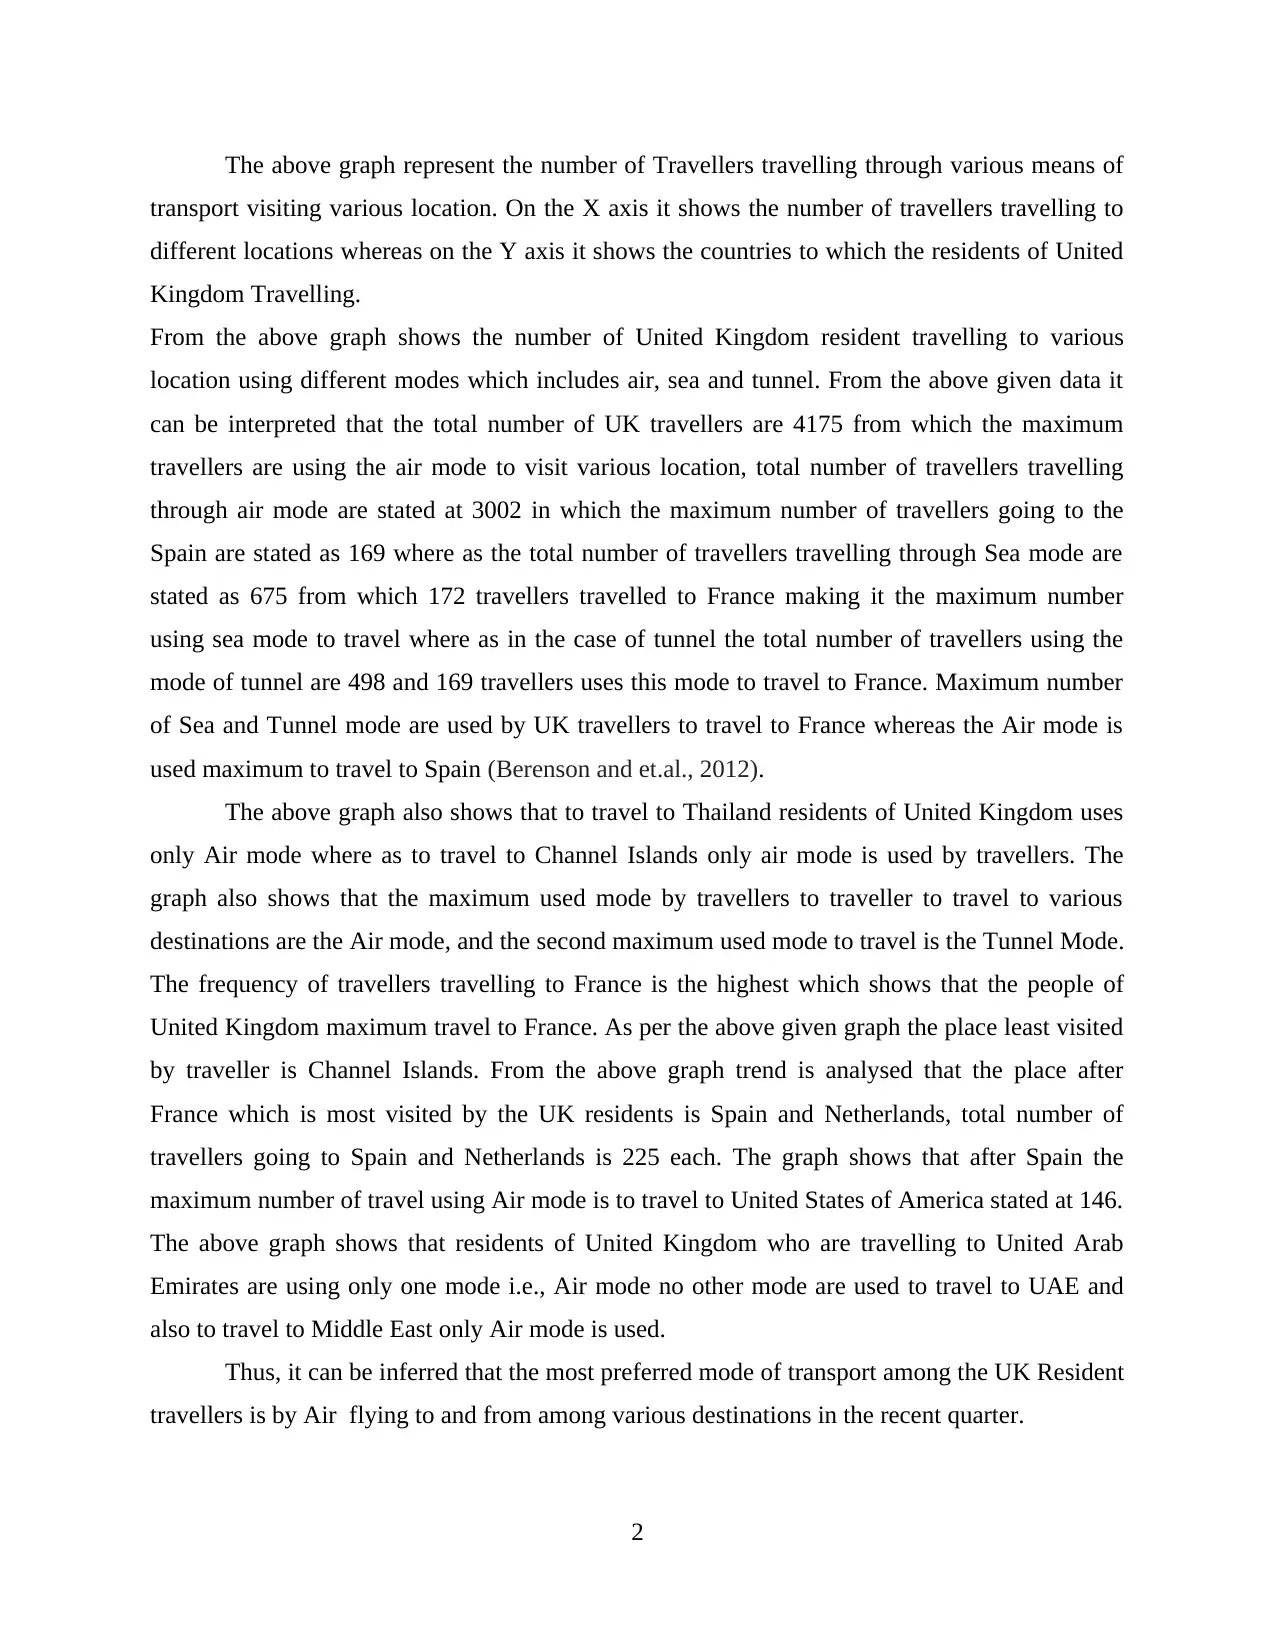
The above illustration includes a list of countries plotted on the X-axis whereas the Y-
Axis contains the number of travellers making a round trip to these places. For ascertaining the
most beneficial overseas touring plan for British Customers, various destinations have been
taken into consideration and an attempt has been made in order to find out for what purpose does
UK Residents have availed this option in the recent quarter of 2017.
In order to calculate the amount of passengers belonging to UK using an independent
package for travelling to various countries, the above graph has been formulated. Based on this
outcome, one can easily observe that UK Residents travelling to France have availed the
Independent Package in Quarter 3 of 2017 for ensuring their travelling needs are met in full. In
addition to this, the package has been availed maximum number of times by the travellers for
Holiday purposes. It is interesting to note that no UK Resident has availed the Independent
Package Option for Transit Purpose. The total number of travellers for Business, Holiday,
Transit, Study, Miscellaneous and VFR purposes were 472, 1325, none, 10, 117 and 1078
respectively (Corti, 2016). Again, it is worth observing that France does not have any UK
resident passenger going for any purpose other than Business or Holiday with 56 and 177
3
2017
Australia
Canada
Cyprus EU
Estonia
Greece
Israel
Lithuania
New Zealand
Other Central & South America
Pakistan
Slovakia
Sweden
United Arab Emirates
0 50 100 150 200 250
UK Residents travelling with Business purpose on Independent Package
VFR
Miscellaneous
Study
Transit
Holiday
Business
Number of Travellers
Countries
Interpretation:
The above illustration includes a list of countries plotted on the X-axis whereas the Y-
Axis contains the number of travellers making a round trip to these places. For ascertaining the
most beneficial overseas touring plan for British Customers, various destinations have been
taken into consideration and an attempt has been made in order to find out for what purpose does
UK Residents have availed this option in the recent quarter of 2017.
In order to calculate the amount of passengers belonging to UK using an independent
package for travelling to various countries, the above graph has been formulated. Based on this
outcome, one can easily observe that UK Residents travelling to France have availed the
Independent Package in Quarter 3 of 2017 for ensuring their travelling needs are met in full. In
addition to this, the package has been availed maximum number of times by the travellers for
Holiday purposes. It is interesting to note that no UK Resident has availed the Independent
Package Option for Transit Purpose. The total number of travellers for Business, Holiday,
Transit, Study, Miscellaneous and VFR purposes were 472, 1325, none, 10, 117 and 1078
respectively (Corti, 2016). Again, it is worth observing that France does not have any UK
resident passenger going for any purpose other than Business or Holiday with 56 and 177
3
residents travelling to France for respective purposes. In relation to Miscellaneous or other
purposes that have not been listed above, Netherlands has been the favourite destination for UK
On-goers for making round trips with 10 people being its maximum strength in the entire quarter
for 2017.
The Maximum Travellers for Business Purpose under the Independent Package are 56
that have flown to France in Q3 2017. On the other hand, 177 residents flew to the same country
for vacation, USA has been the favourite destination for studying among UK Residents with
maximum of 2 residents have flown for this purpose to that country. Again, for VFR, Poland has
been the most preferred destination among the passengers based out of United Kingdom with 84
people flying to the place out of 1078 travellers in total. VFR or Visual Flying Rules are the one
which are followed by the pilot used for determining weather conditions in order to travel from
one point to another internationally (VFR Regulations, 2014).
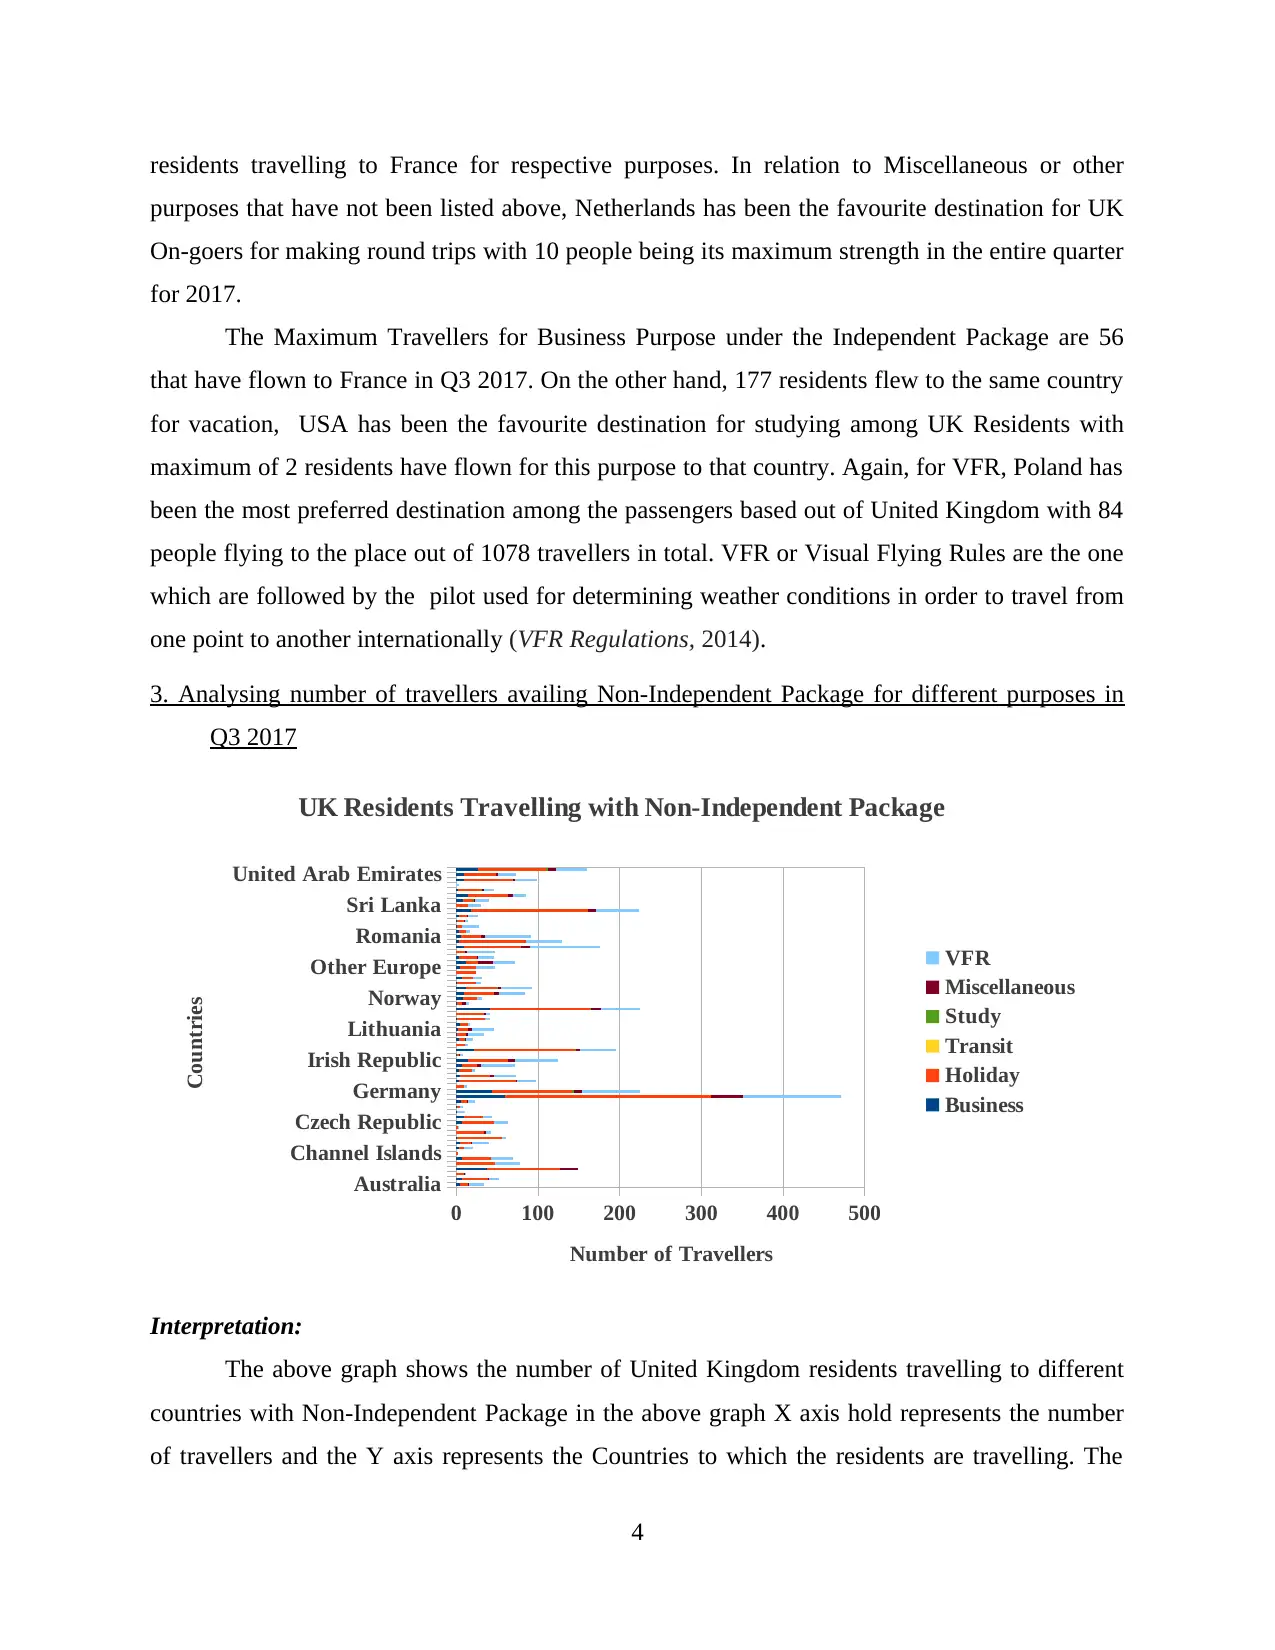
3. Analysing number of travellers availing Non-Independent Package for different purposes in
Q3 2017
Australia
Channel Islands
Czech Republic
Germany
Irish Republic
Lithuania
Norway
Other Europe
Romania
Sri Lanka
United Arab Emirates
0 100 200 300 400 500
UK Residents Travelling with Non-Independent Package
VFR
Miscellaneous
Study
Transit
Holiday
Business
Number of Travellers
Countries
Interpretation:
The above graph shows the number of United Kingdom residents travelling to different
countries with Non-Independent Package in the above graph X axis hold represents the number
of travellers and the Y axis represents the Countries to which the residents are travelling. The
4
purposes that have not been listed above, Netherlands has been the favourite destination for UK
On-goers for making round trips with 10 people being its maximum strength in the entire quarter
for 2017.
The Maximum Travellers for Business Purpose under the Independent Package are 56
that have flown to France in Q3 2017. On the other hand, 177 residents flew to the same country
for vacation, USA has been the favourite destination for studying among UK Residents with
maximum of 2 residents have flown for this purpose to that country. Again, for VFR, Poland has
been the most preferred destination among the passengers based out of United Kingdom with 84
people flying to the place out of 1078 travellers in total. VFR or Visual Flying Rules are the one
which are followed by the pilot used for determining weather conditions in order to travel from
one point to another internationally (VFR Regulations, 2014).
3. Analysing number of travellers availing Non-Independent Package for different purposes in
Q3 2017
Australia
Channel Islands
Czech Republic
Germany
Irish Republic
Lithuania
Norway
Other Europe
Romania
Sri Lanka
United Arab Emirates
0 100 200 300 400 500
UK Residents Travelling with Non-Independent Package
VFR
Miscellaneous
Study
Transit
Holiday
Business
Number of Travellers
Countries
Interpretation:
The above graph shows the number of United Kingdom residents travelling to different
countries with Non-Independent Package in the above graph X axis hold represents the number
of travellers and the Y axis represents the Countries to which the residents are travelling. The
4
⊘ This is a preview!⊘
Do you want full access?
Subscribe today to unlock all pages.
Trusted by 1+ million students worldwide
above graph shows the purpose to which these travellers travel to these countries (Croll and
Yoskovitz, 2013).
From the above graph it can be illustrated that the travellers travelling with non
independent package are maximum for France and the purpose to visit France was maximum
holiday which is stated as 252 and VFR purpose is stated at 120 and the minimum number of
traveller going with non independent package is Channel Island for the purpose of enjoying
holiday. The graph also represents the purpose for which the travellers are travelling to other
countries shows that the maximum number of traveller go for the purpose of enjoying holidays to
these countries in which Spain is the second most preferred country after France for the purpose
of enjoying holidays. The above graphs also states the second most common purpose for visiting
these different countries is for the purpose of Virtual Flying rules.
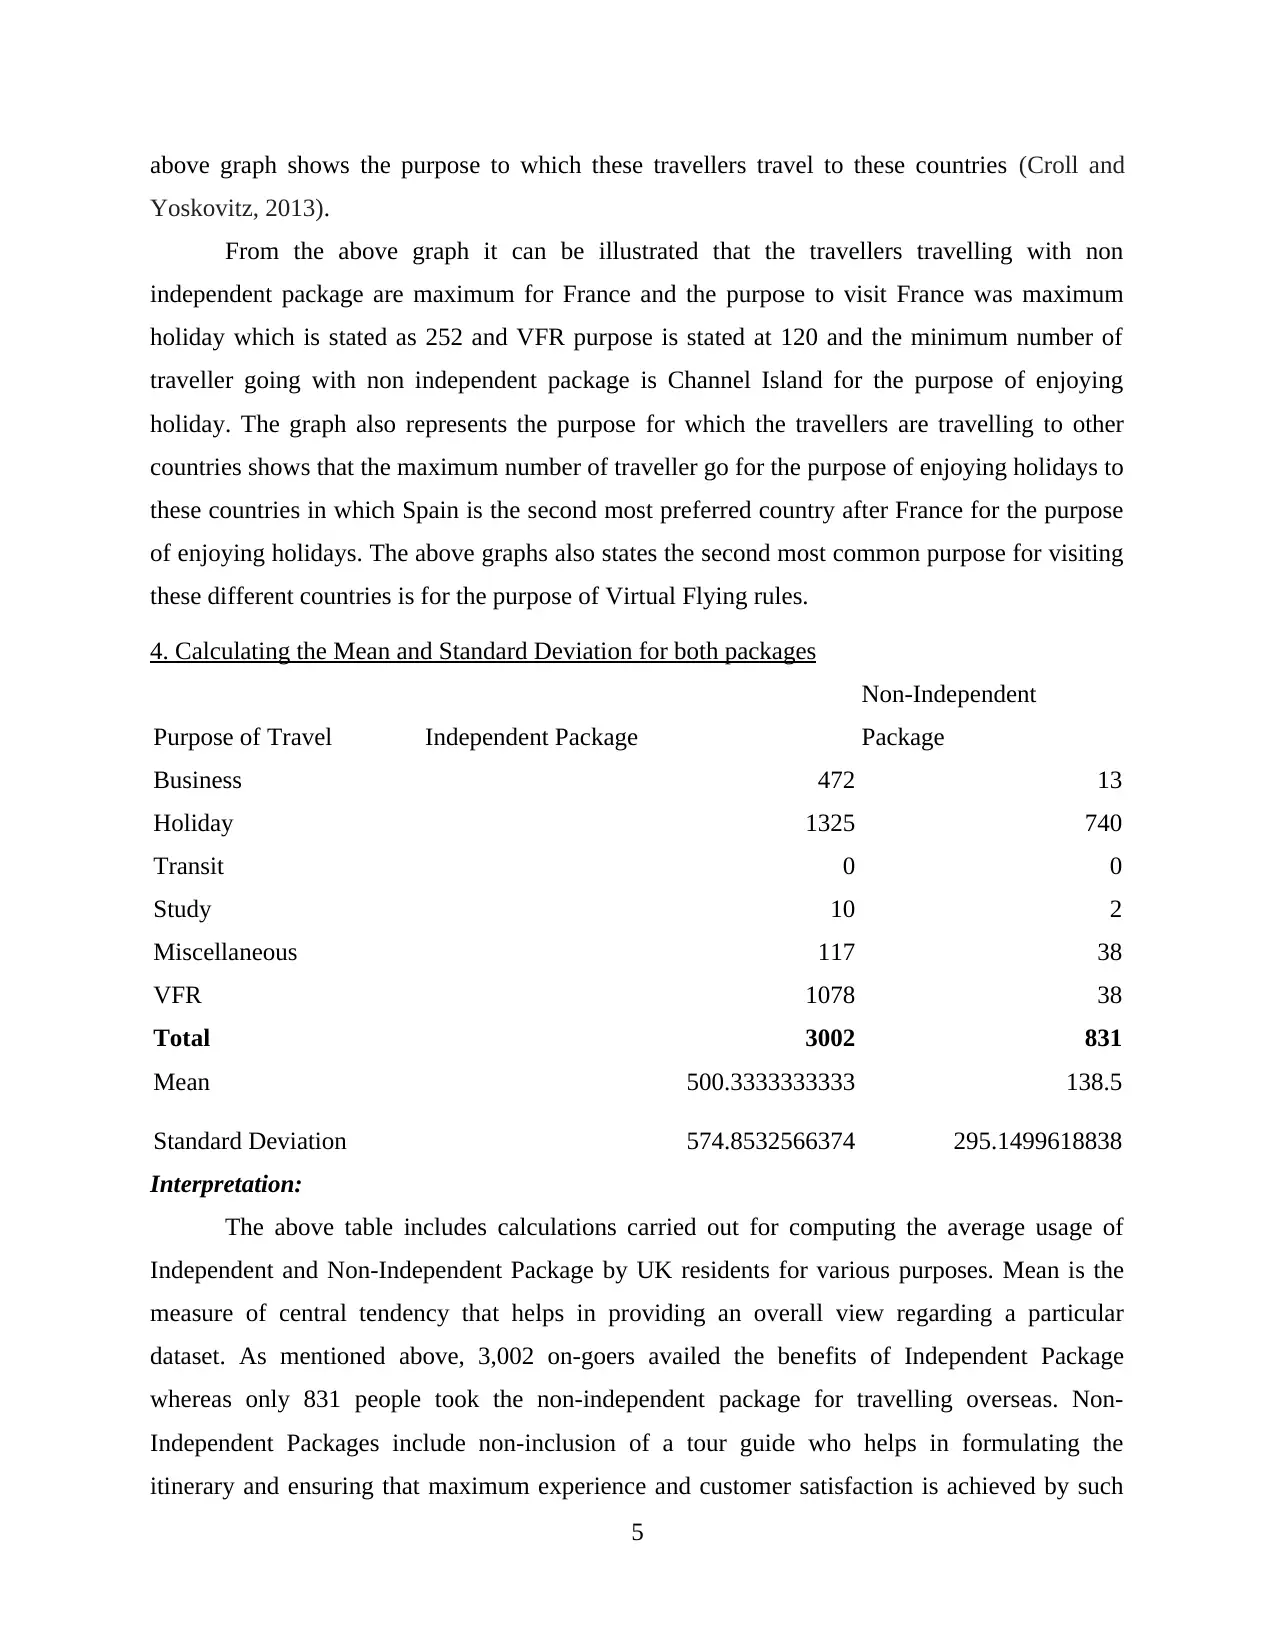
4. Calculating the Mean and Standard Deviation for both packages
Purpose of Travel Independent Package
Non-Independent
Package
Business 472 13
Holiday 1325 740
Transit 0 0
Study 10 2
Miscellaneous 117 38
VFR 1078 38
Total 3002 831
Mean 500.3333333333 138.5
Standard Deviation 574.8532566374 295.1499618838
Interpretation:
The above table includes calculations carried out for computing the average usage of
Independent and Non-Independent Package by UK residents for various purposes. Mean is the
measure of central tendency that helps in providing an overall view regarding a particular
dataset. As mentioned above, 3,002 on-goers availed the benefits of Independent Package
whereas only 831 people took the non-independent package for travelling overseas. Non-
Independent Packages include non-inclusion of a tour guide who helps in formulating the
itinerary and ensuring that maximum experience and customer satisfaction is achieved by such
5
Yoskovitz, 2013).
From the above graph it can be illustrated that the travellers travelling with non
independent package are maximum for France and the purpose to visit France was maximum
holiday which is stated as 252 and VFR purpose is stated at 120 and the minimum number of
traveller going with non independent package is Channel Island for the purpose of enjoying
holiday. The graph also represents the purpose for which the travellers are travelling to other
countries shows that the maximum number of traveller go for the purpose of enjoying holidays to
these countries in which Spain is the second most preferred country after France for the purpose
of enjoying holidays. The above graphs also states the second most common purpose for visiting
these different countries is for the purpose of Virtual Flying rules.
4. Calculating the Mean and Standard Deviation for both packages
Purpose of Travel Independent Package
Non-Independent
Package
Business 472 13
Holiday 1325 740
Transit 0 0
Study 10 2
Miscellaneous 117 38
VFR 1078 38
Total 3002 831
Mean 500.3333333333 138.5
Standard Deviation 574.8532566374 295.1499618838
Interpretation:
The above table includes calculations carried out for computing the average usage of
Independent and Non-Independent Package by UK residents for various purposes. Mean is the
measure of central tendency that helps in providing an overall view regarding a particular
dataset. As mentioned above, 3,002 on-goers availed the benefits of Independent Package
whereas only 831 people took the non-independent package for travelling overseas. Non-
Independent Packages include non-inclusion of a tour guide who helps in formulating the
itinerary and ensuring that maximum experience and customer satisfaction is achieved by such
5
Paraphrase This Document
Need a fresh take? Get an instant paraphrase of this document with our AI Paraphraser
travellers. Conversely, Independent does not include a tour guide (Ismail and et. al., 2018)
(Lapin, 2015). One has complete freedom to do whatever they want to do or wherever they want
to go while on trip.
It is noteworthy that UK Residents tend to prefer more of a non-guided tour. They tend
to explore more on their own. This is a valuable insight that has been discovered through the
above evaluation. In addition to this, on an average, 500 passengers used the independent
package to travel abroad in comparison to their non-independent counterparts which were only
taken up by 139 passer-bys for an overseas trip (Litteral and Thekdi, 2015). As far as Standard
Deviation is concerned, it depicts the measure of dispersion or variability that is present in the
given data set. It exhibits the level of deviation or departure from the mean value present in the
dataset taken into consideration. As per this definition, one can say that 575 people may use this
package either less or more in a given quarter whereas 295 passengers may either adopt or reject
the Non-Independent Package in a given quarter, as far as UK Residents are concerned.
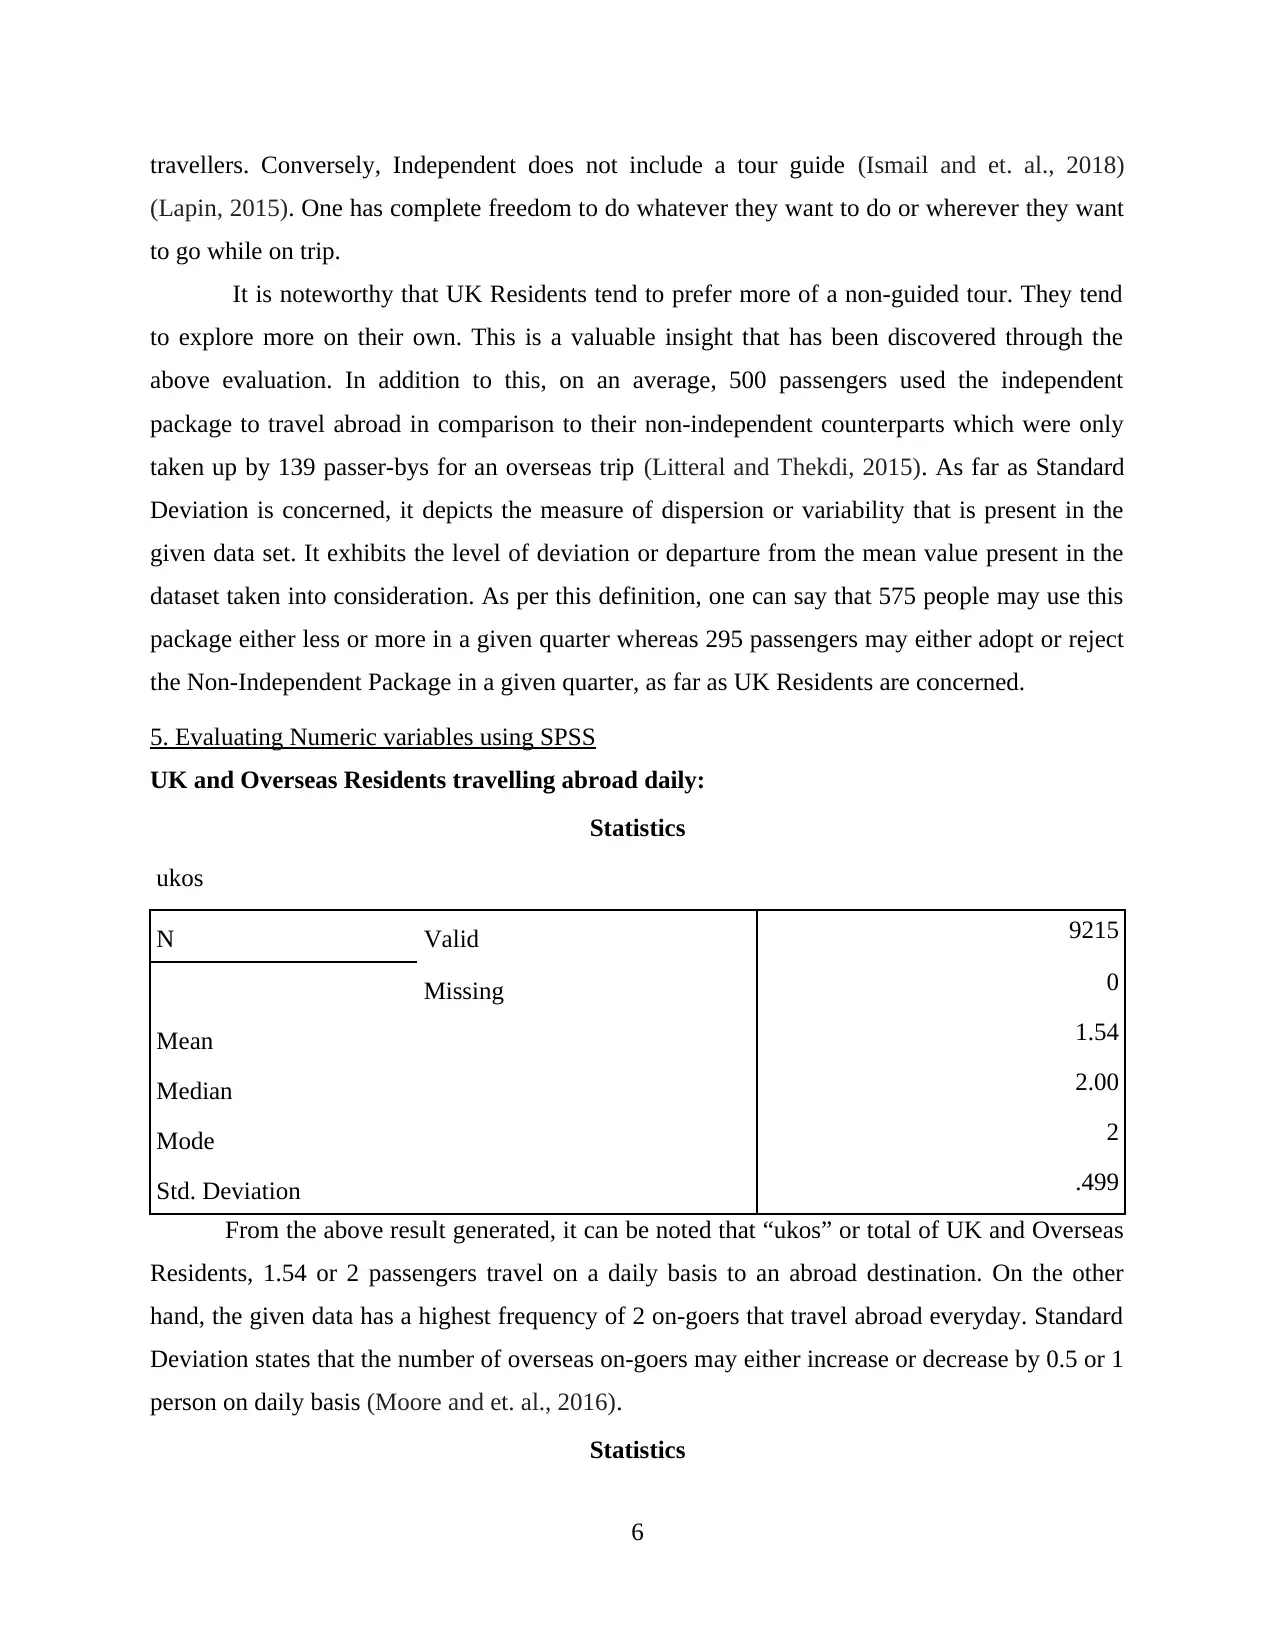
5. Evaluating Numeric variables using SPSS
UK and Overseas Residents travelling abroad daily:
Statistics
ukos
N Valid 9215
Missing 0
Mean 1.54
Median 2.00
Mode 2
Std. Deviation .499
From the above result generated, it can be noted that “ukos” or total of UK and Overseas
Residents, 1.54 or 2 passengers travel on a daily basis to an abroad destination. On the other
hand, the given data has a highest frequency of 2 on-goers that travel abroad everyday. Standard
Deviation states that the number of overseas on-goers may either increase or decrease by 0.5 or 1
person on daily basis (Moore and et. al., 2016).
Statistics
6
(Lapin, 2015). One has complete freedom to do whatever they want to do or wherever they want
to go while on trip.
It is noteworthy that UK Residents tend to prefer more of a non-guided tour. They tend
to explore more on their own. This is a valuable insight that has been discovered through the
above evaluation. In addition to this, on an average, 500 passengers used the independent
package to travel abroad in comparison to their non-independent counterparts which were only
taken up by 139 passer-bys for an overseas trip (Litteral and Thekdi, 2015). As far as Standard
Deviation is concerned, it depicts the measure of dispersion or variability that is present in the
given data set. It exhibits the level of deviation or departure from the mean value present in the
dataset taken into consideration. As per this definition, one can say that 575 people may use this
package either less or more in a given quarter whereas 295 passengers may either adopt or reject
the Non-Independent Package in a given quarter, as far as UK Residents are concerned.
5. Evaluating Numeric variables using SPSS
UK and Overseas Residents travelling abroad daily:
Statistics
ukos
N Valid 9215
Missing 0
Mean 1.54
Median 2.00
Mode 2
Std. Deviation .499
From the above result generated, it can be noted that “ukos” or total of UK and Overseas
Residents, 1.54 or 2 passengers travel on a daily basis to an abroad destination. On the other
hand, the given data has a highest frequency of 2 on-goers that travel abroad everyday. Standard
Deviation states that the number of overseas on-goers may either increase or decrease by 0.5 or 1
person on daily basis (Moore and et. al., 2016).
Statistics
6
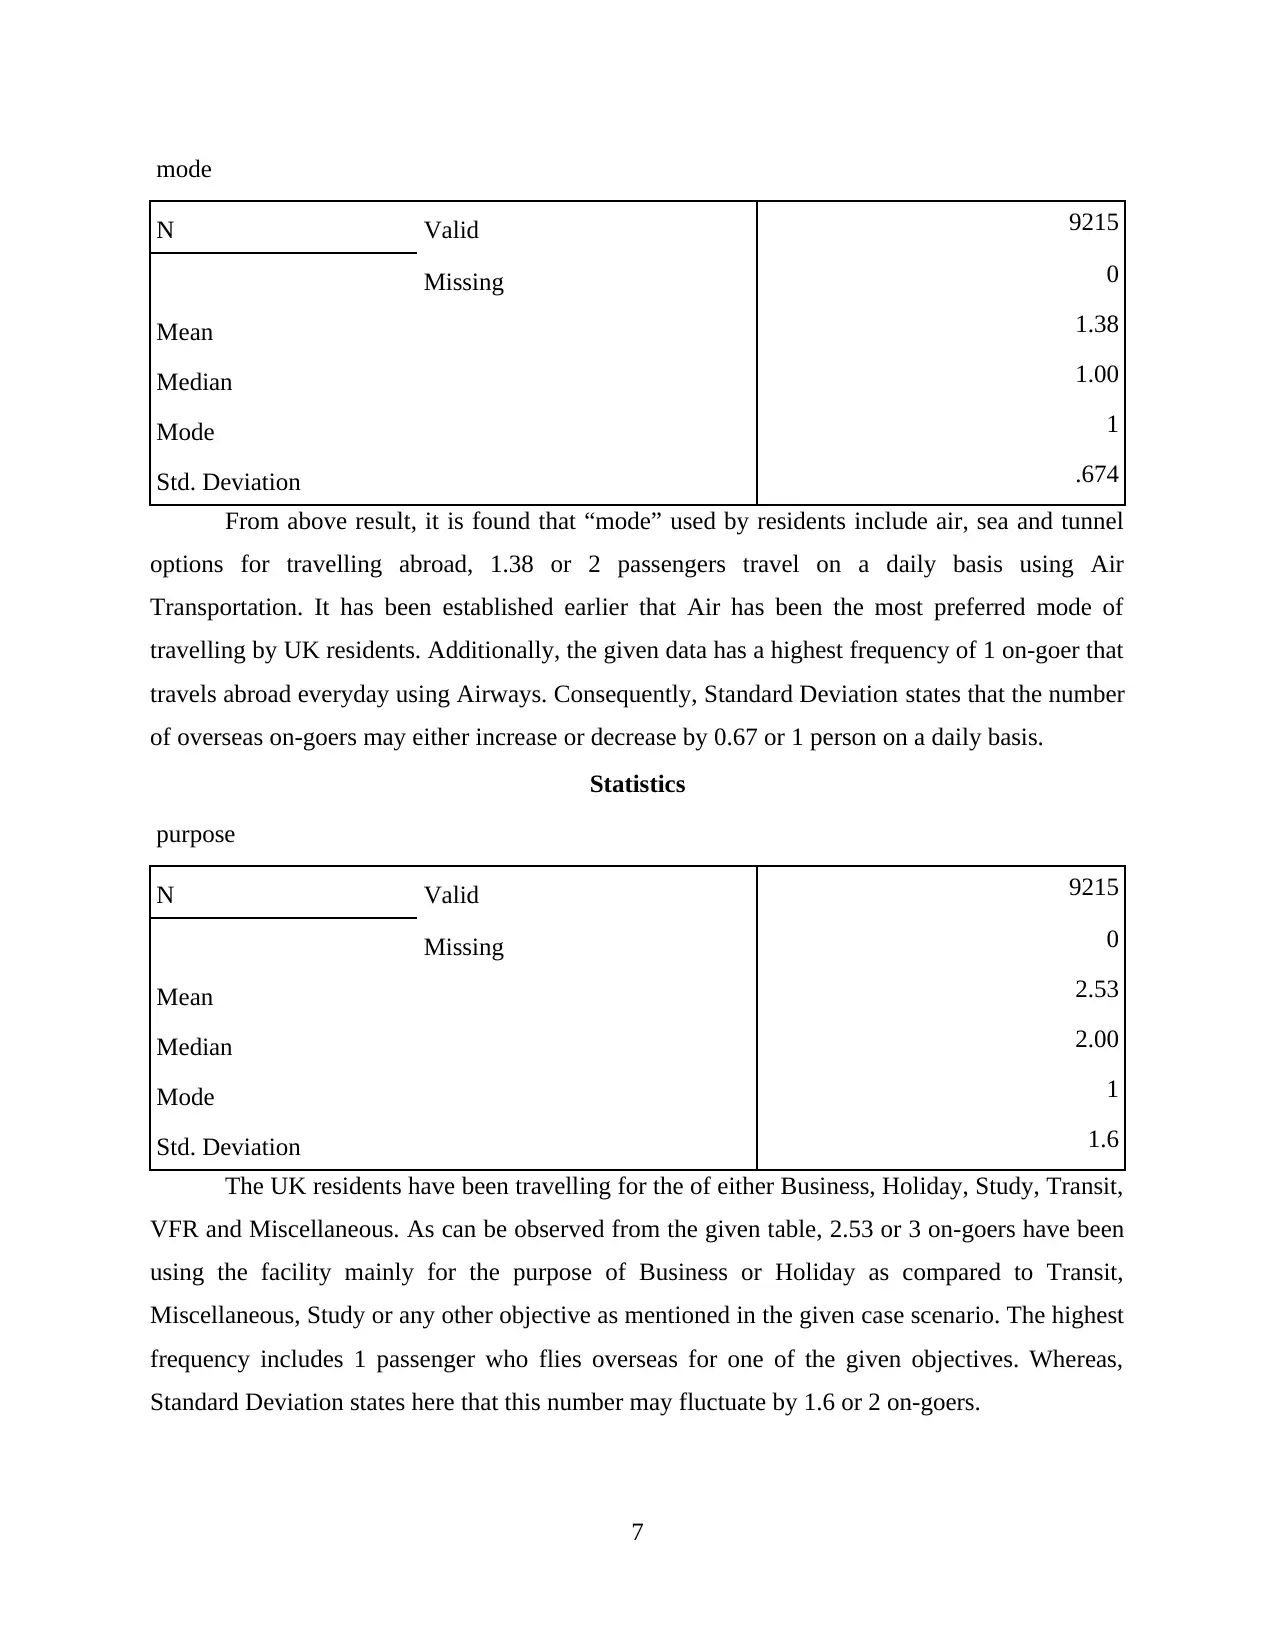
mode
N Valid 9215
Missing 0
Mean 1.38
Median 1.00
Mode 1
Std. Deviation .674
From above result, it is found that “mode” used by residents include air, sea and tunnel
options for travelling abroad, 1.38 or 2 passengers travel on a daily basis using Air
Transportation. It has been established earlier that Air has been the most preferred mode of
travelling by UK residents. Additionally, the given data has a highest frequency of 1 on-goer that
travels abroad everyday using Airways. Consequently, Standard Deviation states that the number
of overseas on-goers may either increase or decrease by 0.67 or 1 person on a daily basis.
Statistics
purpose
N Valid 9215
Missing 0
Mean 2.53
Median 2.00
Mode 1
Std. Deviation 1.6
The UK residents have been travelling for the of either Business, Holiday, Study, Transit,
VFR and Miscellaneous. As can be observed from the given table, 2.53 or 3 on-goers have been
using the facility mainly for the purpose of Business or Holiday as compared to Transit,
Miscellaneous, Study or any other objective as mentioned in the given case scenario. The highest
frequency includes 1 passenger who flies overseas for one of the given objectives. Whereas,
Standard Deviation states here that this number may fluctuate by 1.6 or 2 on-goers.
7
N Valid 9215
Missing 0
Mean 1.38
Median 1.00
Mode 1
Std. Deviation .674
From above result, it is found that “mode” used by residents include air, sea and tunnel
options for travelling abroad, 1.38 or 2 passengers travel on a daily basis using Air
Transportation. It has been established earlier that Air has been the most preferred mode of
travelling by UK residents. Additionally, the given data has a highest frequency of 1 on-goer that
travels abroad everyday using Airways. Consequently, Standard Deviation states that the number
of overseas on-goers may either increase or decrease by 0.67 or 1 person on a daily basis.
Statistics
purpose
N Valid 9215
Missing 0
Mean 2.53
Median 2.00
Mode 1
Std. Deviation 1.6
The UK residents have been travelling for the of either Business, Holiday, Study, Transit,
VFR and Miscellaneous. As can be observed from the given table, 2.53 or 3 on-goers have been
using the facility mainly for the purpose of Business or Holiday as compared to Transit,
Miscellaneous, Study or any other objective as mentioned in the given case scenario. The highest
frequency includes 1 passenger who flies overseas for one of the given objectives. Whereas,
Standard Deviation states here that this number may fluctuate by 1.6 or 2 on-goers.
7
⊘ This is a preview!⊘
Do you want full access?
Subscribe today to unlock all pages.
Trusted by 1+ million students worldwide
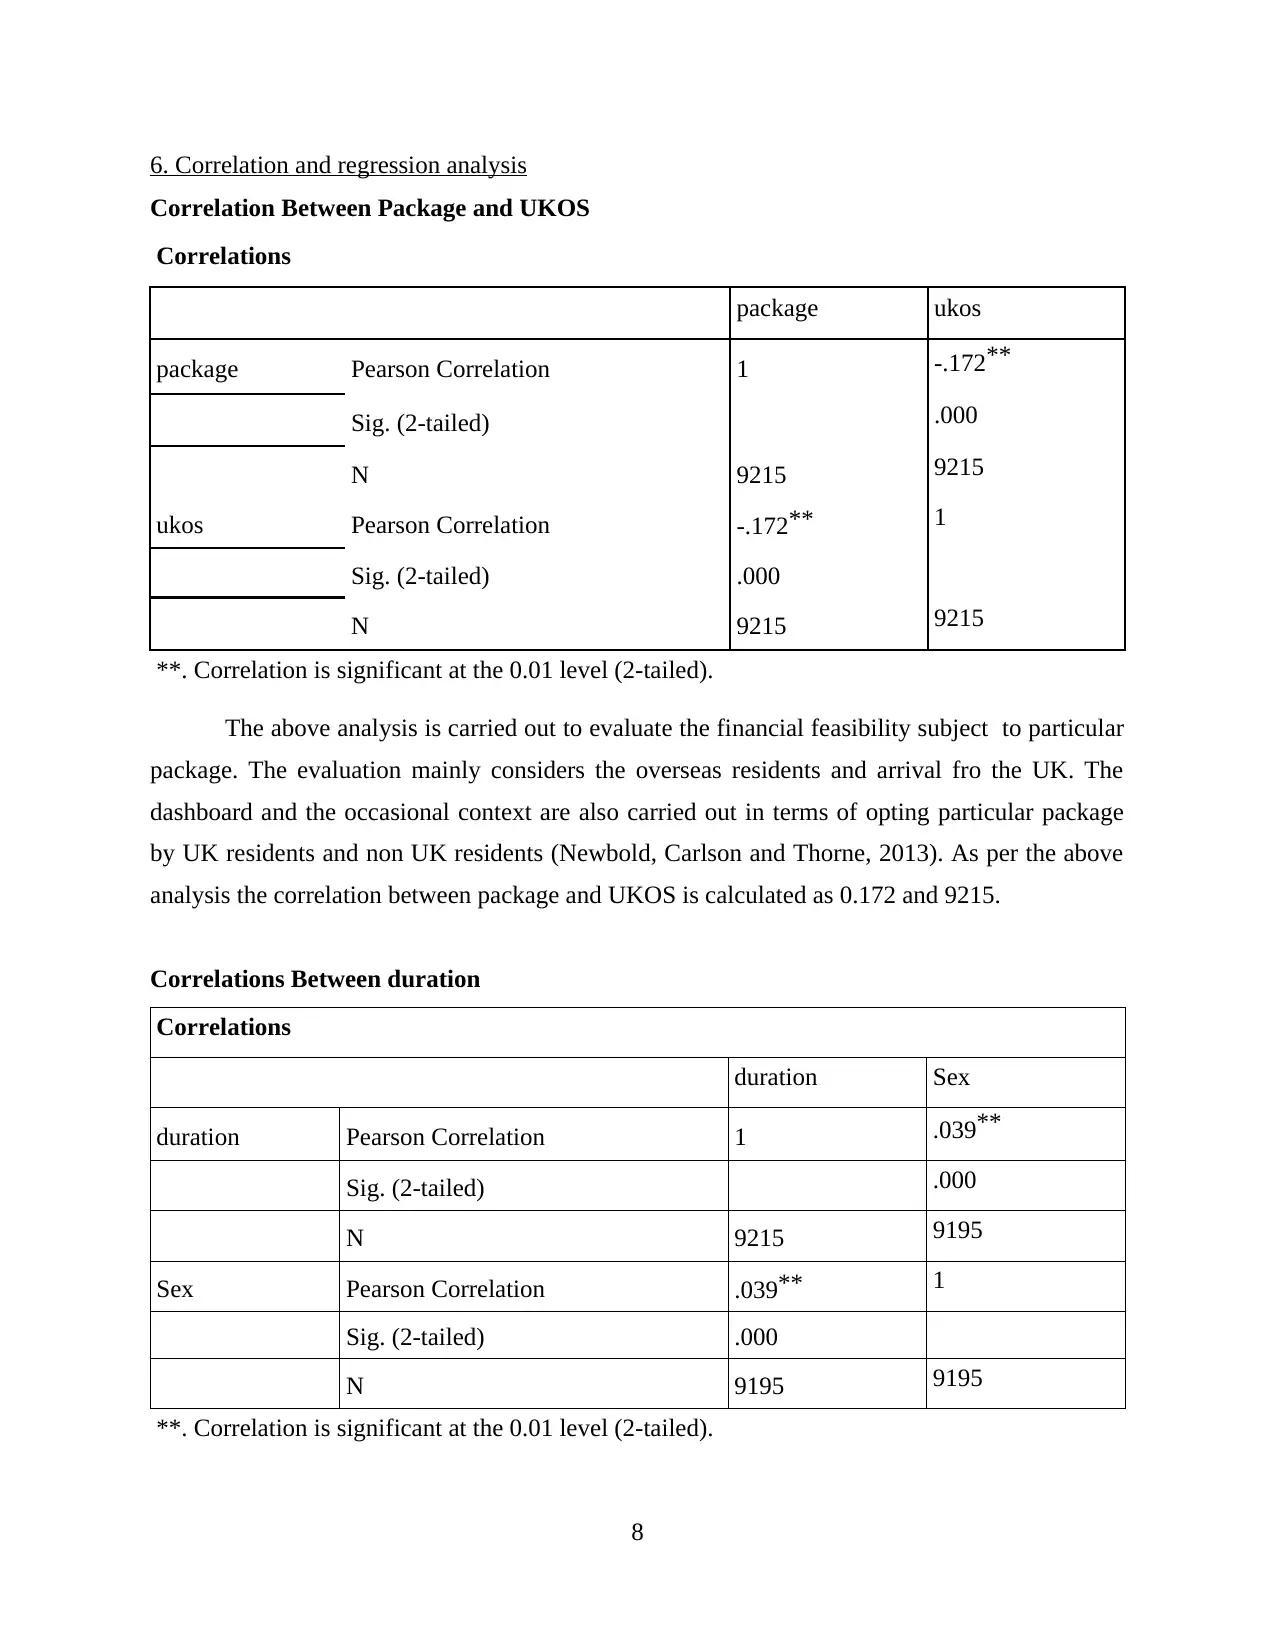
6. Correlation and regression analysis
Correlation Between Package and UKOS
Correlations
package ukos
package Pearson Correlation 1 -.172**
Sig. (2-tailed) .000
N 9215 9215
ukos Pearson Correlation -.172** 1
Sig. (2-tailed) .000
N 9215 9215
**. Correlation is significant at the 0.01 level (2-tailed).
The above analysis is carried out to evaluate the financial feasibility subject to particular
package. The evaluation mainly considers the overseas residents and arrival fro the UK. The
dashboard and the occasional context are also carried out in terms of opting particular package
by UK residents and non UK residents (Newbold, Carlson and Thorne, 2013). As per the above
analysis the correlation between package and UKOS is calculated as 0.172 and 9215.
Correlations Between duration
Correlations
duration Sex
duration Pearson Correlation 1 .039**
Sig. (2-tailed) .000
N 9215 9195
Sex Pearson Correlation .039** 1
Sig. (2-tailed) .000
N 9195 9195
**. Correlation is significant at the 0.01 level (2-tailed).
8
Paraphrase This Document
Need a fresh take? Get an instant paraphrase of this document with our AI Paraphraser
From the above analysis it is evaluated that the sex and duration relation is calculated
as .039 from 9195 respondents.
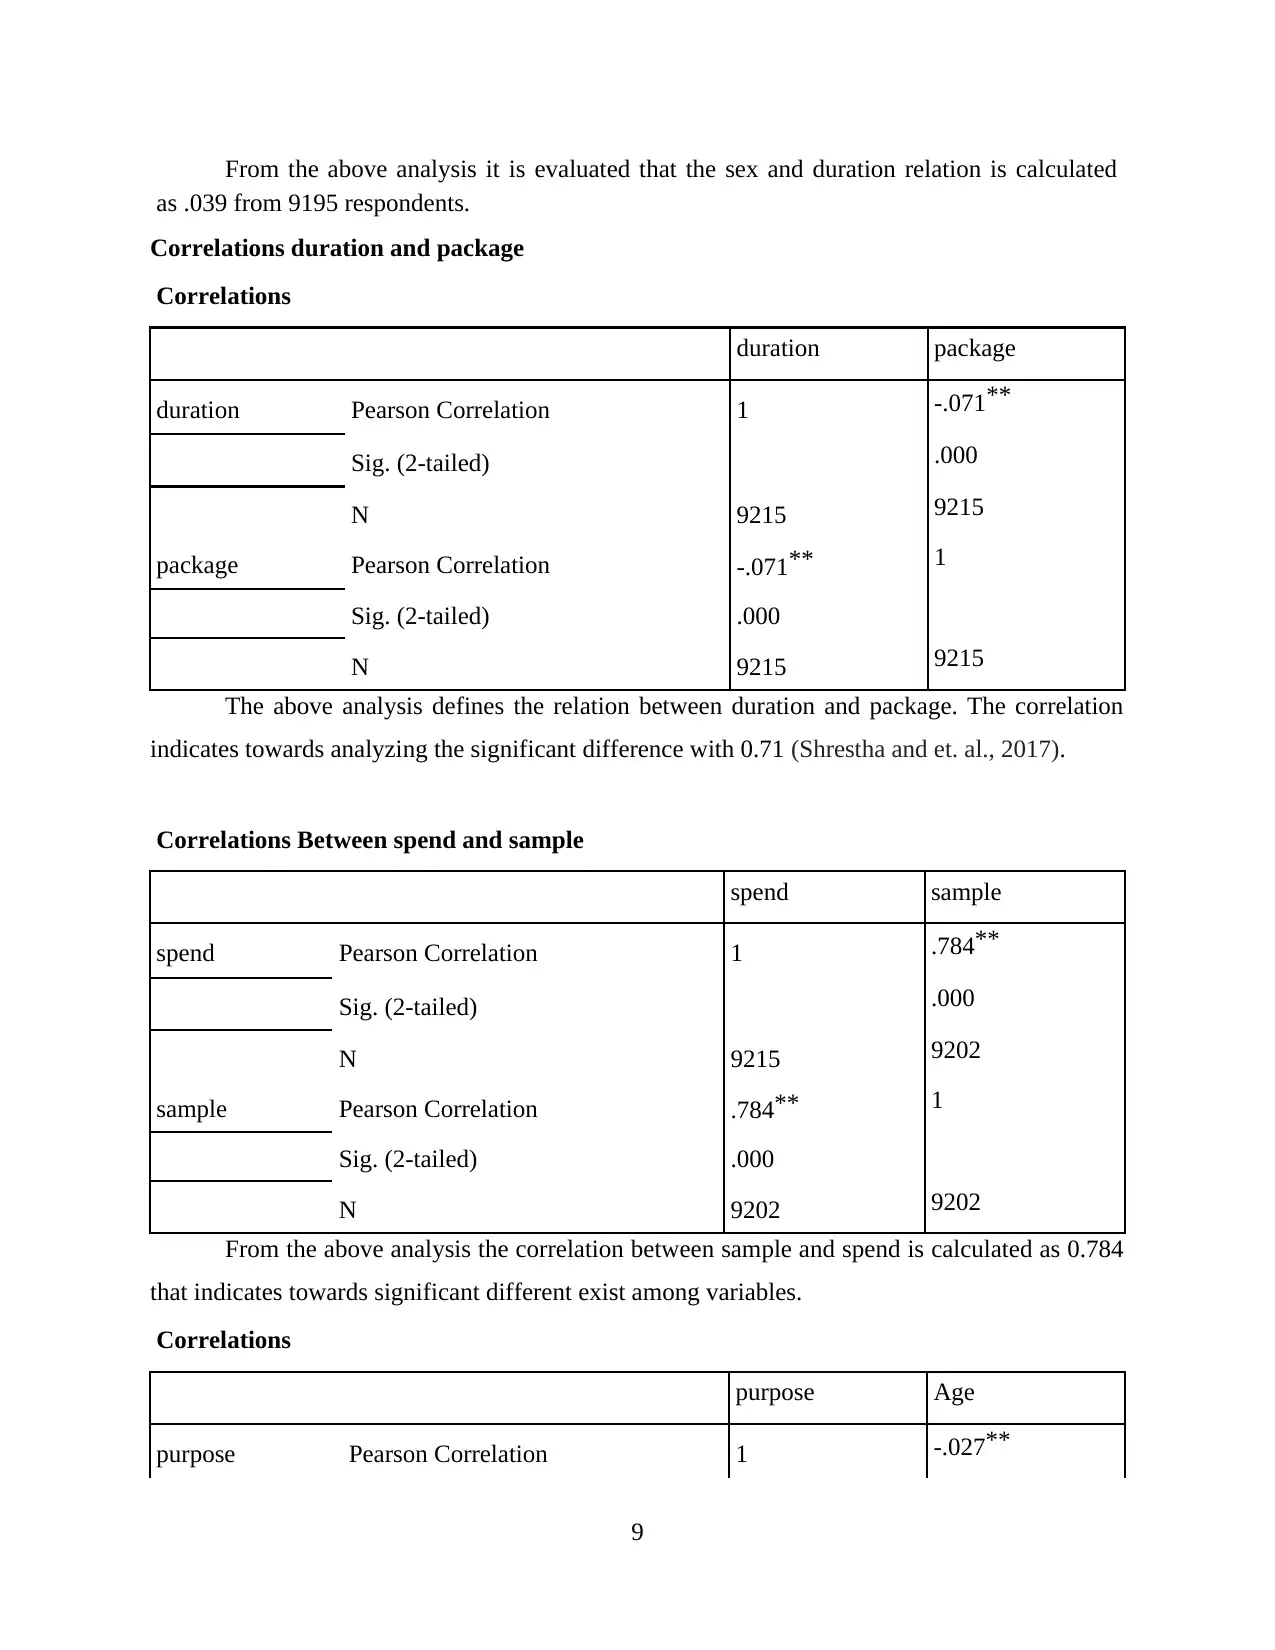
Correlations duration and package
Correlations
duration package
duration Pearson Correlation 1 -.071**
Sig. (2-tailed) .000
N 9215 9215
package Pearson Correlation -.071** 1
Sig. (2-tailed) .000
N 9215 9215
The above analysis defines the relation between duration and package. The correlation
indicates towards analyzing the significant difference with 0.71 (Shrestha and et. al., 2017).
Correlations Between spend and sample
spend sample
spend Pearson Correlation 1 .784**
Sig. (2-tailed) .000
N 9215 9202
sample Pearson Correlation .784** 1
Sig. (2-tailed) .000
N 9202 9202
From the above analysis the correlation between sample and spend is calculated as 0.784
that indicates towards significant different exist among variables.
Correlations
purpose Age
purpose Pearson Correlation 1 -.027**
9
as .039 from 9195 respondents.
Correlations duration and package
Correlations
duration package
duration Pearson Correlation 1 -.071**
Sig. (2-tailed) .000
N 9215 9215
package Pearson Correlation -.071** 1
Sig. (2-tailed) .000
N 9215 9215
The above analysis defines the relation between duration and package. The correlation
indicates towards analyzing the significant difference with 0.71 (Shrestha and et. al., 2017).
Correlations Between spend and sample
spend sample
spend Pearson Correlation 1 .784**
Sig. (2-tailed) .000
N 9215 9202
sample Pearson Correlation .784** 1
Sig. (2-tailed) .000
N 9202 9202
From the above analysis the correlation between sample and spend is calculated as 0.784
that indicates towards significant different exist among variables.
Correlations
purpose Age
purpose Pearson Correlation 1 -.027**
9
Sig. (2-tailed) .010
N 9215 9215
Age Pearson Correlation -.027** 1
Sig. (2-tailed) .010
N 9215 9215
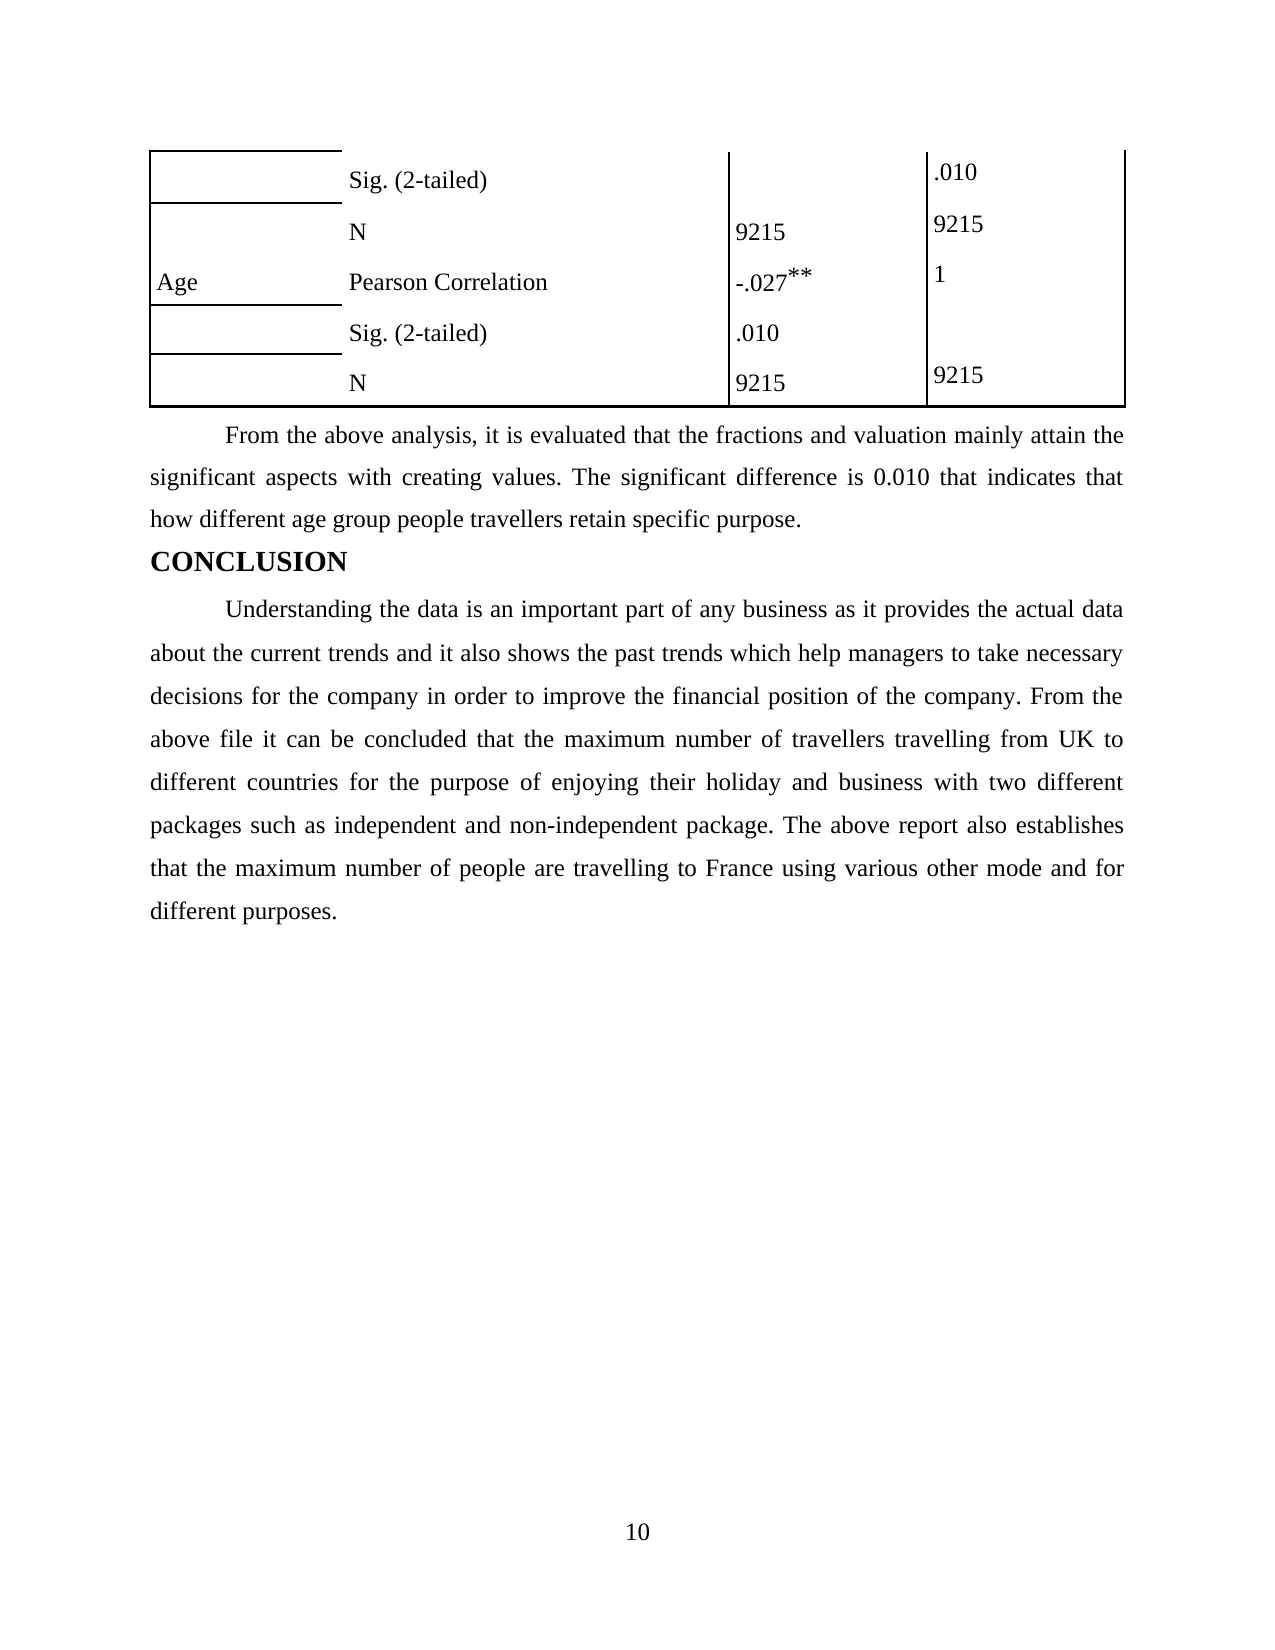
From the above analysis, it is evaluated that the fractions and valuation mainly attain the
significant aspects with creating values. The significant difference is 0.010 that indicates that
how different age group people travellers retain specific purpose.
CONCLUSION
Understanding the data is an important part of any business as it provides the actual data
about the current trends and it also shows the past trends which help managers to take necessary
decisions for the company in order to improve the financial position of the company. From the
above file it can be concluded that the maximum number of travellers travelling from UK to
different countries for the purpose of enjoying their holiday and business with two different
packages such as independent and non-independent package. The above report also establishes
that the maximum number of people are travelling to France using various other mode and for
different purposes.
10
N 9215 9215
Age Pearson Correlation -.027** 1
Sig. (2-tailed) .010
N 9215 9215
From the above analysis, it is evaluated that the fractions and valuation mainly attain the
significant aspects with creating values. The significant difference is 0.010 that indicates that
how different age group people travellers retain specific purpose.
CONCLUSION
Understanding the data is an important part of any business as it provides the actual data
about the current trends and it also shows the past trends which help managers to take necessary
decisions for the company in order to improve the financial position of the company. From the
above file it can be concluded that the maximum number of travellers travelling from UK to
different countries for the purpose of enjoying their holiday and business with two different
packages such as independent and non-independent package. The above report also establishes
that the maximum number of people are travelling to France using various other mode and for
different purposes.
10
⊘ This is a preview!⊘
Do you want full access?
Subscribe today to unlock all pages.
Trusted by 1+ million students worldwide
1 out of 13
Related Documents


Your All-in-One AI-Powered Toolkit for Academic Success.
+13062052269
info@desklib.com
Available 24*7 on WhatsApp / Email
![[object Object]](/_next/static/media/star-bottom.7253800d.svg)
Unlock your academic potential
Copyright © 2020–2026 A2Z Services. All Rights Reserved. Developed and managed by ZUCOL.