Accounting Strategy Analysis of Treasury Wine Estates (TWE) - 2017
VerifiedAdded on 2020/03/16
|10
|1246
|56
Report
AI Summary
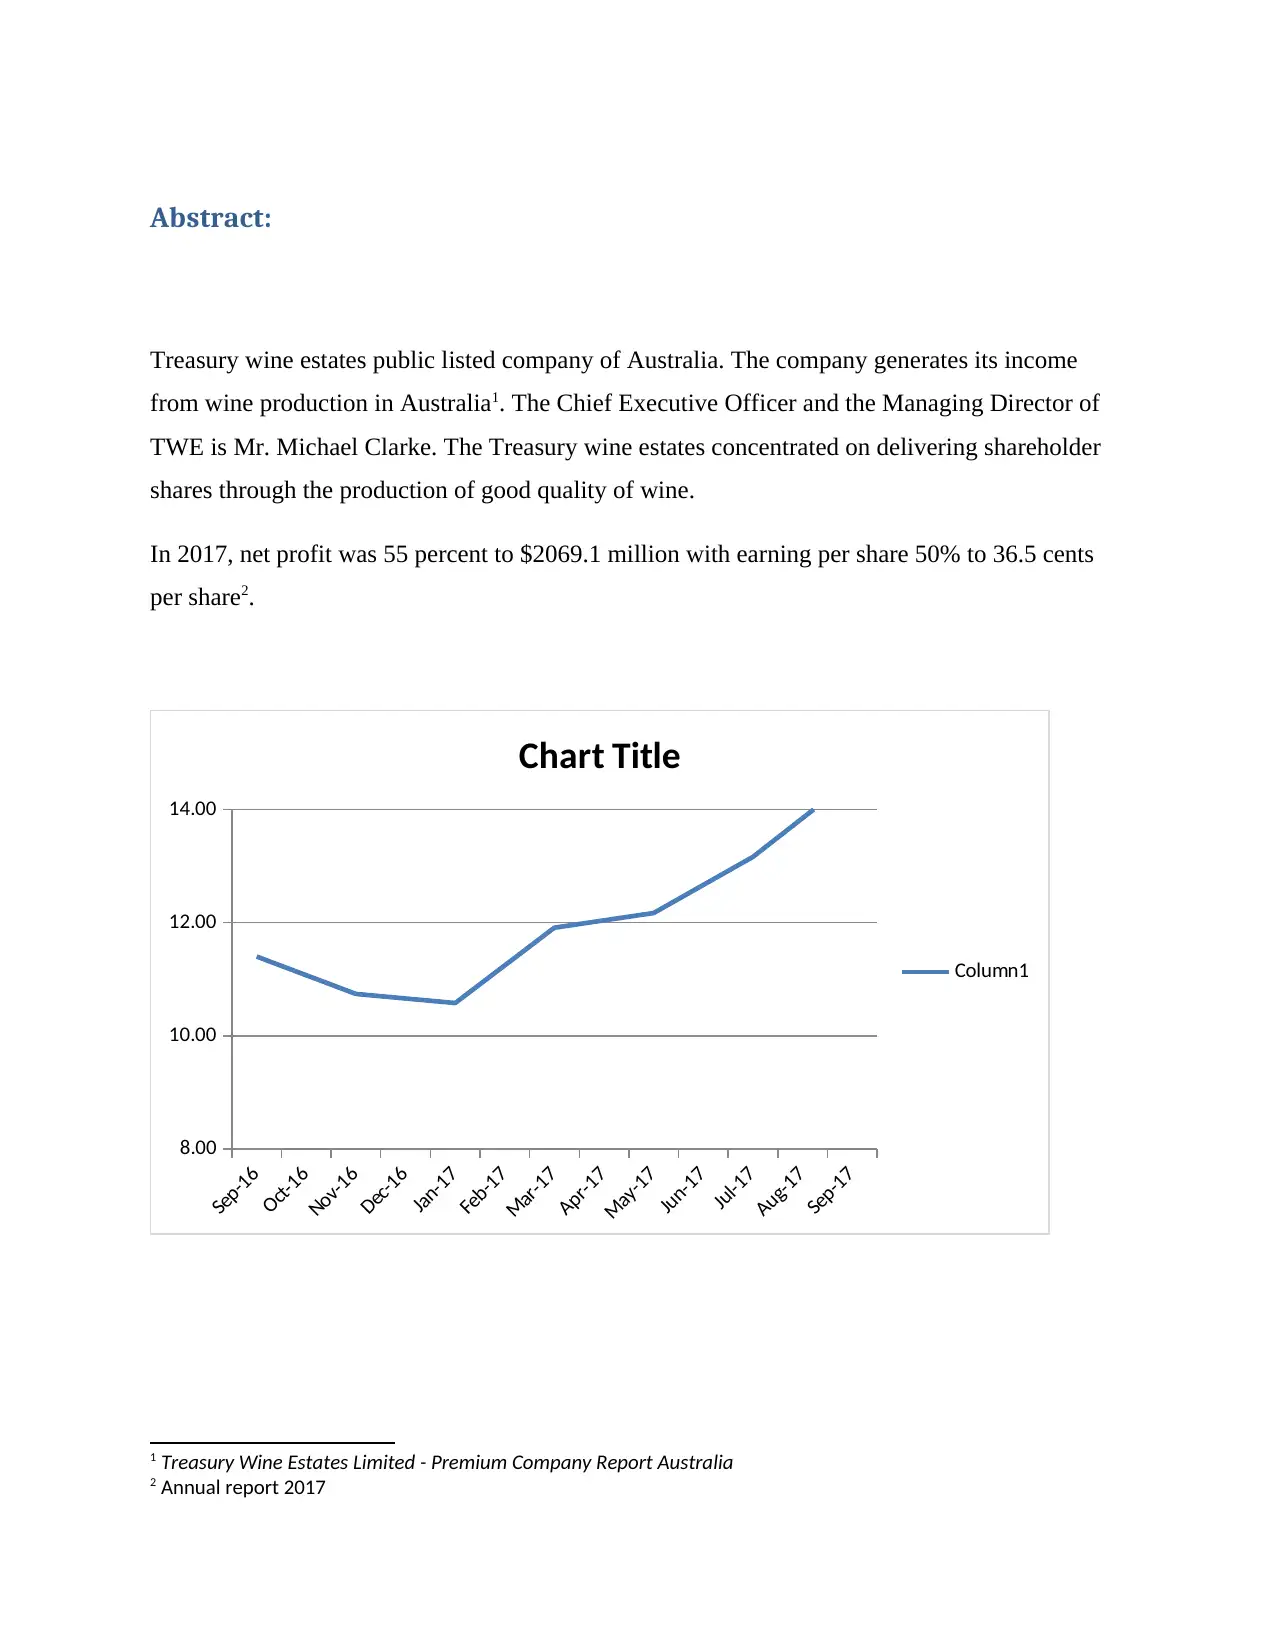
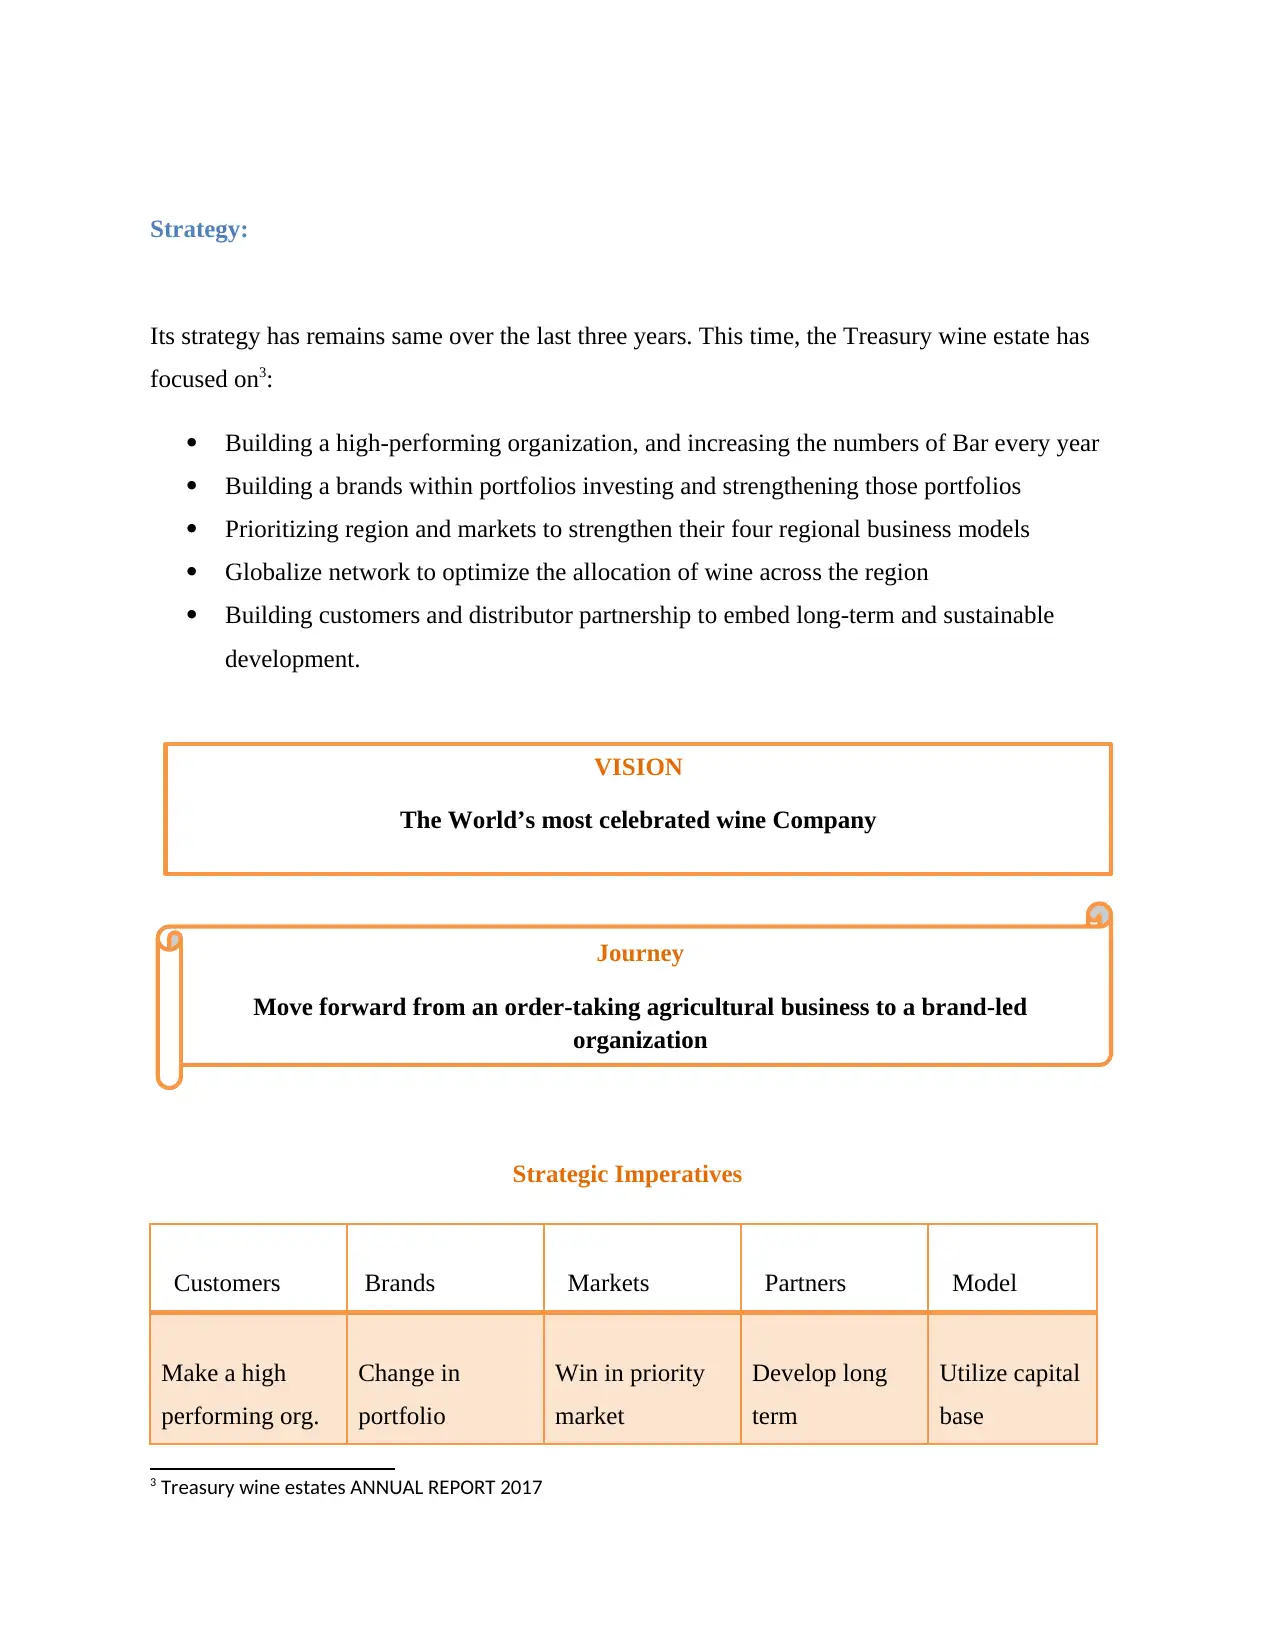
This report provides an analysis of Treasury Wine Estates (TWE), a publicly listed Australian company focused on wine production. The report examines TWE's 2017 financial performance, highlighting a 55% increase in net profit to $2069.1 million and a 50% increase in earnings per share to 36.5 cents. The company's strategy, which remained consistent over the past three years, focused on building a high-performing organization, brand development, market prioritization, global network optimization, and customer partnerships. The financial review covers key statistics and ratios, revenue, cost of goods sold, corporate costs, EBITS, SGARA, tax expense, material items, net profit after tax, and earnings per share. The balance sheet movement, working capital, capital expenditure, and dividend payments are also analyzed. The report details TWE's performance across its four regional segments: Australia and New Zealand, Europe, Americas, and Asia. The report concludes with a discussion of the company's future perspectives, emphasizing continued focus on strengthening regional business models, brands, teams, and partnerships.

Accounting Strategy Analysis
17Treasury Wine Estates
Paraphrase This Document
Need a fresh take? Get an instant paraphrase of this document with our AI Paraphraser

Abstract:
Treasury wine estates public listed company of Australia. The company generates its income
from wine production in Australia1. The Chief Executive Officer and the Managing Director of
TWE is Mr. Michael Clarke. The Treasury wine estates concentrated on delivering shareholder
shares through the production of good quality of wine.
In 2017, net profit was 55 percent to $2069.1 million with earning per share 50% to 36.5 cents
per share2.
Sep-16
Oct-16
Nov-16
Dec-16
Jan-17
Feb-17
Mar-17
Apr-17
May-17
Jun-17
Jul-17
Aug-17
Sep-17
8.00
10.00
12.00
14.00
Chart Title
Column1
1 Treasury Wine Estates Limited - Premium Company Report Australia
2 Annual report 2017

Strategy:
Its strategy has remains same over the last three years. This time, the Treasury wine estate has
focused on3:
Building a high-performing organization, and increasing the numbers of Bar every year
Building a brands within portfolios investing and strengthening those portfolios
Prioritizing region and markets to strengthen their four regional business models
Globalize network to optimize the allocation of wine across the region
Building customers and distributor partnership to embed long-term and sustainable
development.
Strategic Imperatives
Customers Brands Markets Partners Model
Make a high
performing org.
Change in
portfolio
Win in priority
market
Develop long
term
Utilize capital
base
3 Treasury wine estates ANNUAL REPORT 2017
VISION
The World’s most celebrated wine Company
Journey
Move forward from an order-taking agricultural business to a brand-led
organization
⊘ This is a preview!⊘
Do you want full access?
Subscribe today to unlock all pages.

Trusted by 1+ million students worldwide

relationship
Behaviors
Business activity:
TWE business focused on premiumisation supported by innovation, brand building, sales, and
marketing execution. Its strategy is to concentrate on a regionally focused, agricultural company,
high-performance organization4.
Significant changes:
4 Treasury wine estates annual 2017 financial result. Media release.
Focus on top priorties of customers belief in product, customers and
company
Build trust Collaborate with the stakeholders
to achive goals.
Paraphrase This Document
Need a fresh take? Get an instant paraphrase of this document with our AI Paraphraser

TWE focused on four regional segments:
Australia
Europe
Asia
Americas
Business model:
TWE united wine business with 3 principal:
Growing grape
Production of wine
Marketing, sales and distribution of wine.
Financial review:
Current price data5
Current price $13.690
Open $13.570
High $13.760
Low $13.505
Last close $13.630
5 investSMART website. www.investsmart.com (Anon., 2017)

Volume 1610626
Price movement $0.06 (increase .44%)
Key stats and ratios:
Jun 17 2017
Net profit margin 11.43% 10.65%
Operating margin 17.82% 16.35%
EBITD margin - 21.26%
Return on average assets 5.00% 5.11%
Return on average equity 7.31% 7.51%
-
Revenue6
Net revenue up 11 % driven by the volume growth,
with Net sales revenue up 3 percent.
Other revenue up by 21 %, reflecting revenue
recognized on sale.
Cost of Goods Sold
6 (Anon., 2017)
⊘ This is a preview!⊘
Do you want full access?
Subscribe today to unlock all pages.

Trusted by 1+ million students worldwide

Total cumulative COGS savings delivered by the supply chain optimization initiative $80
million, which increases by $39 million in 2017.
Corporate costs
Increased by $6.8 million to $43.1 million, reflecting investment in Treasury Wine
Estate.
EBITS
EBITS up by 43% to $455.1 million.
Also in the financial year 2017 EBITS are one-off items, getting a $8 million gain; profit
on asset sales in the US
SGARA
SGARA faces loss of $5.7 million due to higher costs associated with the 2016
Californian vintage.
Tax expense
Higher tax expense due to increase in earning,
Material items
Material expense of $22.0 million
Net profit after tax
Net profit after tax before material item up to $291.9 million due to higher EBITS and
lower SGARA loss.
Earnings per Share (EPS)
Earing per Share (before SGARA and Material items) is grown by 41 percent to +31
percent on report basis.
Paraphrase This Document
Need a fresh take? Get an instant paraphrase of this document with our AI Paraphraser

Balance sheet movement as on 30 June 2017:
Net assets increase from $39.3 million to $3,608.5 million, due to the uplift in non-
current inventory, decrease in borrowings, and utilization of provision. Net assets
increased by $90.3 million.
Higher working capital relative to 30 June 2016.
Total inventory increased by $137.7 million to $1,711.8 million
Decreased in property, plant, and equipment $19.3 million to $1,328.5 million
Borrowing decreased by $30.6 million to $600.5 million.
Tax assets and liabilities a movement reflects unwind of DTAs and increase in current tax
payable.
At 30 June 2017, TWE had debt facilities totaling approx. $1.2 billion:
US private placement notes of $520.8 million, with the US $ 150 million of notes issued
in June 2017.
Syndicated debt facilities totaling $658.0 million.
Working capital
Working capital outflow is:
Increase in inventory reflecting the: - high-yielding, high-quality vintage in Australia.
Lower receivables drove by improved collection with customers.
Operating pay is higher as TWE uplifted both distributors and customers.
Capital expenditure:
Capital expenditure increase by $76.6 million to $210.4 million
- Maintenance & replacement of $109.8 million
- Capex $48.4 million to integration synergies
- Capex $37.9 million on vineyard acquisition to drive increase in luxury supply
- Capex $14.3 million to deliver supply chain

Dividend paid:
Increase in dividend paid 12 percent per share in financial year 2016 to 13 per cent per
share in the fiscal year 2017
Amount of tax paid:
Increase in income and duration of tax payment.
Material items:
Restriction on outgoing and costs, because of acquisition with Diageo wine
Sales of excess assets in Australia, New Zealand and the US.
Information is based on unaudited financial statement7.
Treasury Wine Estate delivers profit growth and margin accretion across all regions:
Australia and New Zealand reported 24 percent EBITS to $111.1 million.
Europe reported 0.6 percent EBITS growth to $48.0 million and EBITS increased 13.6
percent.
Americas reported 44 percent EBITS growth to $48.0 million and EBITS margin of 17.8
percent.
Asia reported 47% EBITS growth to $189.0 million and an EBITS margin of 38.1
percent.
TWE delivered the increase in Cost of Goods Sold (COGS) saving of $39 million in the financial
year 2017 total of cumulative savings to $80 million. In the fiscal year, 2017 were notice higher
vintage costs from the financial year 2014 and 2015 in Australia.
Future perspective:
7 (Anon., n.d.)
⊘ This is a preview!⊘
Do you want full access?
Subscribe today to unlock all pages.

Trusted by 1+ million students worldwide

In the fiscal year 2018, they will continue to focus on strengthening its regional business models,
brands, teams, and partnership.
Action continues from the fiscal year 2018, TWE will concentrate on accelerating its four region
growth in the financial year 2019 and increase the supply of wine, which already on TWE
financial record.
REFERENCES:
Anon., 2017. Financial times. [Online] Available at: www.market.ft.com.
Anon., 2017. InvestSMART. [Online] Available at: www.investsmart.com.au/shares/asx-twe/treasury-
wine-estates-limited.
Anon., 2017. Treasury wine estate. [Online] Available at: www.tweglobal.com.
Anon., 2017. Treasury Wine Estates ANNUAL REPORT 2017. pdf. Australia: TREASURY WINE ESTATES
LIMITED.
Anon., 2017. Treasury Wine Estates Limited - Premium Company Report Australia. company report.
Australia: IBISworld IBISworld.
Anon., n.d. 4-traders. [Online] Available at: http://www.4-traders.com [Accessed 16 Augustus 2017].
Greenblat, E., 2017. Treasury Wine Estates posts 55pc lift in full-year profit. The Australian.
1 out of 10
Related Documents

Your All-in-One AI-Powered Toolkit for Academic Success.
+13062052269
info@desklib.com
Available 24*7 on WhatsApp / Email
Unlock your academic potential
Copyright © 2020–2025 A2Z Services. All Rights Reserved. Developed and managed by ZUCOL.