B-520: Trend Analysis of Janata Bank Financial Statements

Verified

Added on  2022/07/21

|11
|1619
|30
Report
AI Summary
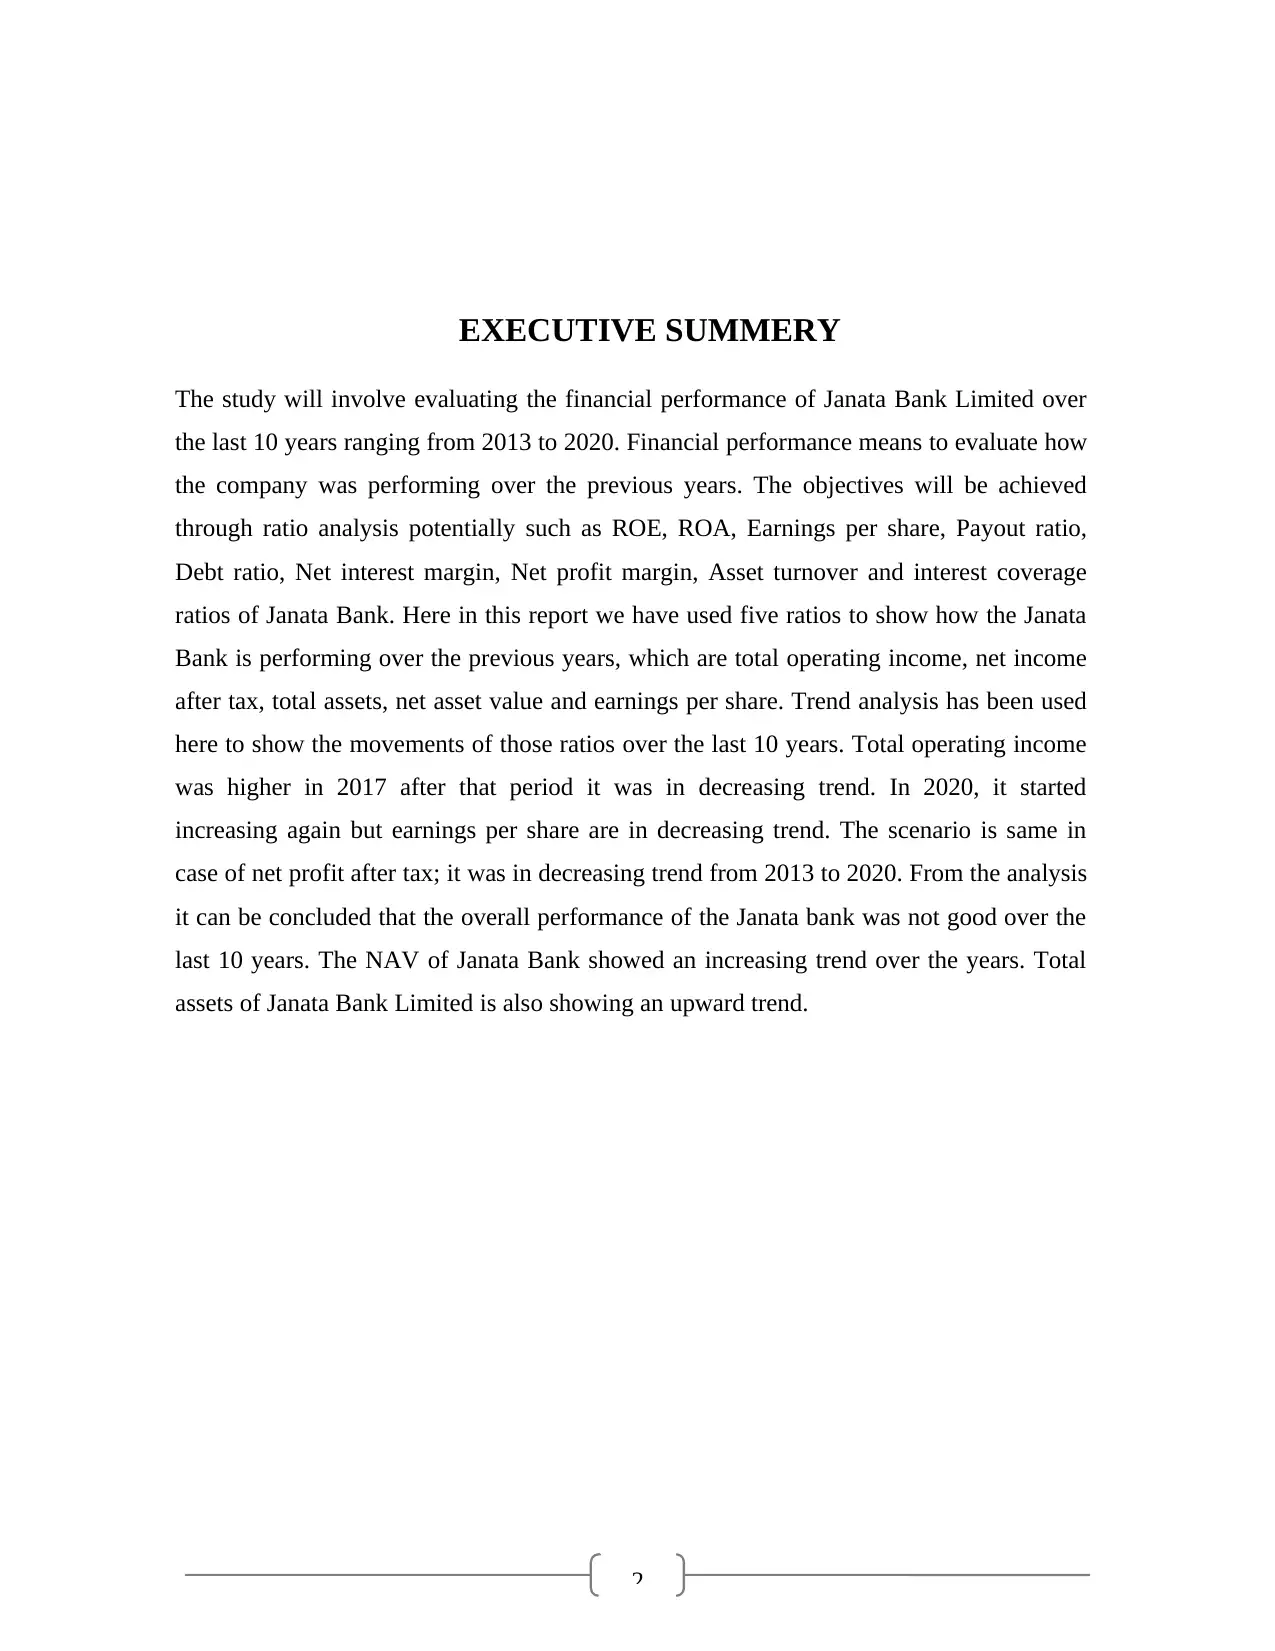
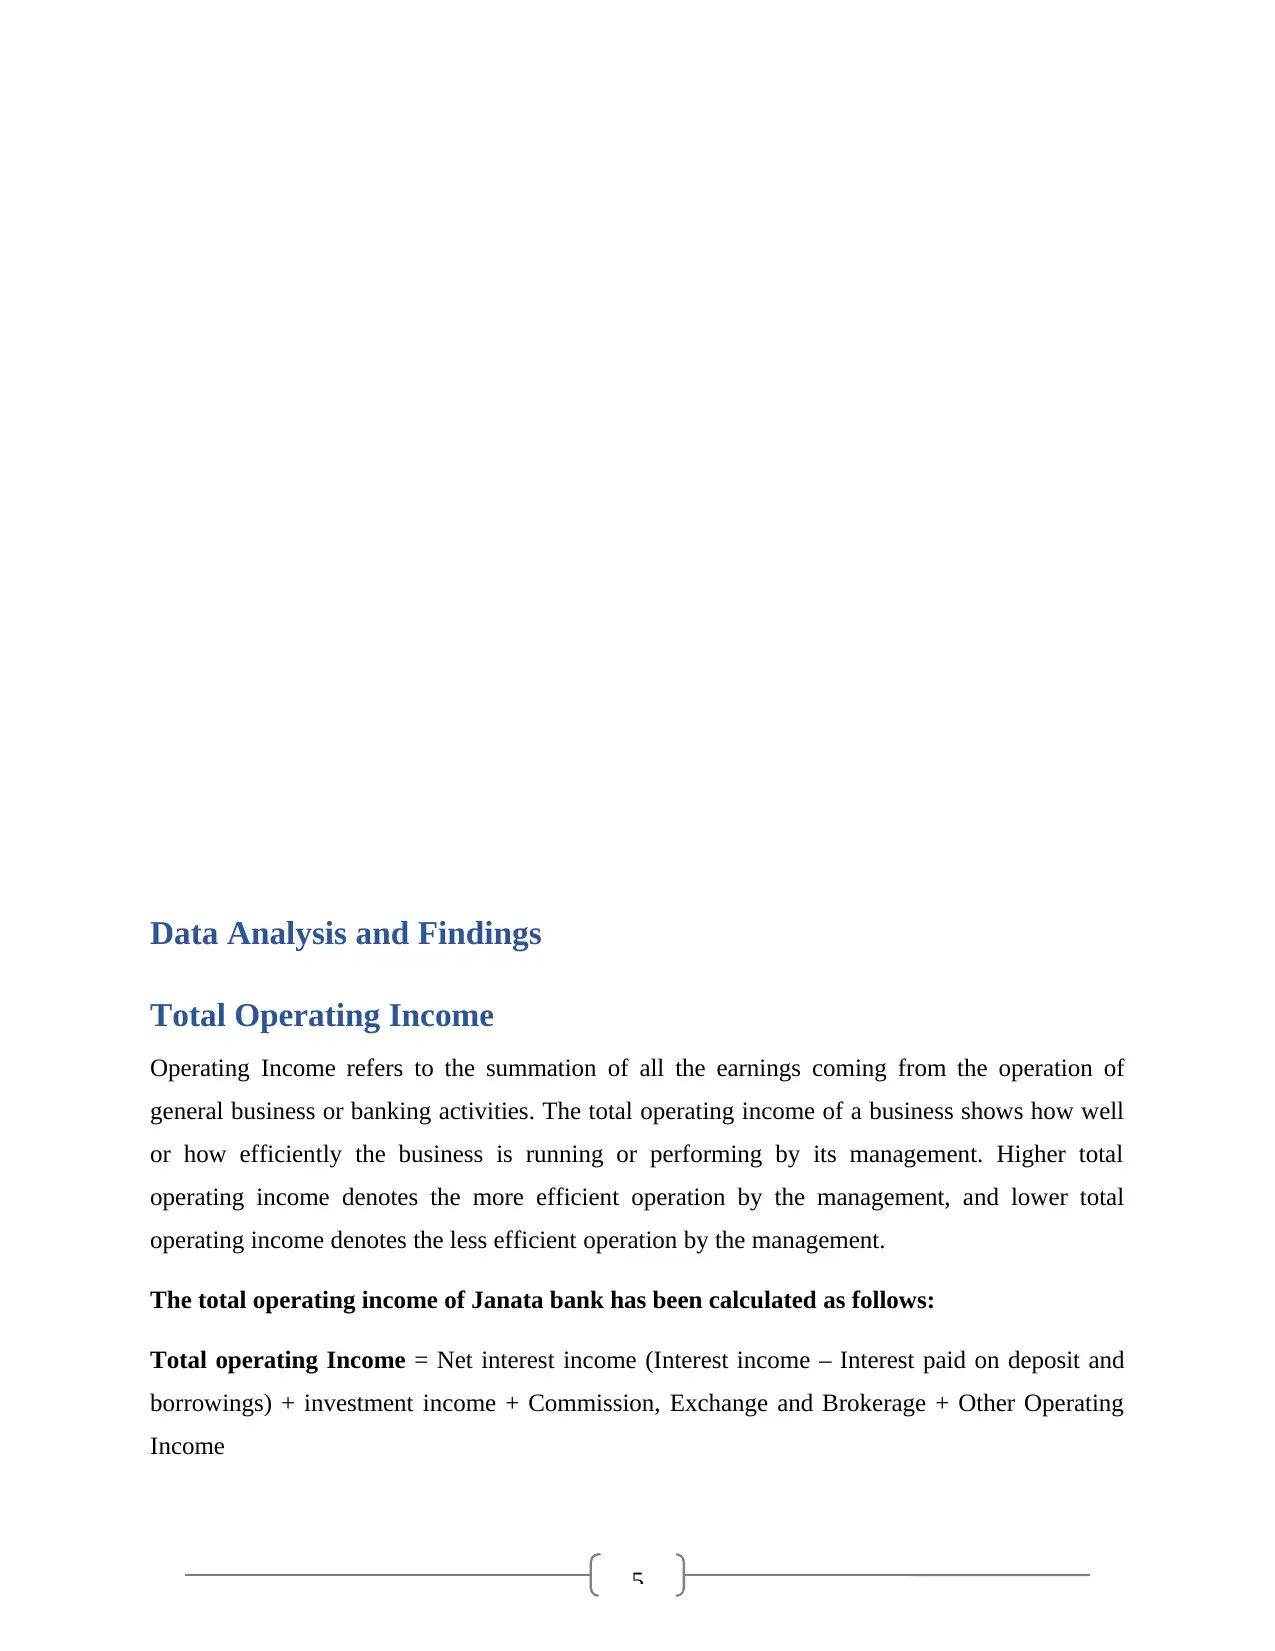
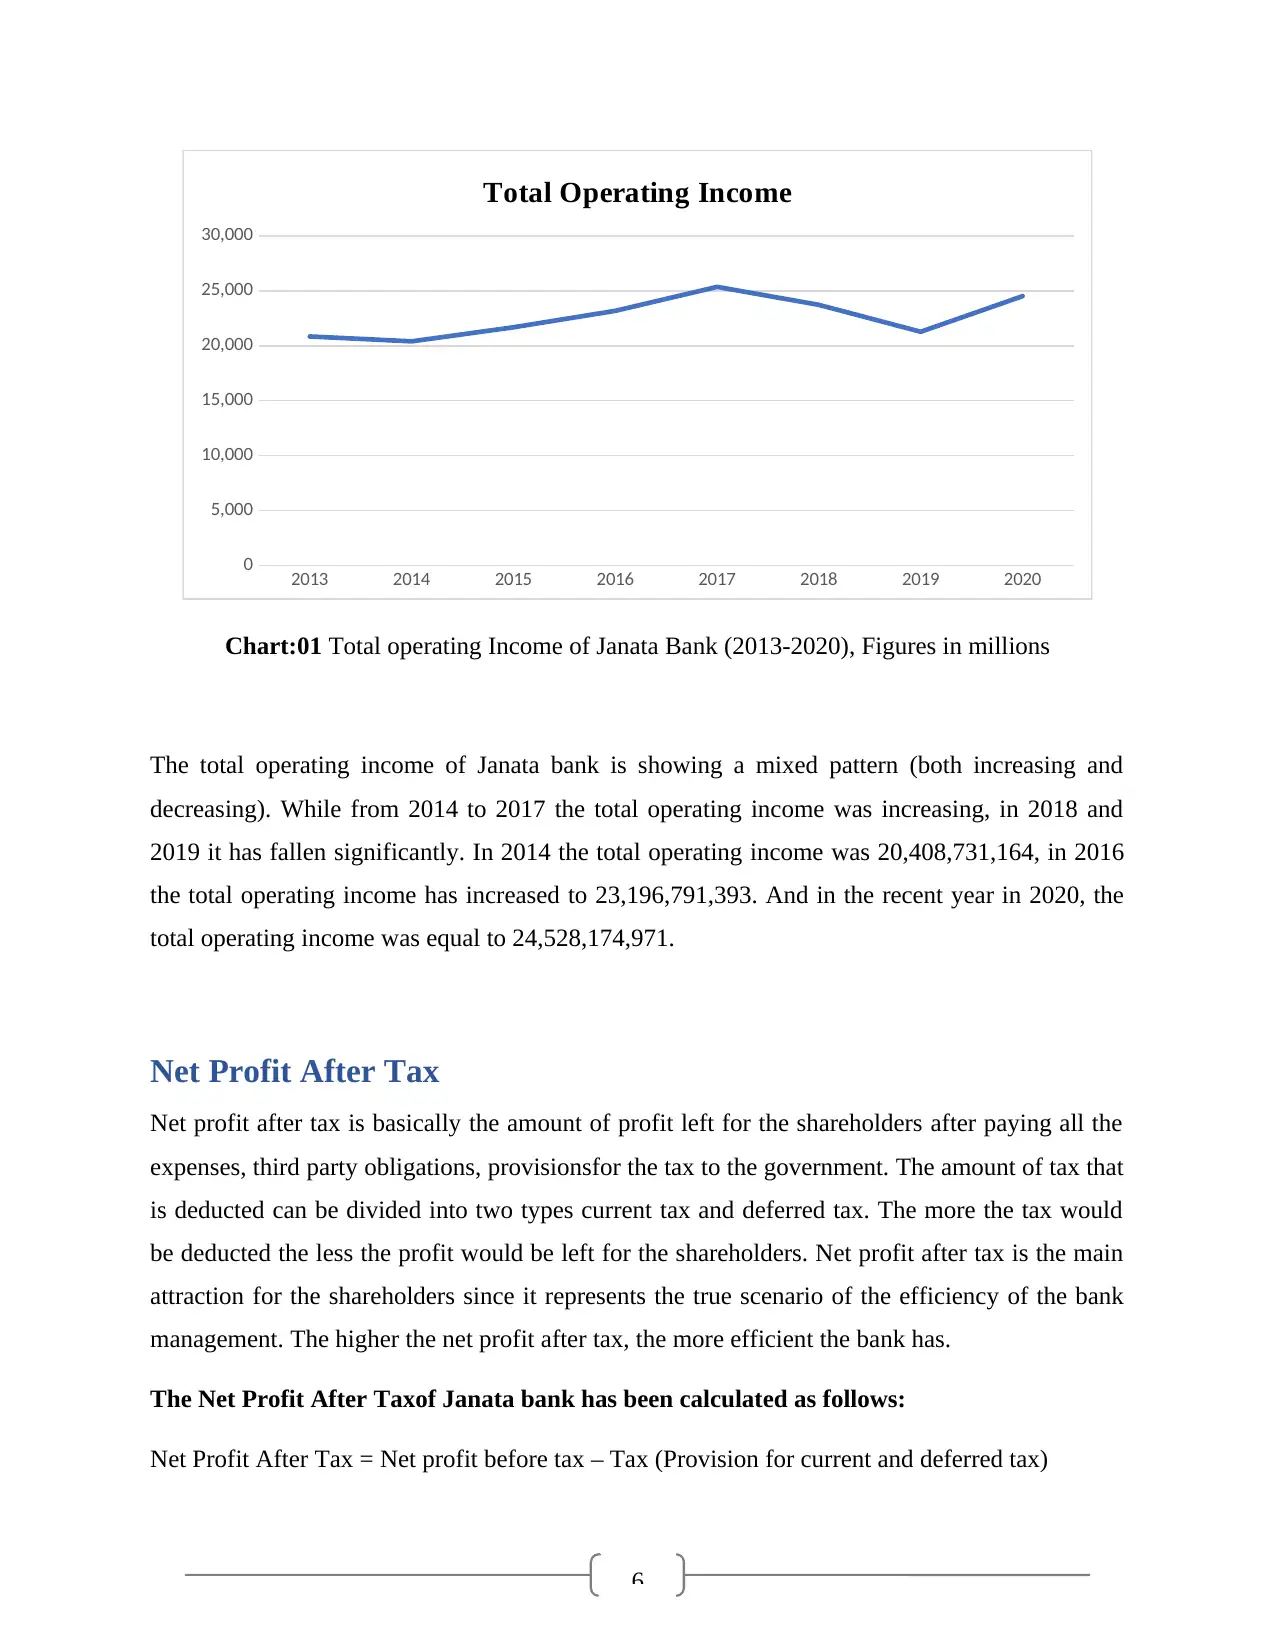
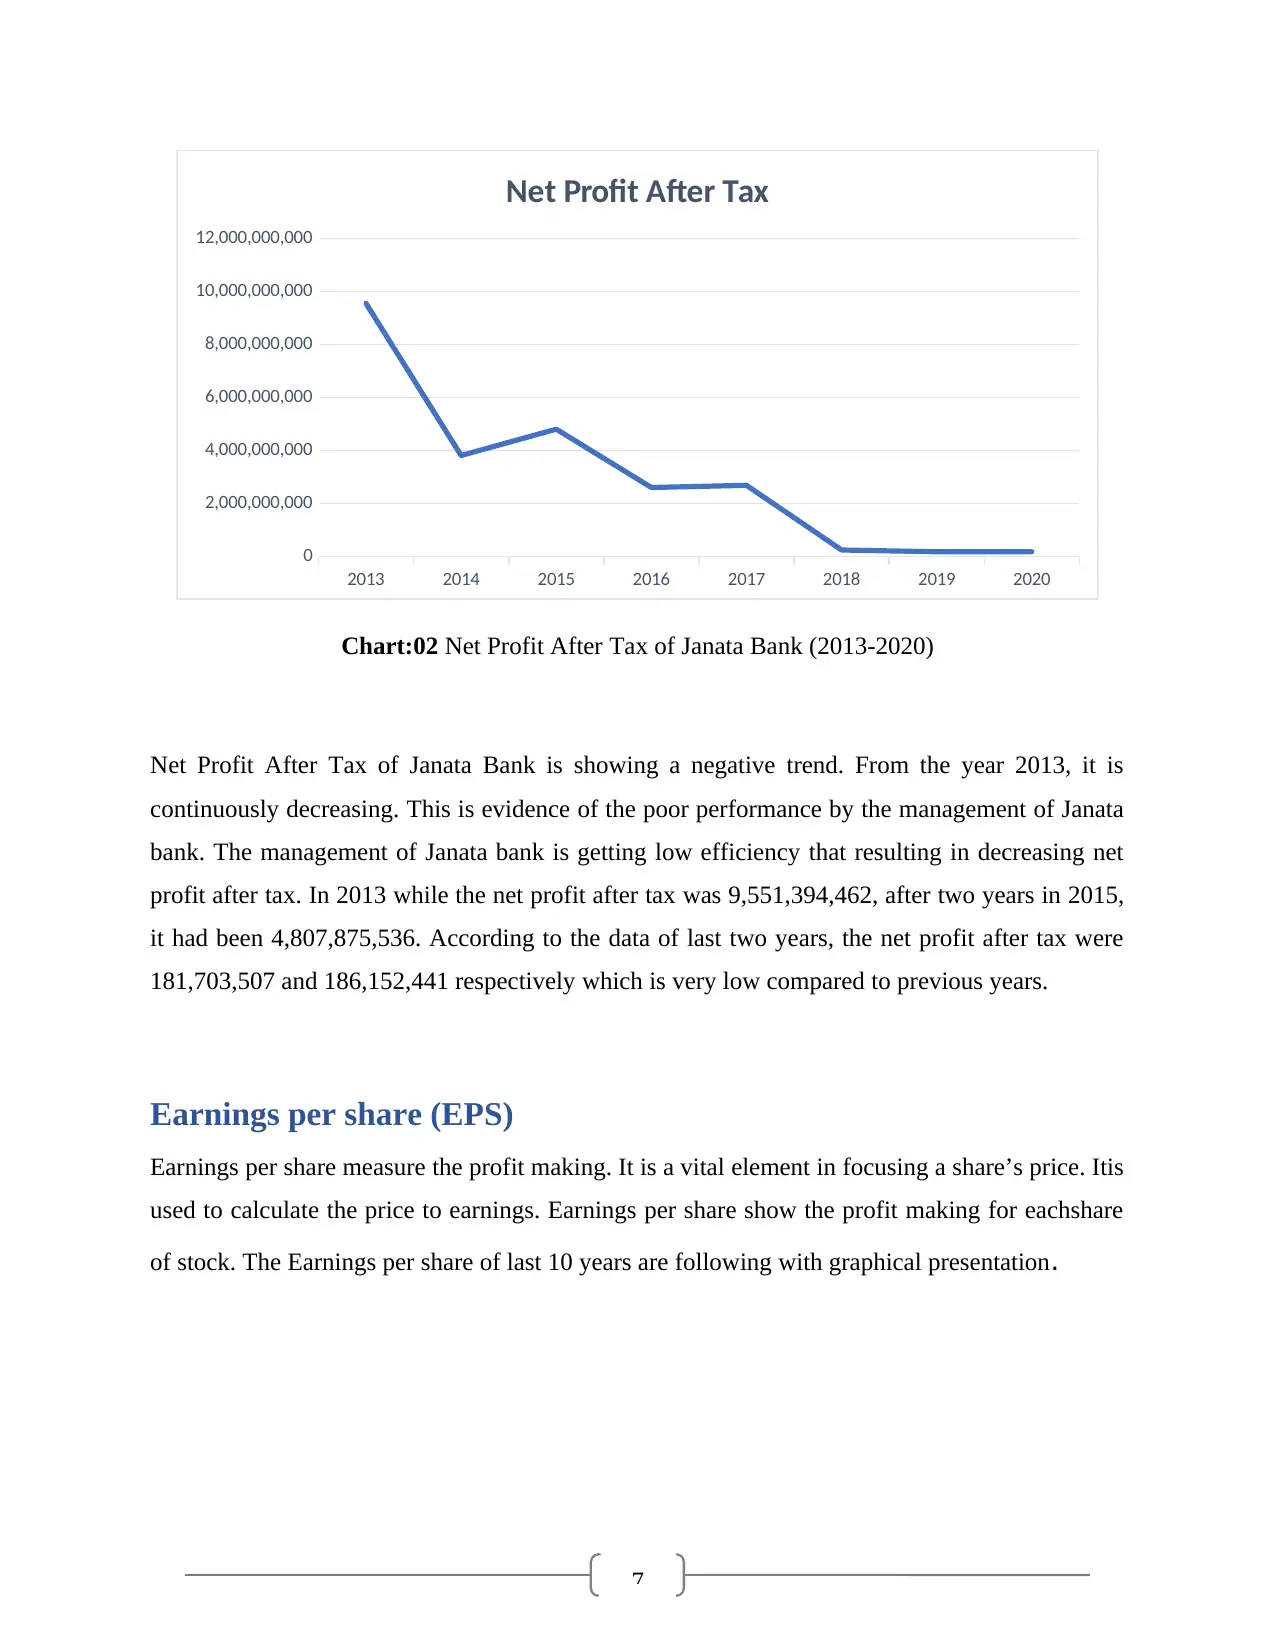
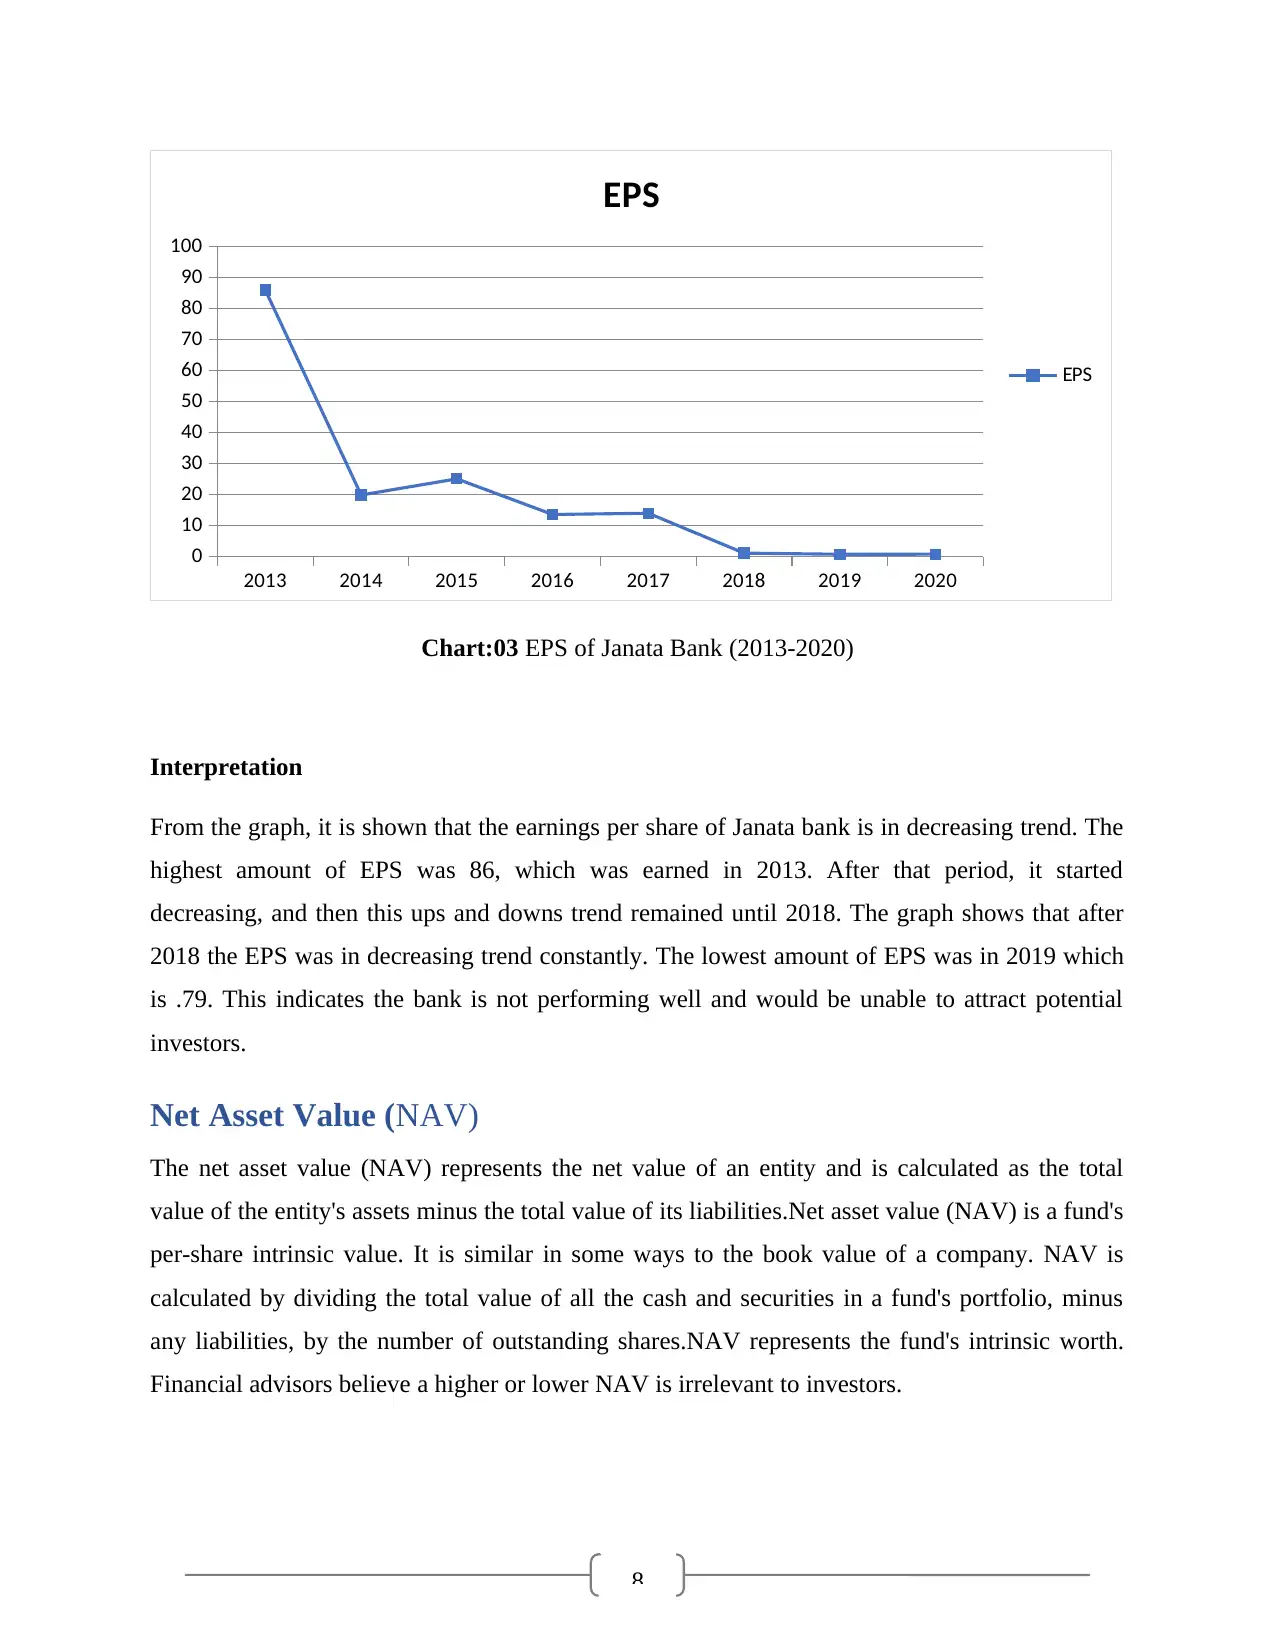
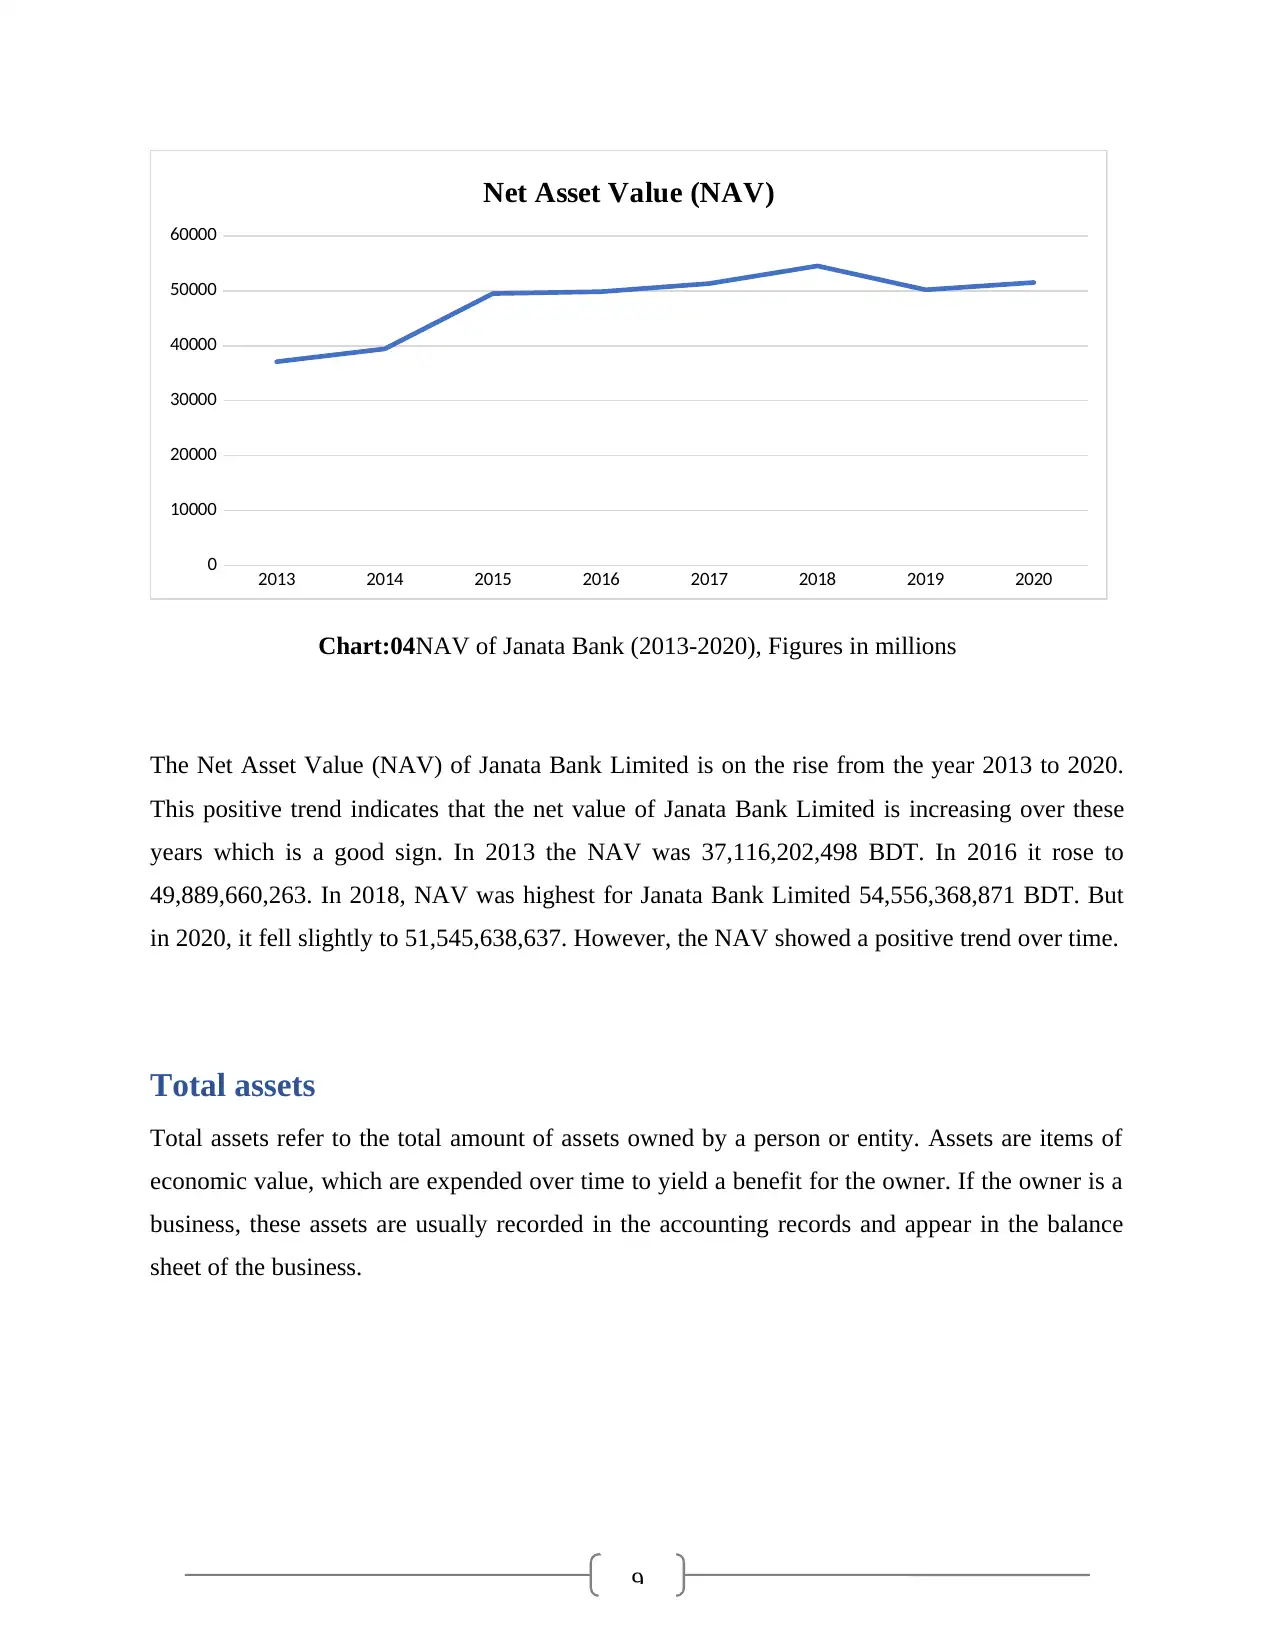
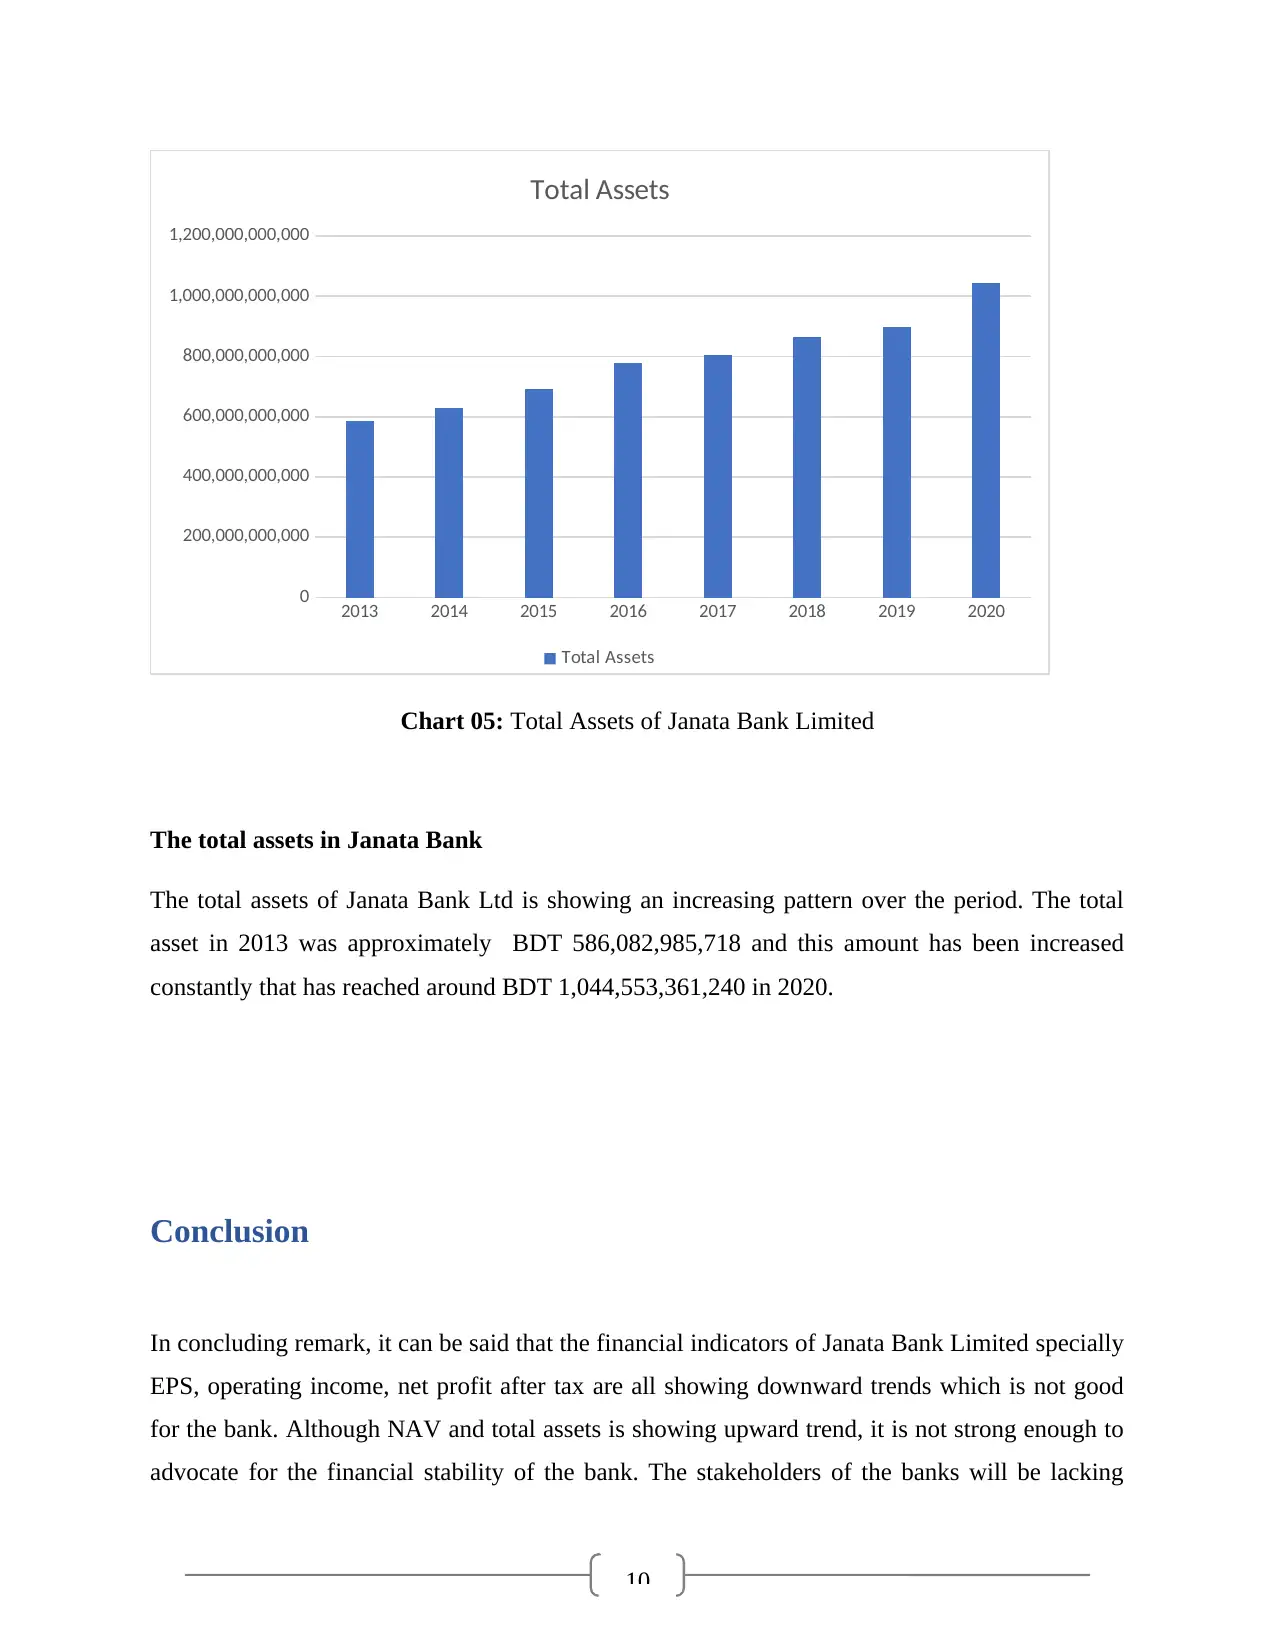
This term paper provides a comprehensive trend analysis of the financial statements of Janata Bank Limited from 2013 to 2020. The analysis, conducted for a Corporate Governance course at the University of Dhaka, examines key financial ratios including Total Operating Income, Net Income After Tax, Earnings per Share (EPS), Net Asset Value (NAV), and Total Assets. The study reveals a mixed performance, with Total Operating Income initially increasing but later decreasing. While the NAV and Total Assets show an upward trend, EPS and Net Profit After Tax exhibit a downward trend, indicating challenges in the bank's overall financial health and potential implications for stakeholders and investors. The report concludes that, despite some positive indicators, the bank's overall financial performance over the period was not strong.
Document Page
1
Trend analysis of financial statements of Janata Bank Limited
Term Paper
Course Name:Corporate Governance
Course code:B-520
Prepared By
NAME ID
Debashis Majumder 04
Farjana Akhter Keya 17
UrmiAkter 49
Rokonuzzaman 119
Department of Banking and Insurance
Batch-22nd
Major: Banking
Faculty of Business Studies
University of Dhaka
Prepared For
Mohammad Ariful Islam
AssociateProfessor
Department of Banking & Insurance
Faculty of Business Studies
University of Dhaka
Date of Submission: 02 March, 2022
Term Paper on Trend analysis of financial statements of Janata Bank Limited
tabler-icon-diamond-filled.svg

Paraphrase This Document

Need a fresh take? Get an instant paraphrase of this document with our AI Paraphraser
Document Page
2
EXECUTIVE SUMMERY
The study will involve evaluating the financial performance of Janata Bank Limited over
the last 10 years ranging from 2013 to 2020. Financial performance means to evaluate how
the company was performing over the previous years. The objectives will be achieved
through ratio analysis potentially such as ROE, ROA, Earnings per share, Payout ratio,
Debt ratio, Net interest margin, Net profit margin, Asset turnover and interest coverage
ratios of Janata Bank. Here in this report we have used five ratios to show how the Janata
Bank is performing over the previous years, which are total operating income, net income
after tax, total assets, net asset value and earnings per share. Trend analysis has been used
here to show the movements of those ratios over the last 10 years. Total operating income
was higher in 2017 after that period it was in decreasing trend. In 2020, it started
increasing again but earnings per share are in decreasing trend. The scenario is same in
case of net profit after tax; it was in decreasing trend from 2013 to 2020. From the analysis
it can be concluded that the overall performance of the Janata bank was not good over the
last 10 years. The NAV of Janata Bank showed an increasing trend over the years. Total
assets of Janata Bank Limited is also showing an upward trend.
Document Page
3
Table of Contents
Introduction......................................................................................................................................4
Data Analysis and Findings.............................................................................................................5
Total Operating Income...................................................................................................................5
Net Profit After Tax.........................................................................................................................6
Earnings per share (EPS).................................................................................................................7
Net Asset Value (NAV)...................................................................................................................8
Total assets.......................................................................................................................................9
Conclusion.....................................................................................................................................10
Appendix........................................................................................................................................11
Document Page
4
Introduction
Janata Bank runs its business with 915 branches across the country having a big family of around
11,463 (As on 31.07.2020) employees with its head office located at Janata Bhaban at Motijheel
C/A, the heart of the capital city, Dhaka.Janata Bank Limited, a corporate body trusted over the
years, the 2nd largest (in respect of Deposits/Assets) commercial bank in Bangladesh, has been
playing pivotal role in overall financial activities of the country and is possessing a long heritage
of discharging laudable services to the society since her embankment immediately after the
emergence of this verdant rich alluvial soil as a sovereign, independent state.
The trend analysis of financial statements of Janata Bank Limited implies that the bank is not in
a good state as its financial indicators are showing downward sloping trends.
tabler-icon-diamond-filled.svg

Paraphrase This Document

Need a fresh take? Get an instant paraphrase of this document with our AI Paraphraser
Document Page
5
Data Analysis and Findings
Total Operating Income
Operating Income refers to the summation of all the earnings coming from the operation of
general business or banking activities. The total operating income of a business shows how well
or how efficiently the business is running or performing by its management. Higher total
operating income denotes the more efficient operation by the management, and lower total
operating income denotes the less efficient operation by the management.
The total operating income of Janata bank has been calculated as follows:
Total operating Income = Net interest income (Interest income – Interest paid on deposit and
borrowings) + investment income + Commission, Exchange and Brokerage + Other Operating
Income
Document Page
6
2013 2014 2015 2016 2017 2018 2019 2020
0
5,000
10,000
15,000
20,000
25,000
30,000
Total Operating Income
Chart:01 Total operating Income of Janata Bank (2013-2020), Figures in millions
The total operating income of Janata bank is showing a mixed pattern (both increasing and
decreasing). While from 2014 to 2017 the total operating income was increasing, in 2018 and
2019 it has fallen significantly. In 2014 the total operating income was 20,408,731,164, in 2016
the total operating income has increased to 23,196,791,393. And in the recent year in 2020, the
total operating income was equal to 24,528,174,971.
Net Profit After Tax
Net profit after tax is basically the amount of profit left for the shareholders after paying all the
expenses, third party obligations, provisionsfor the tax to the government. The amount of tax that
is deducted can be divided into two types current tax and deferred tax. The more the tax would
be deducted the less the profit would be left for the shareholders. Net profit after tax is the main
attraction for the shareholders since it represents the true scenario of the efficiency of the bank
management. The higher the net profit after tax, the more efficient the bank has.
The Net Profit After Taxof Janata bank has been calculated as follows:
Net Profit After Tax = Net profit before tax – Tax (Provision for current and deferred tax)
Document Page
7
2013 2014 2015 2016 2017 2018 2019 2020
0
2,000,000,000
4,000,000,000
6,000,000,000
8,000,000,000
10,000,000,000
12,000,000,000
Net Profit After Tax
Chart:02 Net Profit After Tax of Janata Bank (2013-2020)
Net Profit After Tax of Janata Bank is showing a negative trend. From the year 2013, it is
continuously decreasing. This is evidence of the poor performance by the management of Janata
bank. The management of Janata bank is getting low efficiency that resulting in decreasing net
profit after tax. In 2013 while the net profit after tax was 9,551,394,462, after two years in 2015,
it had been 4,807,875,536. According to the data of last two years, the net profit after tax were
181,703,507 and 186,152,441 respectively which is very low compared to previous years.
Earnings per share (EPS)
Earnings per share measure the profit making. It is a vital element in focusing a share’s price. Itis
used to calculate the price to earnings. Earnings per share show the profit making for eachshare
of stock. The Earnings per share of last 10 years are following with graphical presentation.
tabler-icon-diamond-filled.svg

Paraphrase This Document

Need a fresh take? Get an instant paraphrase of this document with our AI Paraphraser
Document Page
8
2013 2014 2015 2016 2017 2018 2019 2020
0
10
20
30
40
50
60
70
80
90
100
EPS
EPS
Chart:03 EPS of Janata Bank (2013-2020)
Interpretation
From the graph, it is shown that the earnings per share of Janata bank is in decreasing trend. The
highest amount of EPS was 86, which was earned in 2013. After that period, it started
decreasing, and then this ups and downs trend remained until 2018. The graph shows that after
2018 the EPS was in decreasing trend constantly. The lowest amount of EPS was in 2019 which
is .79. This indicates the bank is not performing well and would be unable to attract potential
investors.
Net Asset Value (NAV)
The net asset value (NAV) represents the net value of an entity and is calculated as the total
value of the entity's assets minus the total value of its liabilities.Net asset value (NAV) is a fund's
per-share intrinsic value. It is similar in some ways to the book value of a company. NAV is
calculated by dividing the total value of all the cash and securities in a fund's portfolio, minus
any liabilities, by the number of outstanding shares.NAV represents the fund's intrinsic worth.
Financial advisors believe a higher or lower NAV is irrelevant to investors.
Document Page
9
2013 2014 2015 2016 2017 2018 2019 2020
0
10000
20000
30000
40000
50000
60000
Net Asset Value (NAV)
Chart:04NAV of Janata Bank (2013-2020), Figures in millions
The Net Asset Value (NAV) of Janata Bank Limited is on the rise from the year 2013 to 2020.
This positive trend indicates that the net value of Janata Bank Limited is increasing over these
years which is a good sign. In 2013 the NAV was 37,116,202,498 BDT. In 2016 it rose to
49,889,660,263. In 2018, NAV was highest for Janata Bank Limited 54,556,368,871 BDT. But
in 2020, it fell slightly to 51,545,638,637. However, the NAV showed a positive trend over time.
Total assets
Total assets refer to the total amount of assets owned by a person or entity. Assets are items of
economic value, which are expended over time to yield a benefit for the owner. If the owner is a
business, these assets are usually recorded in the accounting records and appear in the balance
sheet of the business.
Document Page
10
2013 2014 2015 2016 2017 2018 2019 2020
0
200,000,000,000
400,000,000,000
600,000,000,000
800,000,000,000
1,000,000,000,000
1,200,000,000,000
Total Assets
Total Assets
Chart 05: Total Assets of Janata Bank Limited
The total assets in Janata Bank
The total assets of Janata Bank Ltd is showing an increasing pattern over the period. The total
asset in 2013 was approximately BDT 586,082,985,718 and this amount has been increased
constantly that has reached around BDT 1,044,553,361,240 in 2020.
Conclusion
In concluding remark, it can be said that the financial indicators of Janata Bank Limited specially
EPS, operating income, net profit after tax are all showing downward trends which is not good
for the bank. Although NAV and total assets is showing upward trend, it is not strong enough to
advocate for the financial stability of the bank. The stakeholders of the banks will be lacking
tabler-icon-diamond-filled.svg

Paraphrase This Document

Need a fresh take? Get an instant paraphrase of this document with our AI Paraphraser
Document Page
11
trust on the bank due to poor financial indicators. The investors will lose their trust in Janata
Bank Limited and the bank will face difficulties in raising capital either by issuing common
shares or by issuing debt instruments.
chevron_up_icon
1 out of 11
circle_padding
hide_on_mobile
zoom_out_icon
[object Object]