BA 452: Detailed Financial & Strategic Analysis Report on Trina Solar

Verified

Added on  2023/06/13

|6
|719
|452
Report
AI Summary
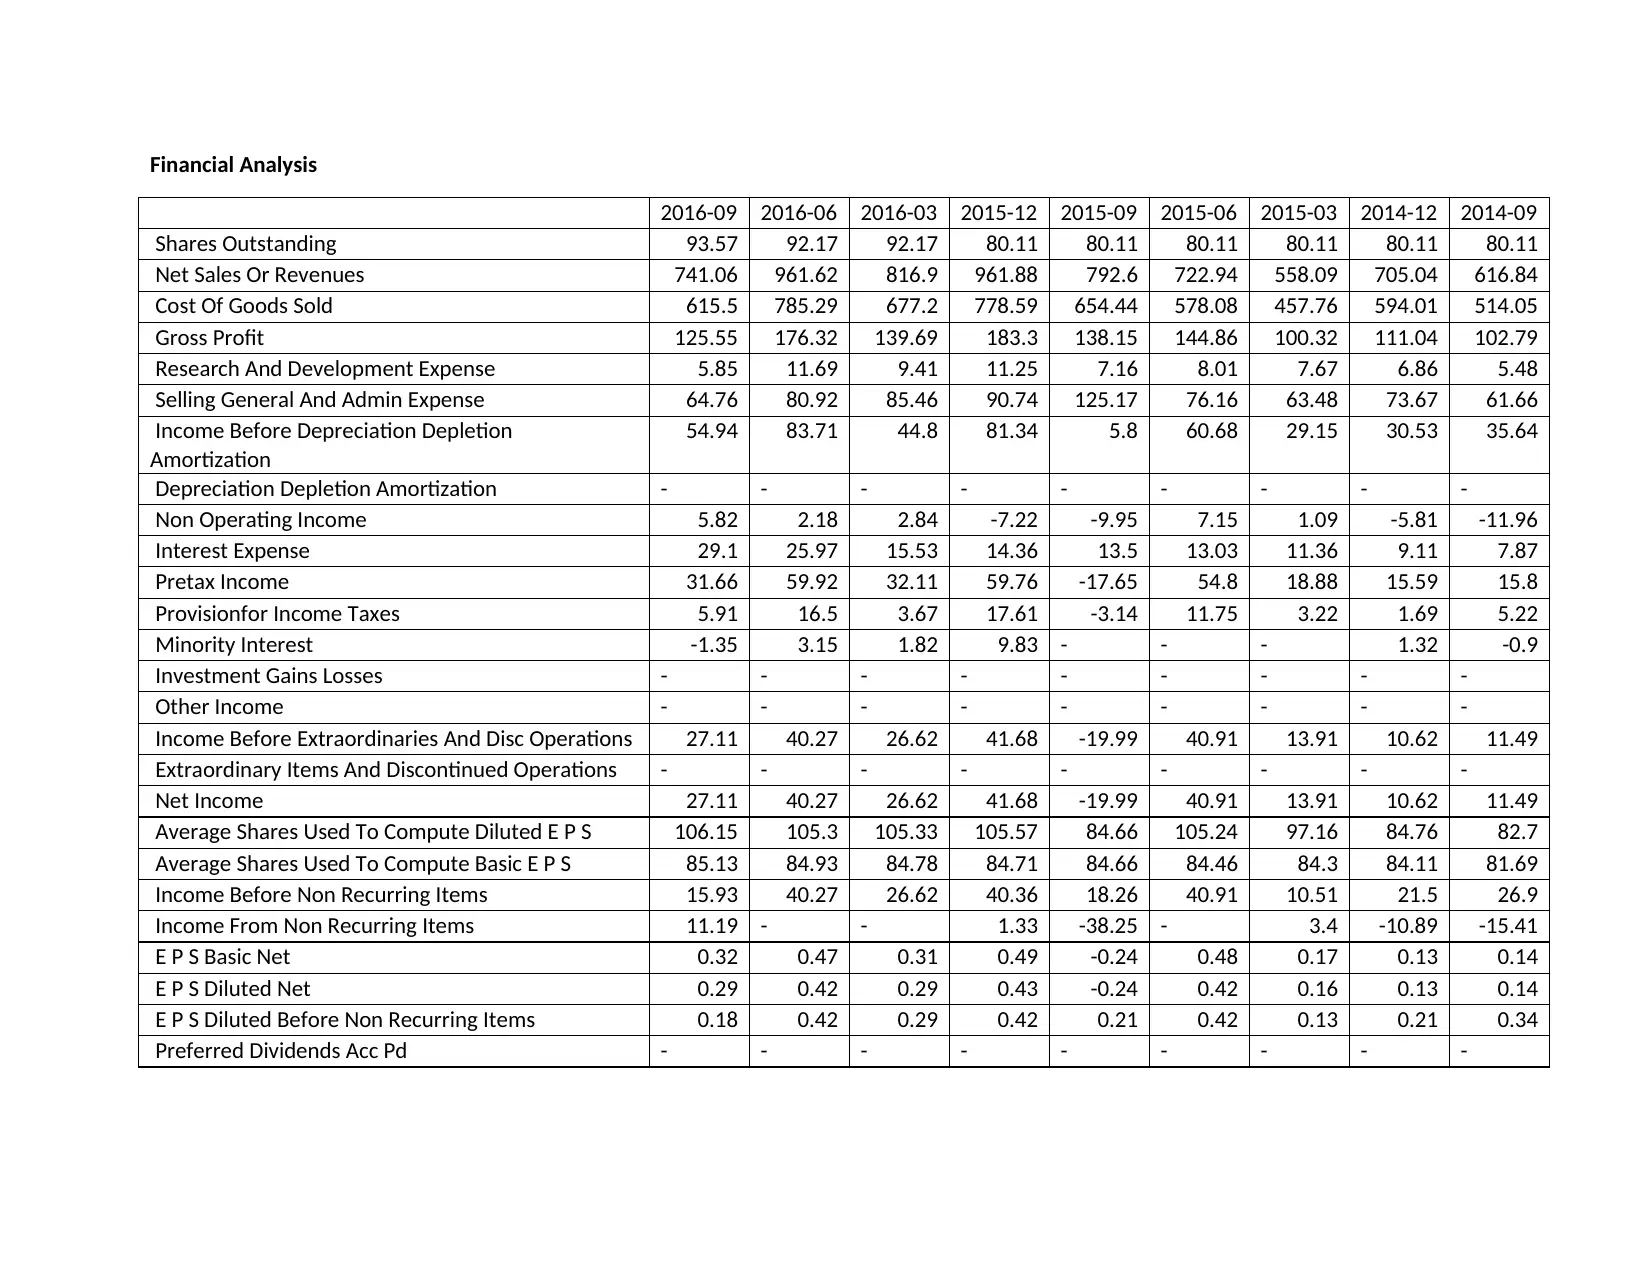
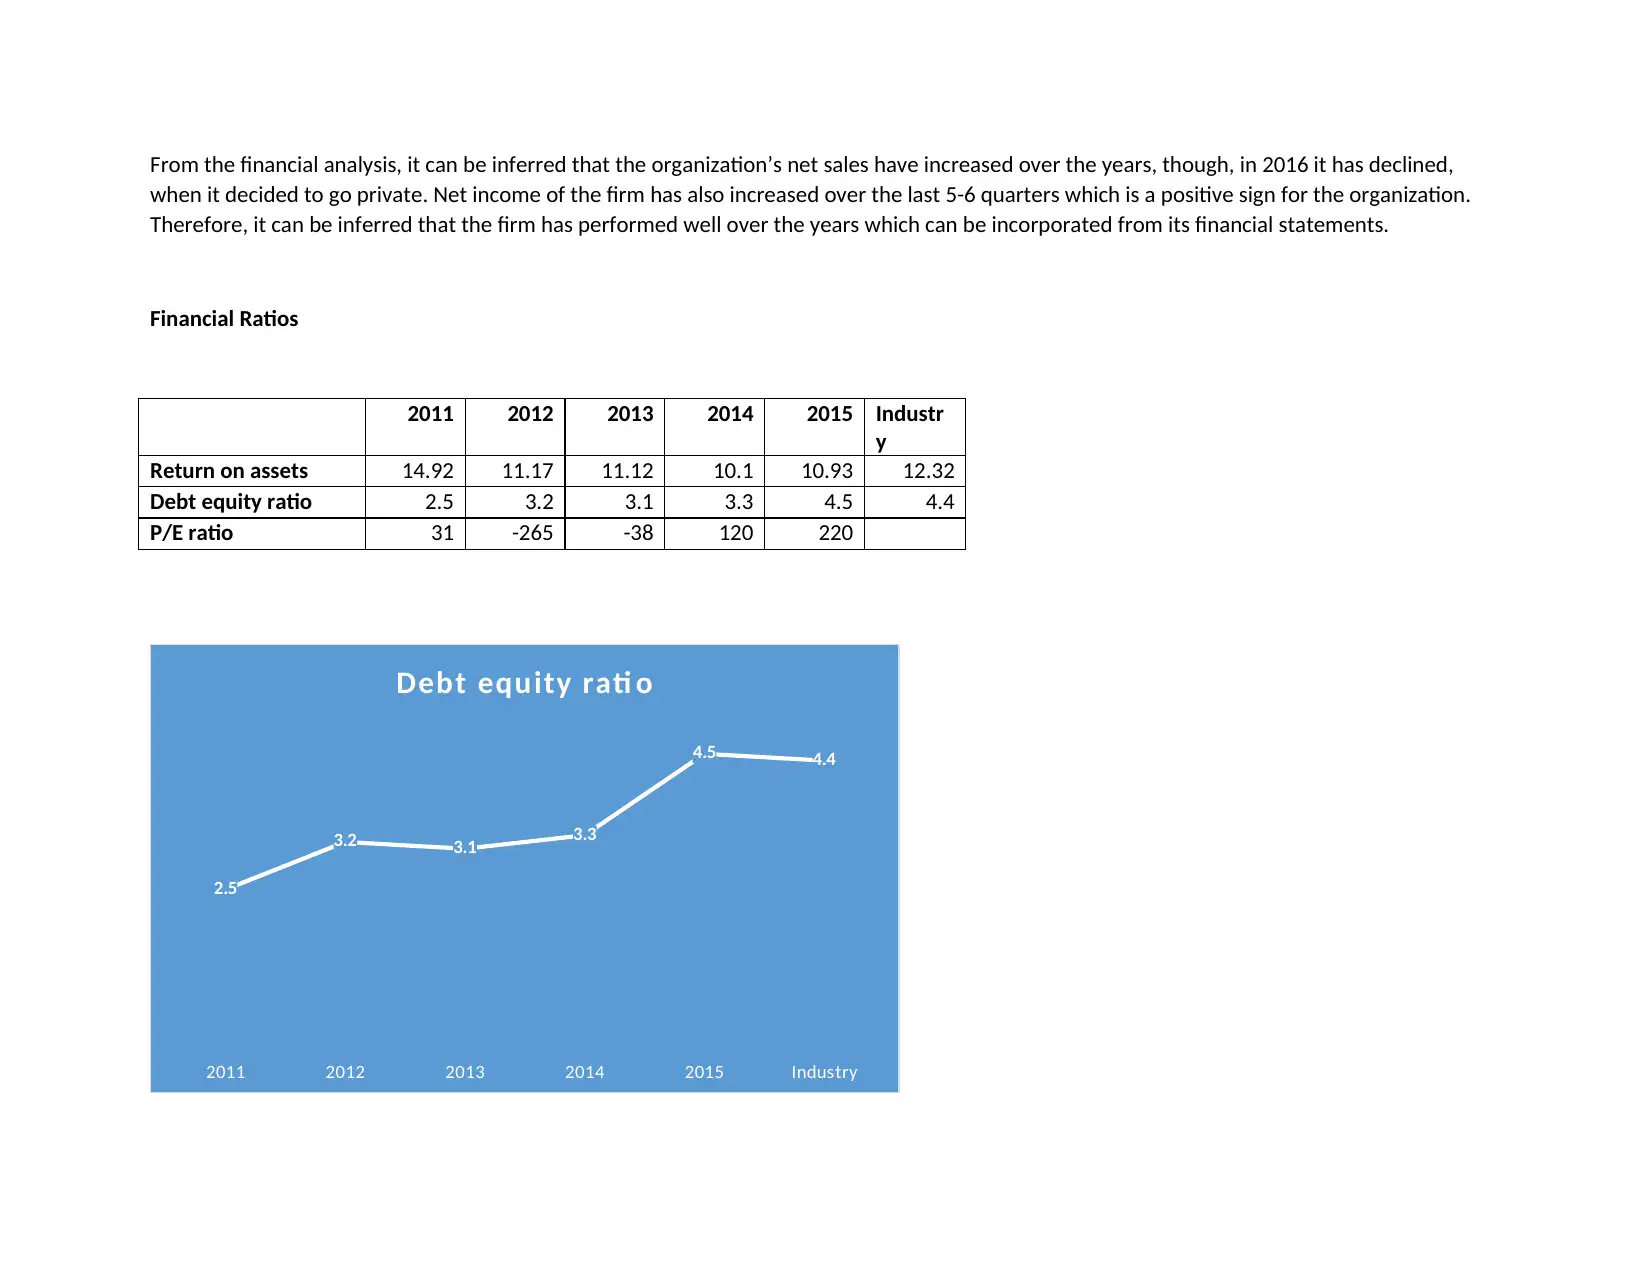
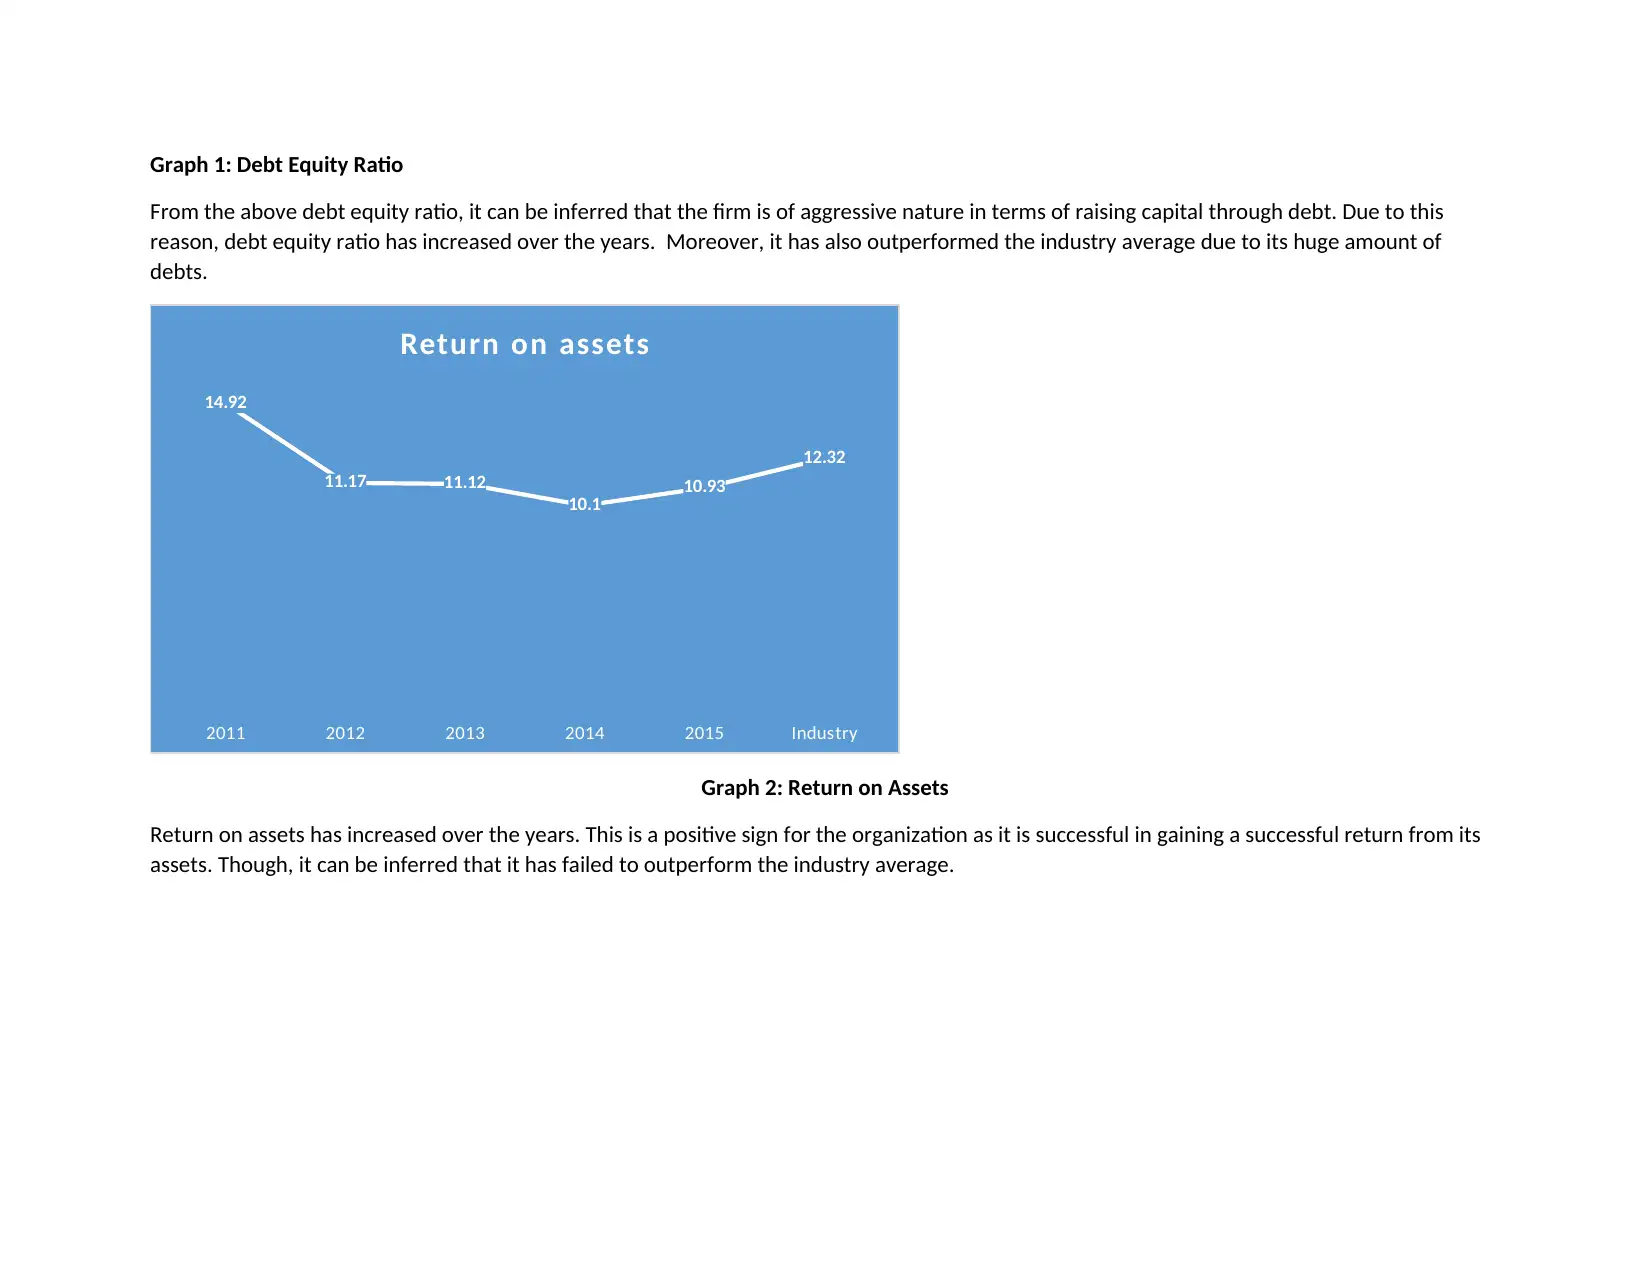
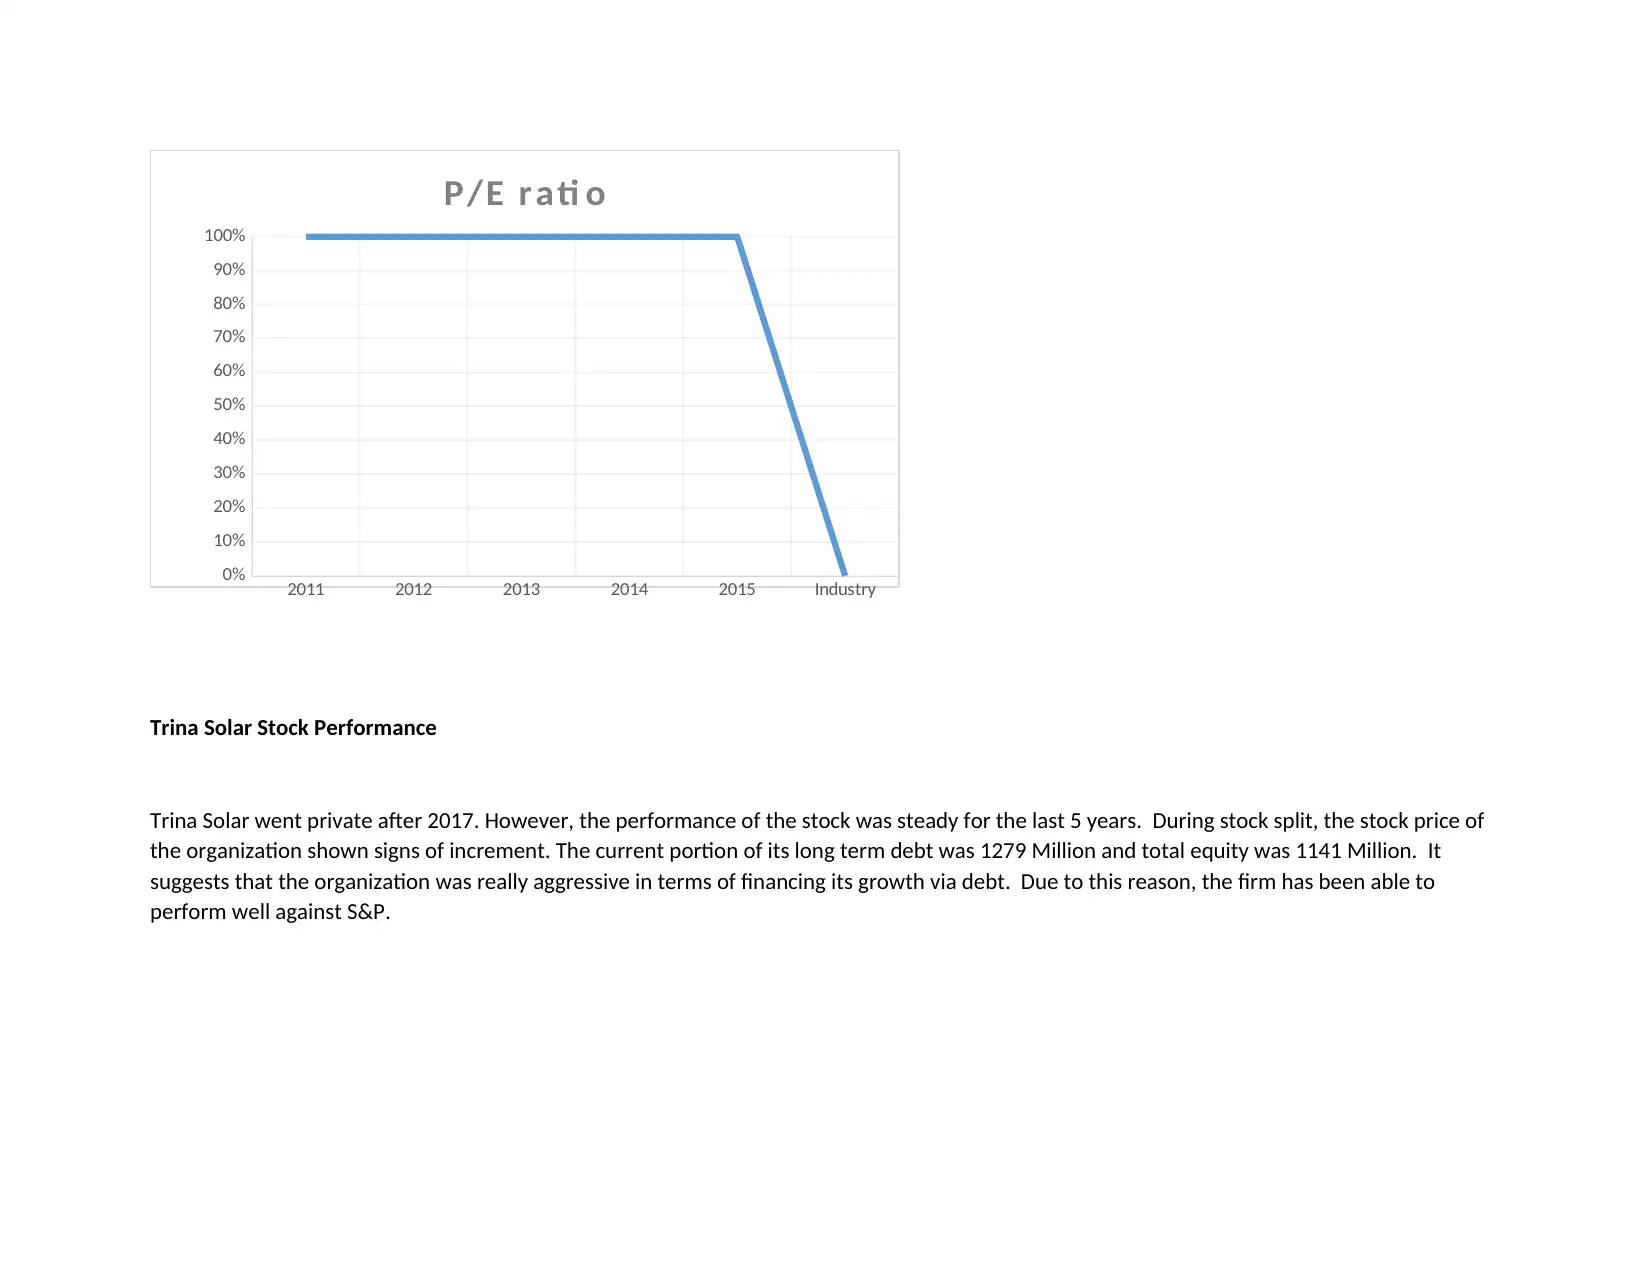
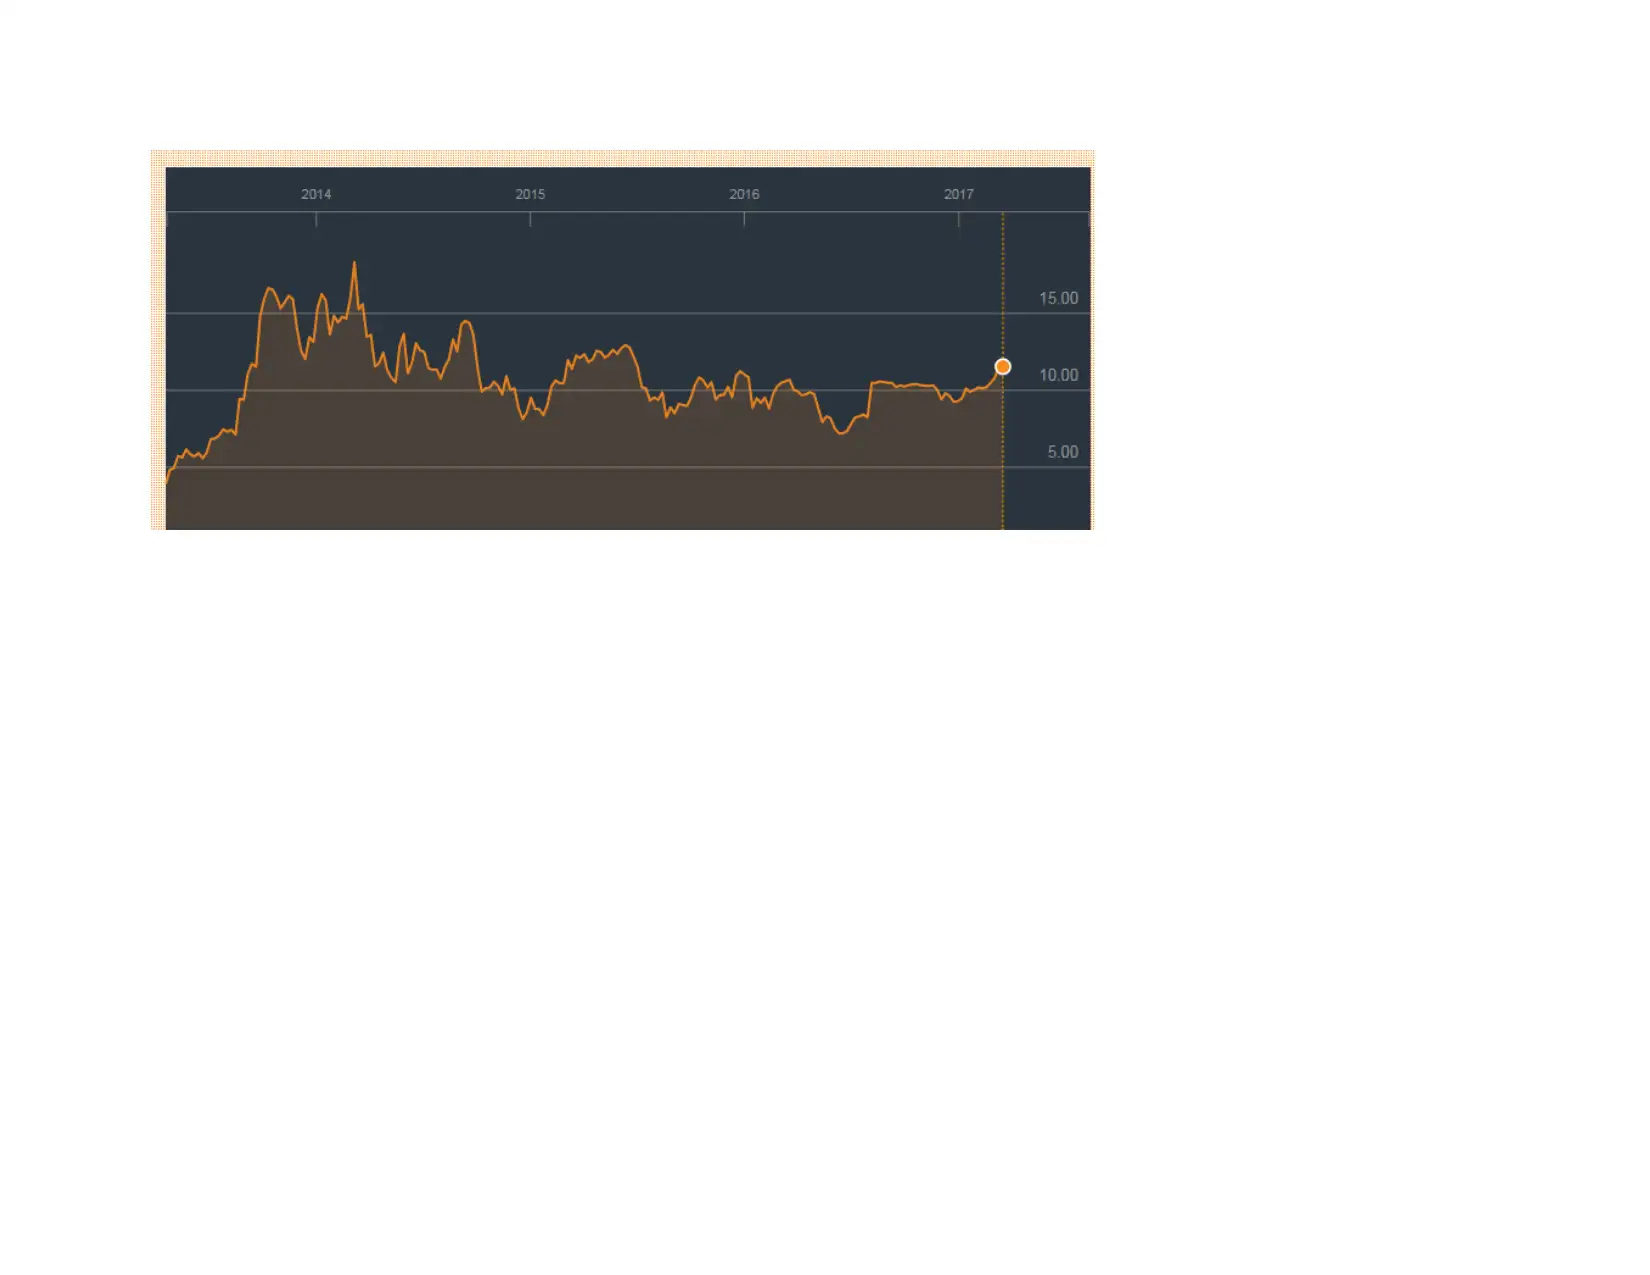
This report presents a financial analysis of Trina Solar, examining its financial statements, key financial ratios, and strategic performance. The analysis includes an assessment of net sales, net income, debt equity ratio, and return on assets over several years. It also incorporates a PESTEL analysis to evaluate the external environment. The report infers that Trina Solar experienced increased net sales and net income over the years, although there was a decline in 2016. The debt equity ratio indicates an aggressive approach to raising capital through debt, outperforming the industry average. Return on assets also increased, reflecting successful returns from assets, though it did not outperform the industry average. The report concludes that Trina Solar's stock performance was steady, with the company going private after 2017, and highlights the firm's aggressive financing strategy via debt.
Document Page
Financial Analysis
2016-09 2016-06 2016-03 2015-12 2015-09 2015-06 2015-03 2014-12 2014-09
Shares Outstanding 93.57 92.17 92.17 80.11 80.11 80.11 80.11 80.11 80.11
Net Sales Or Revenues 741.06 961.62 816.9 961.88 792.6 722.94 558.09 705.04 616.84
Cost Of Goods Sold 615.5 785.29 677.2 778.59 654.44 578.08 457.76 594.01 514.05
Gross Profit 125.55 176.32 139.69 183.3 138.15 144.86 100.32 111.04 102.79
Research And Development Expense 5.85 11.69 9.41 11.25 7.16 8.01 7.67 6.86 5.48
Selling General And Admin Expense 64.76 80.92 85.46 90.74 125.17 76.16 63.48 73.67 61.66
Income Before Depreciation Depletion
Amortization
54.94 83.71 44.8 81.34 5.8 60.68 29.15 30.53 35.64
Depreciation Depletion Amortization - - - - - - - - -
Non Operating Income 5.82 2.18 2.84 -7.22 -9.95 7.15 1.09 -5.81 -11.96
Interest Expense 29.1 25.97 15.53 14.36 13.5 13.03 11.36 9.11 7.87
Pretax Income 31.66 59.92 32.11 59.76 -17.65 54.8 18.88 15.59 15.8
Provisionfor Income Taxes 5.91 16.5 3.67 17.61 -3.14 11.75 3.22 1.69 5.22
Minority Interest -1.35 3.15 1.82 9.83 - - - 1.32 -0.9
Investment Gains Losses - - - - - - - - -
Other Income - - - - - - - - -
Income Before Extraordinaries And Disc Operations 27.11 40.27 26.62 41.68 -19.99 40.91 13.91 10.62 11.49
Extraordinary Items And Discontinued Operations - - - - - - - - -
Net Income 27.11 40.27 26.62 41.68 -19.99 40.91 13.91 10.62 11.49
Average Shares Used To Compute Diluted E P S 106.15 105.3 105.33 105.57 84.66 105.24 97.16 84.76 82.7
Average Shares Used To Compute Basic E P S 85.13 84.93 84.78 84.71 84.66 84.46 84.3 84.11 81.69
Income Before Non Recurring Items 15.93 40.27 26.62 40.36 18.26 40.91 10.51 21.5 26.9
Income From Non Recurring Items 11.19 - - 1.33 -38.25 - 3.4 -10.89 -15.41
E P S Basic Net 0.32 0.47 0.31 0.49 -0.24 0.48 0.17 0.13 0.14
E P S Diluted Net 0.29 0.42 0.29 0.43 -0.24 0.42 0.16 0.13 0.14
E P S Diluted Before Non Recurring Items 0.18 0.42 0.29 0.42 0.21 0.42 0.13 0.21 0.34
Preferred Dividends Acc Pd - - - - - - - - -
tabler-icon-diamond-filled.svg

Paraphrase This Document

Need a fresh take? Get an instant paraphrase of this document with our AI Paraphraser
Document Page
From the financial analysis, it can be inferred that the organization’s net sales have increased over the years, though, in 2016 it has declined,
when it decided to go private. Net income of the firm has also increased over the last 5-6 quarters which is a positive sign for the organization.
Therefore, it can be inferred that the firm has performed well over the years which can be incorporated from its financial statements.
Financial Ratios
2011 2012 2013 2014 2015 Industr
y
Return on assets 14.92 11.17 11.12 10.1 10.93 12.32
Debt equity ratio 2.5 3.2 3.1 3.3 4.5 4.4
P/E ratio 31 -265 -38 120 220
2011 2012 2013 2014 2015 Industry
2.5
3.2 3.1 3.3
4.5 4.4
Debt equity rati o
Document Page
Graph 1: Debt Equity Ratio
From the above debt equity ratio, it can be inferred that the firm is of aggressive nature in terms of raising capital through debt. Due to this
reason, debt equity ratio has increased over the years. Moreover, it has also outperformed the industry average due to its huge amount of
debts.
2011 2012 2013 2014 2015 Industry
14.92
11.17 11.12
10.1 10.93
12.32
Return on assets
Graph 2: Return on Assets
Return on assets has increased over the years. This is a positive sign for the organization as it is successful in gaining a successful return from its
assets. Though, it can be inferred that it has failed to outperform the industry average.
Document Page
2011 2012 2013 2014 2015 Industry
0%
10%
20%
30%
40%
50%
60%
70%
80%
90%
100%
P/E rati o
Trina Solar Stock Performance
Trina Solar went private after 2017. However, the performance of the stock was steady for the last 5 years. During stock split, the stock price of
the organization shown signs of increment. The current portion of its long term debt was 1279 Million and total equity was 1141 Million. It
suggests that the organization was really aggressive in terms of financing its growth via debt. Due to this reason, the firm has been able to
perform well against S&P.
tabler-icon-diamond-filled.svg

Paraphrase This Document

Need a fresh take? Get an instant paraphrase of this document with our AI Paraphraser
Document Page
Document Page
chevron_up_icon
1 out of 6
circle_padding
hide_on_mobile
zoom_out_icon
[object Object]