Statistics Assignment: Analyzing Hotel Review Data from TripAdvisor

Verified

Added on  2023/04/21

|7
|1102
|153
Homework Assignment
AI Summary
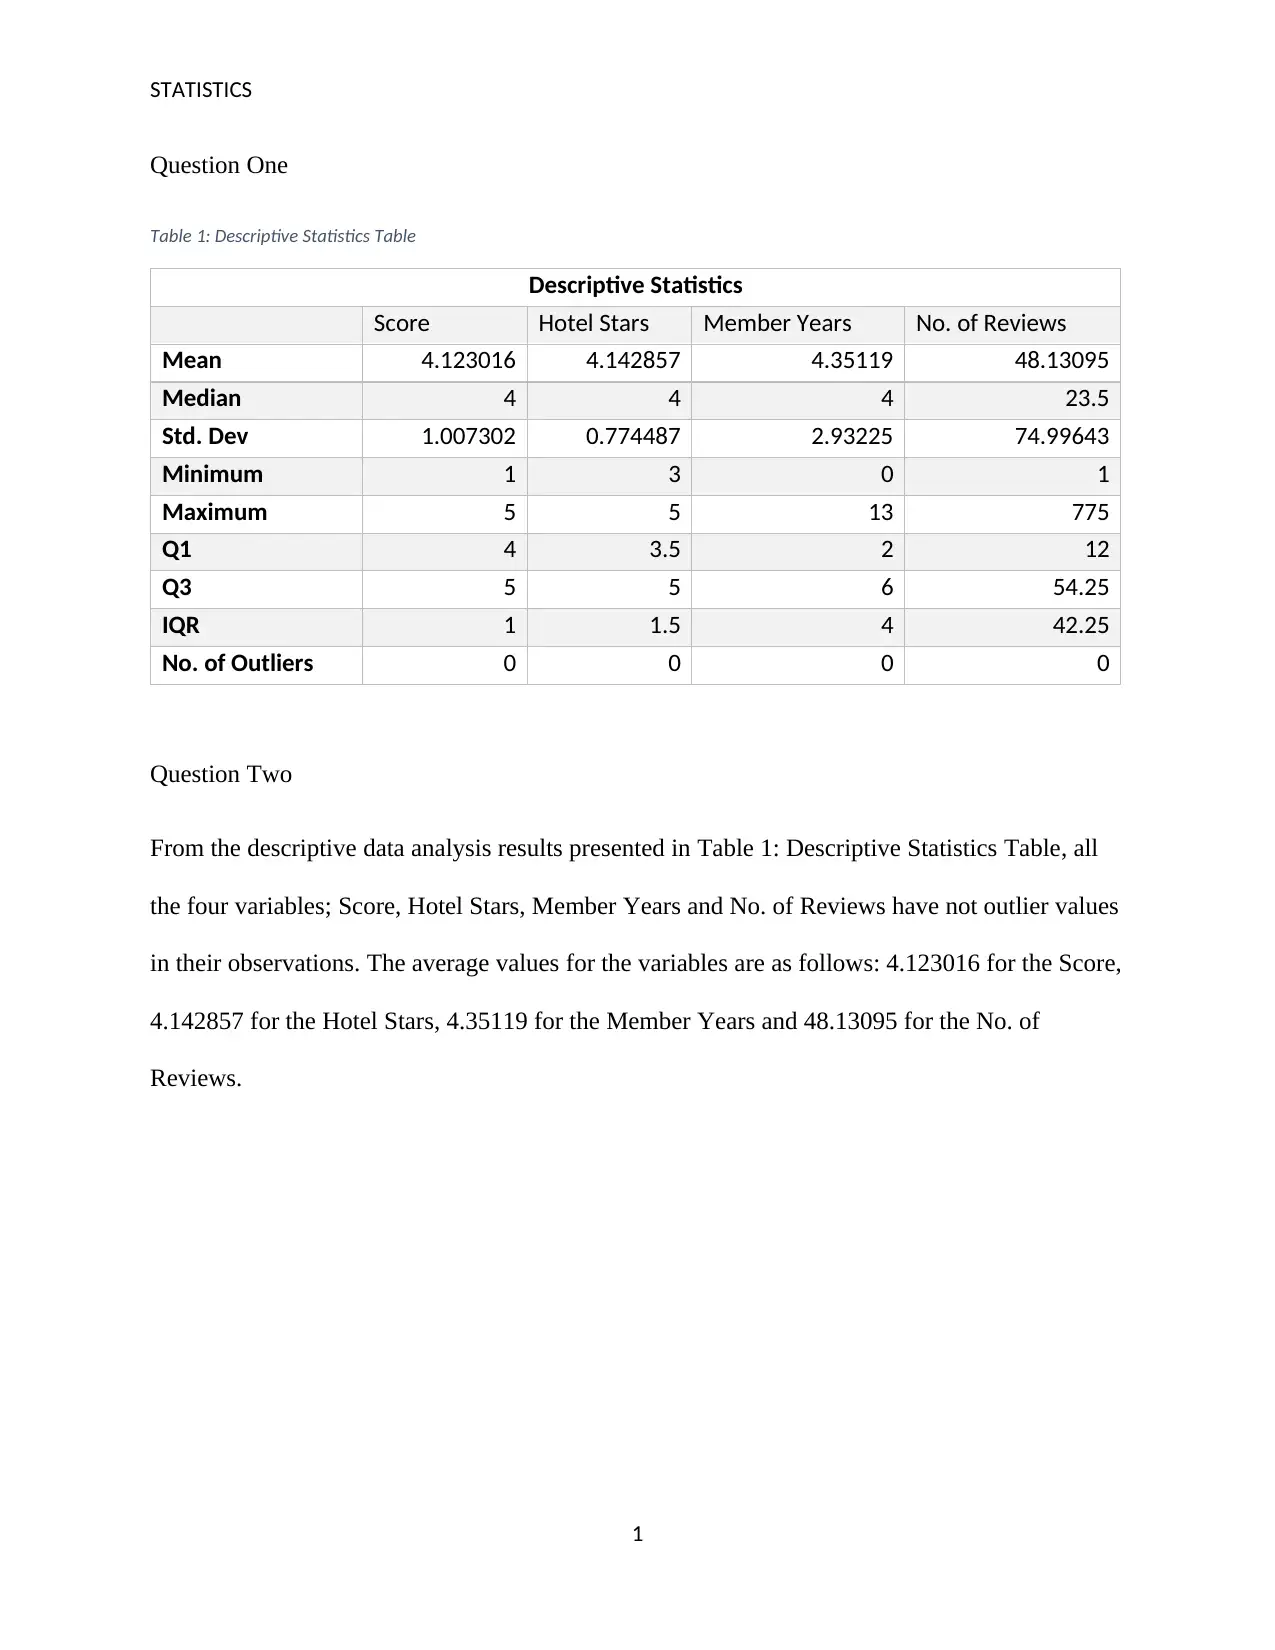
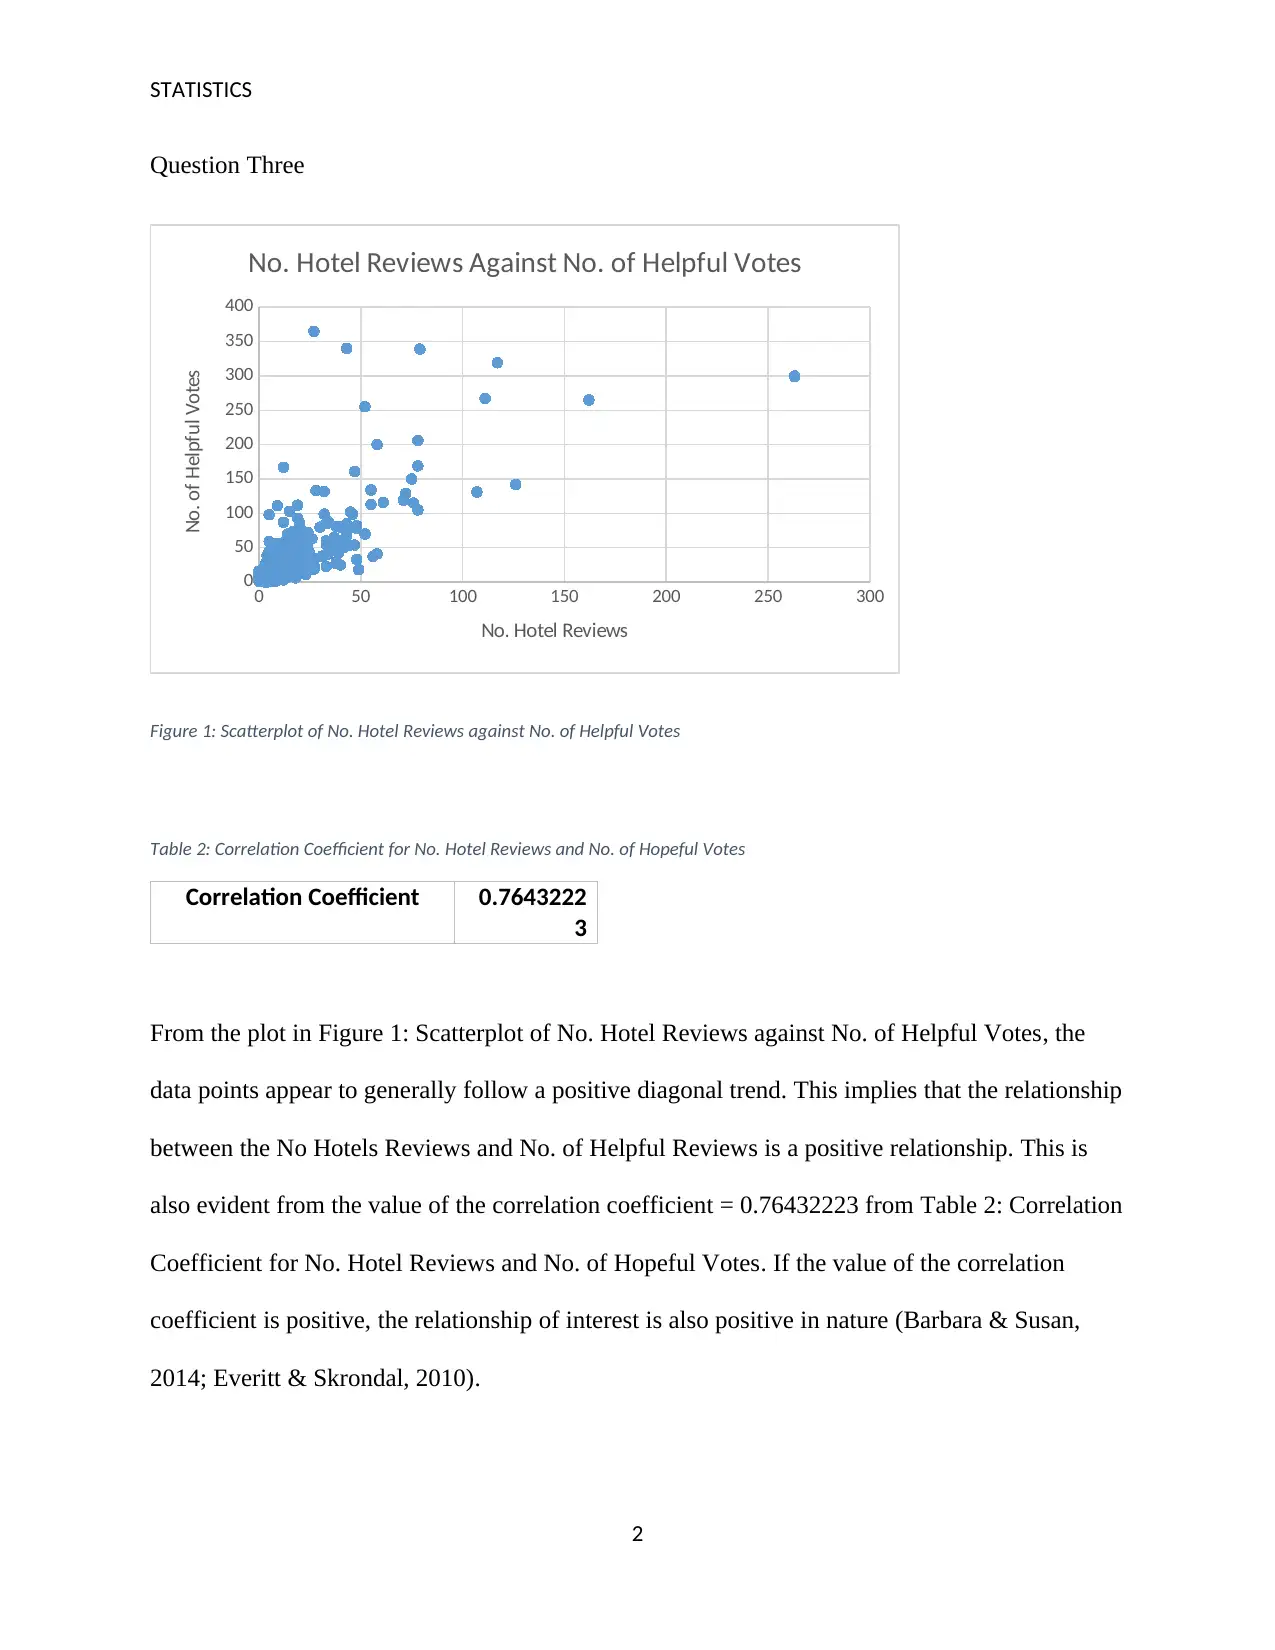
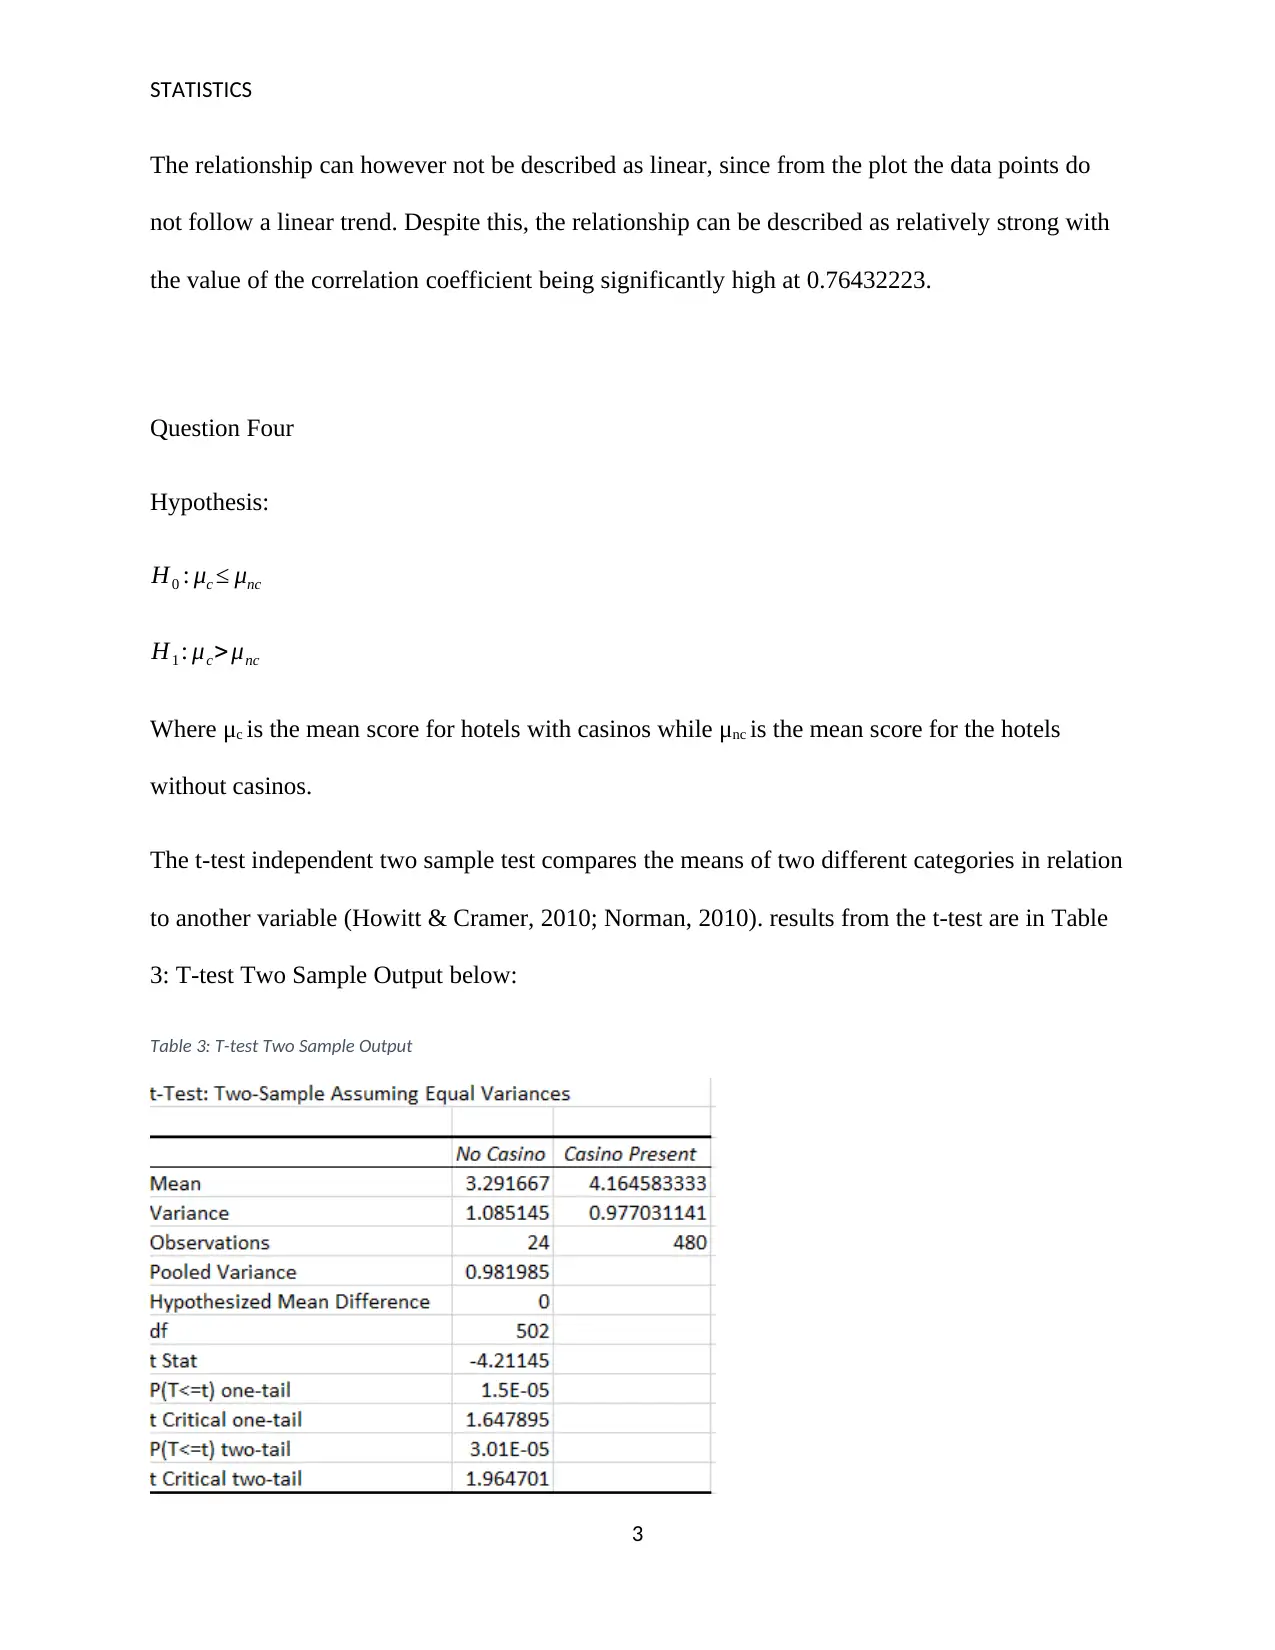
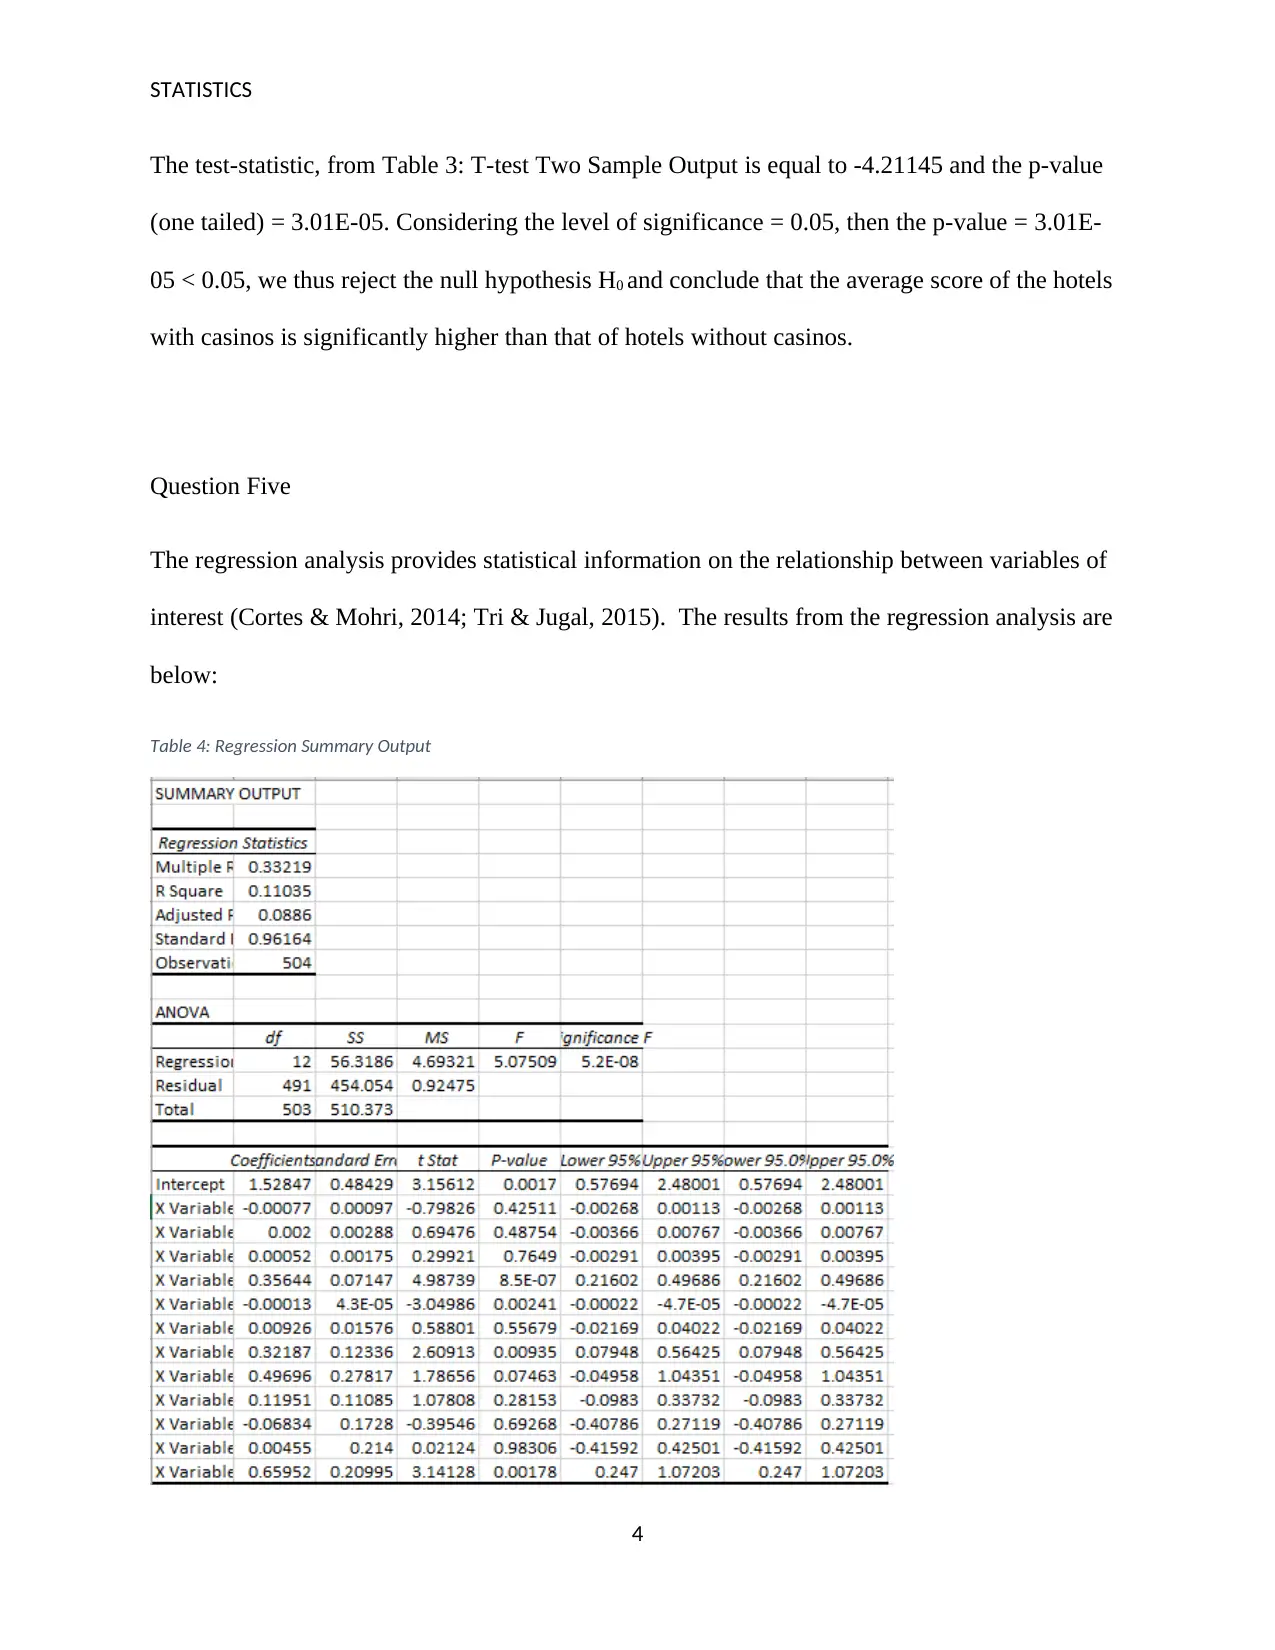
This statistics assignment analyzes a dataset of TripAdvisor hotel reviews, focusing on predicting hotel scores based on various factors. The analysis begins with descriptive statistics, including mean, median, standard deviation, and outlier identification for variables like score, hotel stars, member years, and the number of reviews. A scatterplot and correlation analysis explore the relationship between the number of hotel reviews and helpful votes, revealing a positive correlation. Furthermore, the assignment utilizes a t-test to compare the average scores of hotels with and without casinos, leading to the rejection of the null hypothesis. Regression analysis is then employed to determine the impact of variables such as number of reviews, hotel stars, and helpful votes on the score, with the regression model explaining a small percentage of the variance. Finally, logistic regression is used to analyze the data, examining the relationship between the variables, such as number of rooms and casino presence, and the score, providing insights into how these factors influence hotel ratings.
tabler-icon-diamond-filled.svg

Contribute Materials

Your contribution can guide someone’s learning journey. Share your documents today.
Document Page
STATISTICS
Question One
Table 1: Descriptive Statistics Table
Descriptive Statistics
Score Hotel Stars Member Years No. of Reviews
Mean 4.123016 4.142857 4.35119 48.13095
Median 4 4 4 23.5
Std. Dev 1.007302 0.774487 2.93225 74.99643
Minimum 1 3 0 1
Maximum 5 5 13 775
Q1 4 3.5 2 12
Q3 5 5 6 54.25
IQR 1 1.5 4 42.25
No. of Outliers 0 0 0 0
Question Two
From the descriptive data analysis results presented in Table 1: Descriptive Statistics Table, all
the four variables; Score, Hotel Stars, Member Years and No. of Reviews have not outlier values
in their observations. The average values for the variables are as follows: 4.123016 for the Score,
4.142857 for the Hotel Stars, 4.35119 for the Member Years and 48.13095 for the No. of
Reviews.
1
tabler-icon-diamond-filled.svg

Secure Best Marks with AI Grader

Need help grading? Try our AI Grader for instant feedback on your assignments.
Document Page
STATISTICS
Question Three
0 50 100 150 200 250 300
0
50
100
150
200
250
300
350
400
No. Hotel Reviews Against No. of Helpful Votes
No. Hotel Reviews
No. of Helpful Votes
Figure 1: Scatterplot of No. Hotel Reviews against No. of Helpful Votes
Table 2: Correlation Coefficient for No. Hotel Reviews and No. of Hopeful Votes
Correlation Coefficient 0.7643222
3
From the plot in Figure 1: Scatterplot of No. Hotel Reviews against No. of Helpful Votes, the
data points appear to generally follow a positive diagonal trend. This implies that the relationship
between the No Hotels Reviews and No. of Helpful Reviews is a positive relationship. This is
also evident from the value of the correlation coefficient = 0.76432223 from Table 2: Correlation
Coefficient for No. Hotel Reviews and No. of Hopeful Votes. If the value of the correlation
coefficient is positive, the relationship of interest is also positive in nature (Barbara & Susan,
2014; Everitt & Skrondal, 2010).
2
Document Page
STATISTICS
The relationship can however not be described as linear, since from the plot the data points do
not follow a linear trend. Despite this, the relationship can be described as relatively strong with
the value of the correlation coefficient being significantly high at 0.76432223.
Question Four
Hypothesis:
H0 : μc μnc
H1 : μc>μnc
Where μc is the mean score for hotels with casinos while μnc is the mean score for the hotels
without casinos.
The t-test independent two sample test compares the means of two different categories in relation
to another variable (Howitt & Cramer, 2010; Norman, 2010). results from the t-test are in Table
3: T-test Two Sample Output below:
Table 3: T-test Two Sample Output
3
Document Page
STATISTICS
The test-statistic, from Table 3: T-test Two Sample Output is equal to -4.21145 and the p-value
(one tailed) = 3.01E-05. Considering the level of significance = 0.05, then the p-value = 3.01E-
05 < 0.05, we thus reject the null hypothesis H0 and conclude that the average score of the hotels
with casinos is significantly higher than that of hotels without casinos.
Question Five
The regression analysis provides statistical information on the relationship between variables of
interest (Cortes & Mohri, 2014; Tri & Jugal, 2015). The results from the regression analysis are
below:
Table 4: Regression Summary Output
4
tabler-icon-diamond-filled.svg

Secure Best Marks with AI Grader

Need help grading? Try our AI Grader for instant feedback on your assignments.
Document Page
STATISTICS
The regression equation is (2dp):
Score=1.537.70 ( E03 ) No . Reviews +2.00 ( E02 ) No . HotelReviews+5.20 ( E05 ) HelpfulVotes+ 0.36 HotelSt
The p-value for the regression = 5.2E-08 < 0.05 level of significance. Thus at 0.05 level of
significance the regression is significant. The p-values of the Hotel Stars, No. of Rooms, Travel
Type and Casino variables are less than 0.05 level of significance, hence they are significant for
this case. A unit change in the Number of Rooms variable results in a -0.13E-03 change in the
Score variable while a unit change in the Casino variable results in a 0.66 change in the Score
variable.
The value of the R2 = 0.1104 (4dp), this implies that the regression model explains up to 11.04%
of the relationship between the variables.
Question Six
Logistic regression is a form of regression whereby the main variable of interest to a researcher
(dependent variable) is measured on ordinal or nominal scales and therefore categorical
(Hosmer, 2013; Jorge, et al., 2013).
The results of the logistic regression yielded the following results for the parameters:
5
Document Page
STATISTICS
Table 5: Logistic Regression Parameters
The coefficients of No. of Rooms and Casino are b5 and b12 respectively. Observing the
respective Odds Ratio (OR), then, a unit change in the Casino variable results in a 167% change
in the Score_b variable while a unit change in the No. of Rooms variable result in a 100%
change in the Score_b variable.
6
Document Page
STATISTICS
References
Barbara, I & Susan, D 2014, Introductory Statistics, 1st edn, OpenStax CNX, New York.
Cortes, C & Mohri, M 2014, 'Domain Adaptation and Sample Bias Correction Theory and
Algorithm for Regression', Theoretical Computer Science , vol.5, no.7, pp. 103-126.
Everitt, BS & Skrondal, A 2010, Cambridge Dictionary of Statistics, 4th edn, Cambridge
University Press, London.
Hosmer, D 2013, Applied Logistic Regression, 1 edn, Wiley, Hoboken, New Jersey.
Howitt, D & Cramer, D 2010, Introduction to Descriptive Statistics in Psycology, 5th edn,
Prentice Hall, New York.
Jorge, AA, Angela, A & Edson, ZM 2013, 'Robust Linear Regression Models: Use of Stable
Distribution for the Response Data', Open Journal of Statistics, Vol.3, no.1, pp. 3-5.
Norman, G 2010, 'Likert Scales, Levels of Measurement and the Laws of Statistics', Advances in
Health Science Education , vol.15. no.5, pp. 625-632.
Tri, D & Jugal, K 2015, Select Machine Learning Algorithms Using Regression Models, s.l.:
2015 IEEE Conference.
7
chevron_up_icon
1 out of 7
circle_padding
hide_on_mobile
zoom_out_icon
logo.png

Your All-in-One AI-Powered Toolkit for Academic Success.

Available 24*7 on WhatsApp / Email

[object Object]