Data Handling and Decision Making Report for DAT7001 Module
VerifiedAdded on 2022/09/07
|30
|6264
|25
Report
AI Summary
This report analyzes TripAdvisor's data handling and decision-making processes, covering aspects such as data sources, data flow, data integrity, and ethical considerations. The report examines how TripAdvisor uses data from listings, sales, and user reviews to inform decisions on package development, resource allocation, and sustainability. It proposes improvements like cluster and sentimental analysis to enhance decision-making. The report also addresses data protection, ethical concerns, and the challenges of big data storage. The report further delves into a data analysis using data from restaurants in European cities to determine the relationship between the number of reviews and the ratings. This analysis is aimed at making a critical decision on whether to remove the older reviews to address cost and sustainability issues.

Data Handling and Decision Making
Paraphrase This Document
Need a fresh take? Get an instant paraphrase of this document with our AI Paraphraser
Data Handling and Decision Making
Task 1
About TripAdvisor
TripAdvisor is a travels and tours company with its headquarters in the United States of America
(TripAdvisor, 2019). The company is website-based with all interactions with the consumers
being on the platform. The services offered by TripAdvisor of the TripAdvisor website include
destination reviews, destination ratings, travel logistics, destination listings and bookings, and
advertisements (TripAdvisor, 2019). Destinations in this respect refer to hotels and restaurants
with travel logistics referring to cruises, car tours and flights. The company mainly earns from
travel logistics, destination listings and bookings, and advertisements (TripAdvisor, 2019). The
user generated content; destination reviews and destination ratings act as attraction for users who
are both planning to travel or are already travelling. Ratings and reviews act as important
information source, especially for travelers, on which destinations are good and which are not
(Ki-Joon & Choong-Ki, 2015; Conlin, 2009).
Current Data Use
TripAdvisor being a website-based company means that it has access to a huge amount of data,
essentially big data. Many of the website-based companies established at the infant stages of the
internet and website technology did not foresee the potential of the data at that time (Vicenc,
2017). This is largely due to the development in data technology, which was not as advanced as
it is now (Laudon & Guercio, 2014). TripAdvisor is one of these companies being established in
the year 2000 (TripAdvisor, 2019). However, with the data technology being highly developed
currently, the data potential in TripAdvisor is visible and can be utilized. The company has the
2
Data Handling and Decision Making
following financial and non-financial data that they use for the decision making process in the
company’s operations:
1. Listings Data: This data contain information of the hotels, restaurants, travel services that
have registered to be listed on the website. The data contains the name of the listing, the
type of listing (hotel, restaurant and travel services), the number of subscriptions, the
package subscribed for and the country or city of origin of the listing.
2. Sales Data: this data contains information on the amount of money generated from the
different revenue sources at TripAdvisor (travel logistics, destination listings and
bookings, and advertisements). Under each of the revenue sources, sales data is available
for each package being provided. The sales data is also available across different periods:
days, months and years as well as across the different geopolitical regions (continents,
countries and cities).
Data Integrity
The quality of data that concerns its accuracy, consistency and maintenance is what is referred to
as data integrity (Lenca & Ferretti, 2018; Pierre, 2011). In terms of both consistency and
maintenance, TripAdvisor performs well. The data on the same type of variables is available for
the period from 2011 to date, which represents an aspect of consistency in the collection and
storage of data. The consistency of data is closely related to the maintenance of data, with the
level of maintenance of the data to some extent informing on the consistency of the data (Karolin
& Schrape, 2018). The accuracy of the data is however questionable especially with respect to
3
⊘ This is a preview!⊘
Do you want full access?
Subscribe today to unlock all pages.
Trusted by 1+ million students worldwide
Data Handling and Decision Making
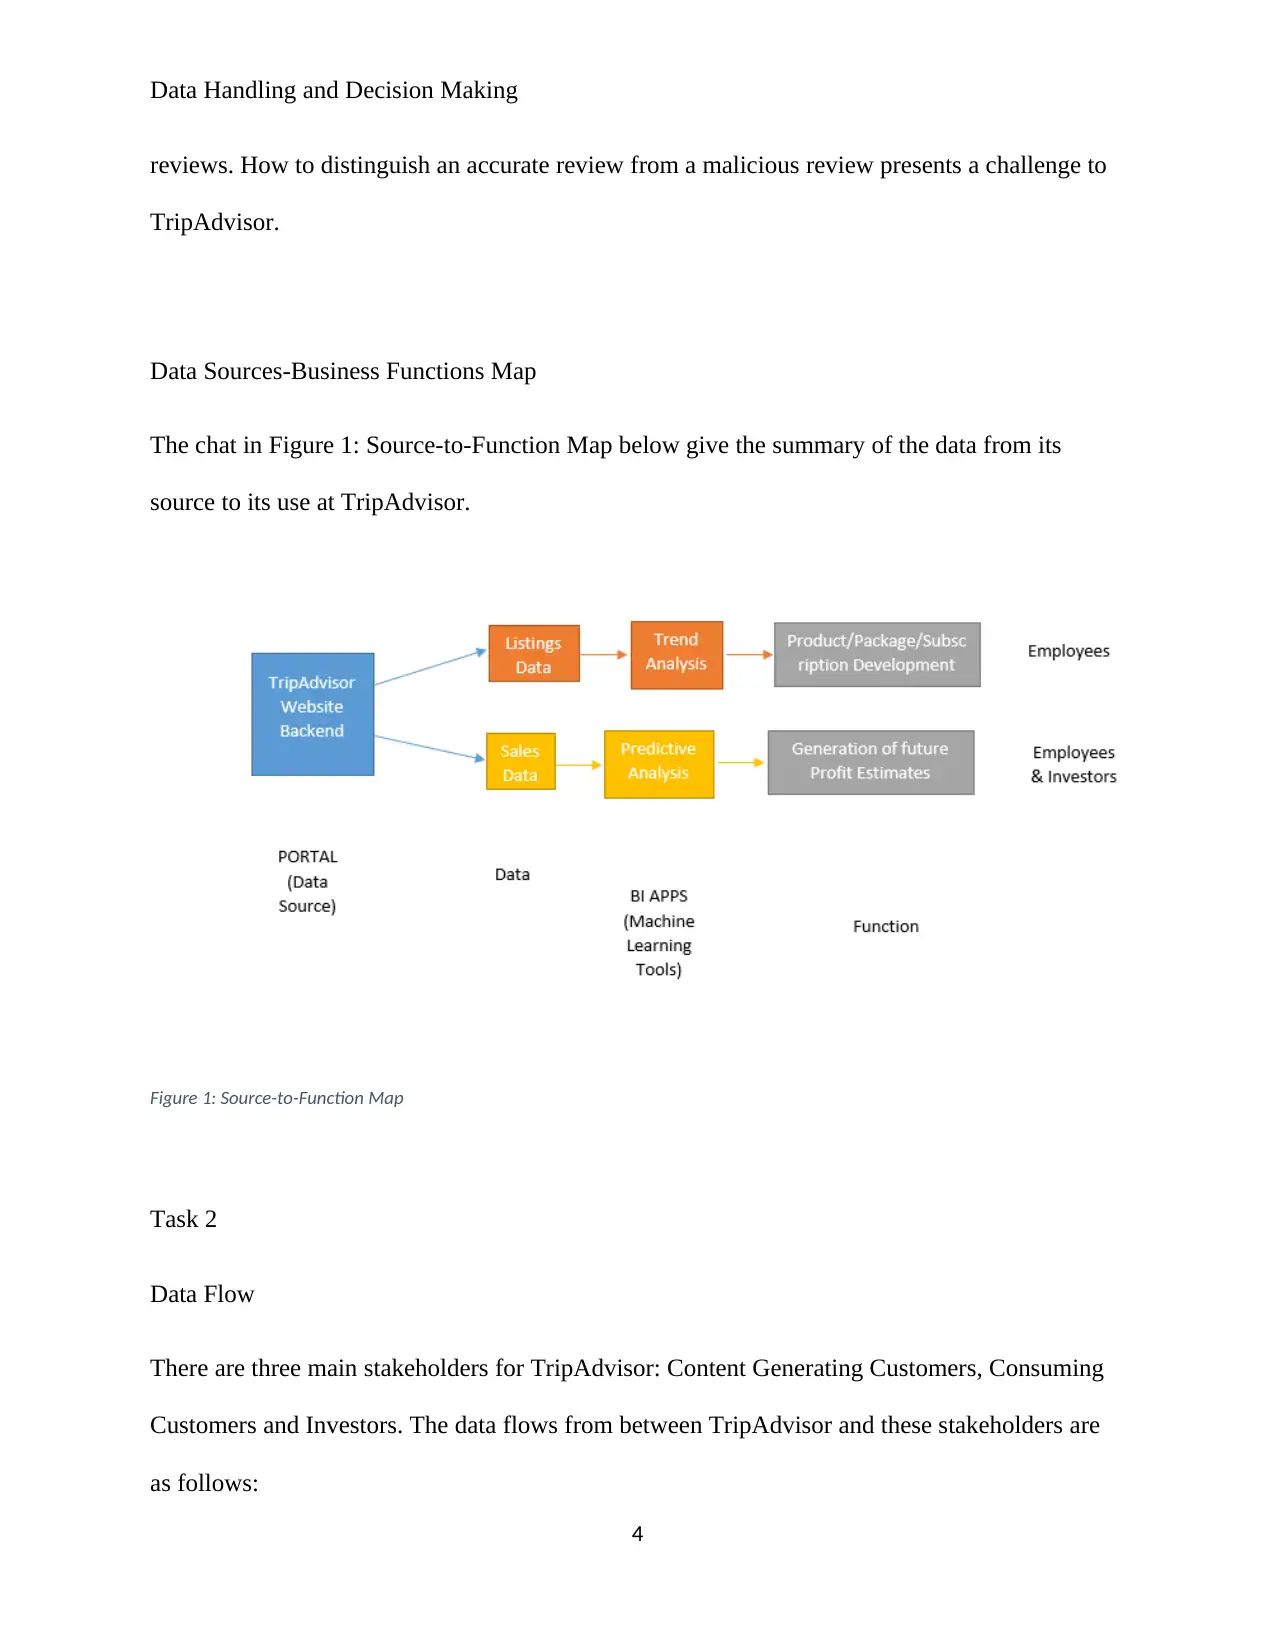
reviews. How to distinguish an accurate review from a malicious review presents a challenge to
TripAdvisor.
Data Sources-Business Functions Map
The chat in Figure 1: Source-to-Function Map below give the summary of the data from its
source to its use at TripAdvisor.
Figure 1: Source-to-Function Map
Task 2
Data Flow
There are three main stakeholders for TripAdvisor: Content Generating Customers, Consuming
Customers and Investors. The data flows from between TripAdvisor and these stakeholders are
as follows:
4
Paraphrase This Document
Need a fresh take? Get an instant paraphrase of this document with our AI Paraphraser

Data Handling and Decision Making
1. Content Generating Customers: These are customers that visit the TripAdvisor website to
make reviews and ratings of the destinations and only consume the advertisements on the
websites. The data flow between content generating customers and TripAdvisor is
therefore an inflowing data flow. Although this data is not processed, it forms the most
relevant data for TripAdvisor, since those visiting the site for trip advice are particularly
interested in this type of data. The ratings and reviews of products need to be current in
order to provide useful information (Naomi & Heiberger, 2011). This hence implies that
the content generating customers continuously remain relevant to TripAdvisor.
2. Consuming Customers: These are customers that either use Trip Advisor for planning
their travels or list their destinations on TripAdvisor. There is both outflow and inflow of
data between TripAdvisor and Consuming Customers. In the outflow, TripAdvisor
provides the data on reviews and ratings generated by the Content Generating Customers
to the consuming customers that uses TripAdvisor for planning their travels. In the
inflow, the consuming customers provide TripAdvisor with data on the Sales and Listings
described in Current Data Use above. The outflowing data is important as the key aspect
that attracts the consuming customers to the site while the inflowing data is critical in
operational decision-making for TripAdvisor.
3. Investors: These represent the capital owners and/or stakeholders of TripAdvisor.
TripAdvisor is listed in the NASDAQ hence those that own shares of TripAdvisor are the
Investors (TripAdvisor, 2019). The data flow between TripAdvisor and its investors is
mainly an outflow. The data is presented to the investors as reports, hence processing is
necessary for this data flow.
5
Data Handling and Decision Making
Proposed Improvements
Introducing cluster analysis for both listing and sales data would improve on the decision-
making at TripAdvisor. Cluster analysis is a technique in data analysis that groups items
(subjects or observations) in a dataset depending on the level of homogeneity of the items (Yu, et
al., 2011; Malki & Rizk, 2016; Ren & Ying, 2010). Clustering the listings data would provide
information on which restaurants, hotels and travel services have similarities in listings and
hence aid in package development, with each cluster of restaurants, hotels or travel services
having a customized package(s). The ratings and reviews data need to be collected, stored and
processed since it has potential for providing information that would also improve on the
decision making.
Data Integrity, Protection and Ethics
The main data integrity concern remains on the reviews; this would be solved by using
sentimental analysis of the reviews and summarizing the review with a single adjective.
Sentimental analysis is a data analysis technique that draws key opinions as themes from textual
data (Korkontzelos & Nikfarjam, 2016). This would be guided by rules on limit of number of
positive or negative words that flags a malicious review, making them more accurate. To ensure
data protection and ethics, the authors of the reviews need to be made aware that their reviews
are going to be analyzed and used for drawing inferences. The same apply for the data collected
from the consuming customers on sales and listings for the proposed cluster analysis approach.
6
⊘ This is a preview!⊘
Do you want full access?
Subscribe today to unlock all pages.
Trusted by 1+ million students worldwide
Data Handling and Decision Making
Task 3
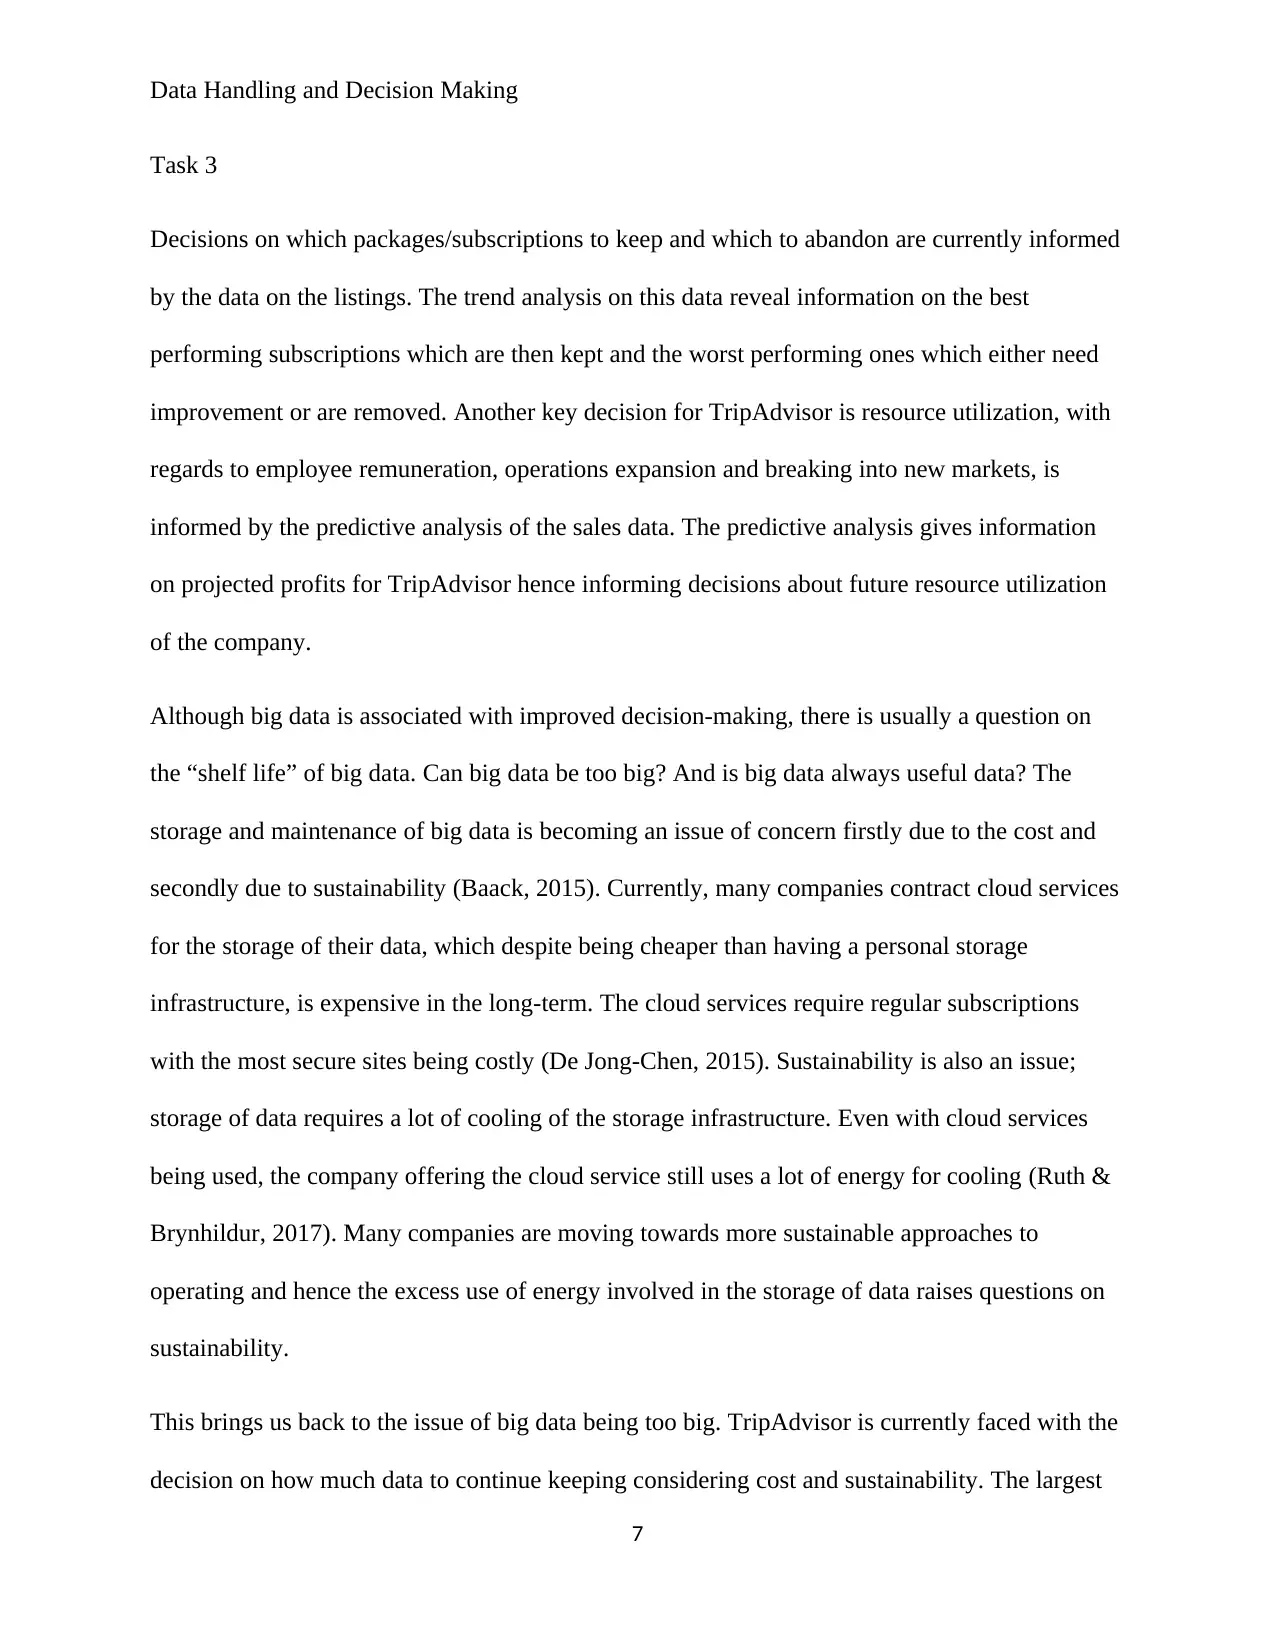
Decisions on which packages/subscriptions to keep and which to abandon are currently informed
by the data on the listings. The trend analysis on this data reveal information on the best
performing subscriptions which are then kept and the worst performing ones which either need
improvement or are removed. Another key decision for TripAdvisor is resource utilization, with
regards to employee remuneration, operations expansion and breaking into new markets, is
informed by the predictive analysis of the sales data. The predictive analysis gives information
on projected profits for TripAdvisor hence informing decisions about future resource utilization
of the company.
Although big data is associated with improved decision-making, there is usually a question on
the “shelf life” of big data. Can big data be too big? And is big data always useful data? The
storage and maintenance of big data is becoming an issue of concern firstly due to the cost and
secondly due to sustainability (Baack, 2015). Currently, many companies contract cloud services
for the storage of their data, which despite being cheaper than having a personal storage
infrastructure, is expensive in the long-term. The cloud services require regular subscriptions
with the most secure sites being costly (De Jong-Chen, 2015). Sustainability is also an issue;
storage of data requires a lot of cooling of the storage infrastructure. Even with cloud services
being used, the company offering the cloud service still uses a lot of energy for cooling (Ruth &
Brynhildur, 2017). Many companies are moving towards more sustainable approaches to
operating and hence the excess use of energy involved in the storage of data raises questions on
sustainability.
This brings us back to the issue of big data being too big. TripAdvisor is currently faced with the
decision on how much data to continue keeping considering cost and sustainability. The largest
7
Task 3
Decisions on which packages/subscriptions to keep and which to abandon are currently informed
by the data on the listings. The trend analysis on this data reveal information on the best
performing subscriptions which are then kept and the worst performing ones which either need
improvement or are removed. Another key decision for TripAdvisor is resource utilization, with
regards to employee remuneration, operations expansion and breaking into new markets, is
informed by the predictive analysis of the sales data. The predictive analysis gives information
on projected profits for TripAdvisor hence informing decisions about future resource utilization
of the company.
Although big data is associated with improved decision-making, there is usually a question on
the “shelf life” of big data. Can big data be too big? And is big data always useful data? The
storage and maintenance of big data is becoming an issue of concern firstly due to the cost and
secondly due to sustainability (Baack, 2015). Currently, many companies contract cloud services
for the storage of their data, which despite being cheaper than having a personal storage
infrastructure, is expensive in the long-term. The cloud services require regular subscriptions
with the most secure sites being costly (De Jong-Chen, 2015). Sustainability is also an issue;
storage of data requires a lot of cooling of the storage infrastructure. Even with cloud services
being used, the company offering the cloud service still uses a lot of energy for cooling (Ruth &
Brynhildur, 2017). Many companies are moving towards more sustainable approaches to
operating and hence the excess use of energy involved in the storage of data raises questions on
sustainability.
This brings us back to the issue of big data being too big. TripAdvisor is currently faced with the
decision on how much data to continue keeping considering cost and sustainability. The largest
7
Paraphrase This Document
Need a fresh take? Get an instant paraphrase of this document with our AI Paraphraser

Data Handling and Decision Making
data stored by TripAdvisor is the data on reviews collected from the content generating
customers. The reviews are textual data on the comments and opinions about a destination or
travel service. Hence, the question is how far back should reviews date to for them to still be
relevant for a destination or travel service? Current reviews make more sense if it is assumed that
the destinations and travel services are at constant state of improvement. However, this is just the
ideal case; the reality may be that this assumption is not true for all destinations and travel
services. Thus, older reviews become just as relevant as newer ones.
This decision is important not only for cost effectiveness, but also because it would move
TripAdvisor to sustainability status. The company, being website-based may seem to be involved
to a very limited extent with sustainability; however, energy sustainability in its data storage
presents a situation where a sustainable approach can be adopted. Currently, from TripAdvisor
(2009) the reviews total to 830 million reviews on the website which is a very huge number
representing a significantly large amount of data. The move to be more sustainable will be more
appealing to customers who off late are more concerned about the carbon footprints of products
and services. The manner in which this is approached remains the critical decision point for
TripAdvisor.
Task 4
About Data
In order to enable decision making for the critical decision point for TripAdvisor, it is important
to understand the relationship that exists between the number of reviews and the ratings in
different places around the world. Understanding this relationship will inform on whether
8
Data Handling and Decision Making
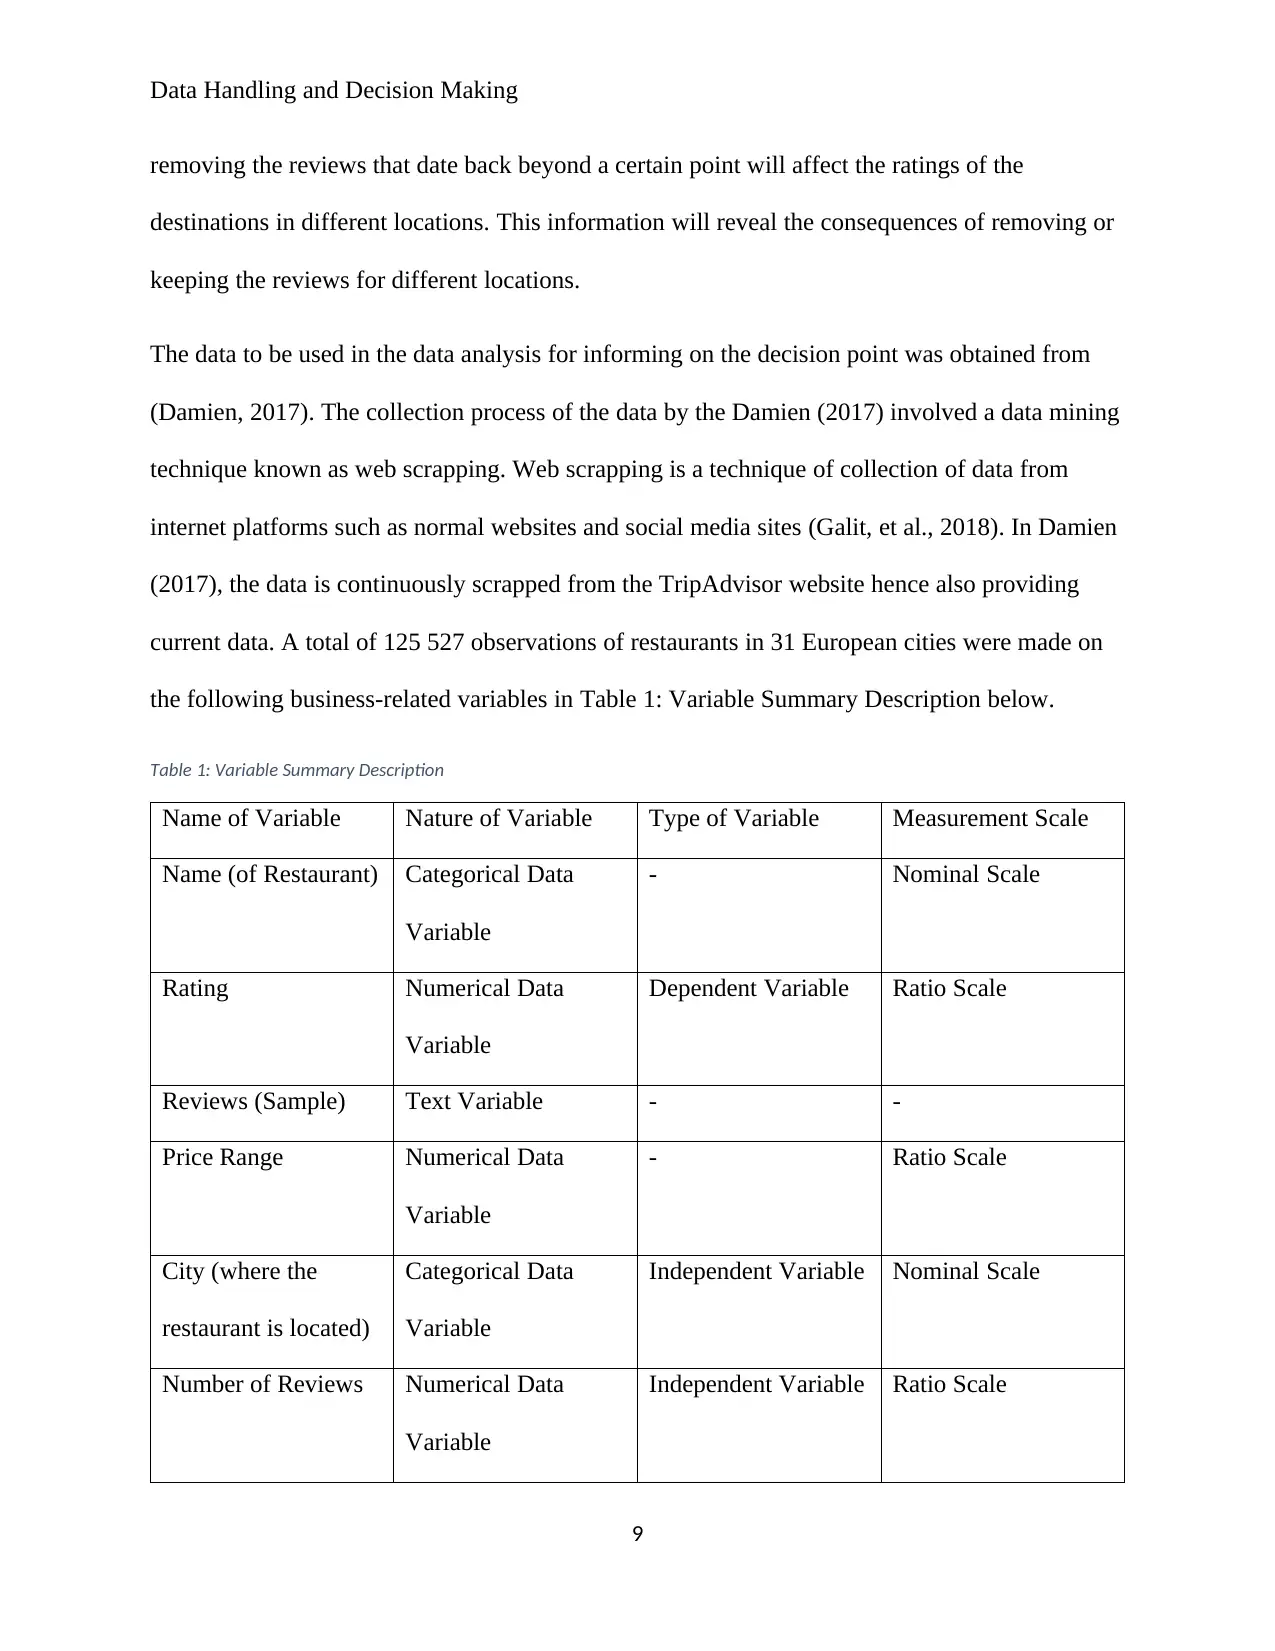
removing the reviews that date back beyond a certain point will affect the ratings of the
destinations in different locations. This information will reveal the consequences of removing or
keeping the reviews for different locations.
The data to be used in the data analysis for informing on the decision point was obtained from
(Damien, 2017). The collection process of the data by the Damien (2017) involved a data mining
technique known as web scrapping. Web scrapping is a technique of collection of data from
internet platforms such as normal websites and social media sites (Galit, et al., 2018). In Damien
(2017), the data is continuously scrapped from the TripAdvisor website hence also providing
current data. A total of 125 527 observations of restaurants in 31 European cities were made on
the following business-related variables in Table 1: Variable Summary Description below.
Table 1: Variable Summary Description
Name of Variable Nature of Variable Type of Variable Measurement Scale
Name (of Restaurant) Categorical Data
Variable
- Nominal Scale
Rating Numerical Data
Variable
Dependent Variable Ratio Scale
Reviews (Sample) Text Variable - -
Price Range Numerical Data
Variable
- Ratio Scale
City (where the
restaurant is located)
Categorical Data
Variable
Independent Variable Nominal Scale
Number of Reviews Numerical Data
Variable
Independent Variable Ratio Scale
9
⊘ This is a preview!⊘
Do you want full access?
Subscribe today to unlock all pages.
Trusted by 1+ million students worldwide
Data Handling and Decision Making
Data Preparation
The data preparation involved variable reduction and filtering out of null entries, both executed
in excel. Variable reduction or dimension reduction is a method of minimizing the number of
variables in a dataset to remain with the most relevant or useful variables for a study (Howitt &
Cramer, 2010). The initial dataset from Damien (2017) contained the following 11 variables;
Index, Name, Cuisine Style, City, Rating, Ranking, Number of Reviews, Price Range, Reviews,
ID_TA and URL_TA. In the dimension reduction the number of variable was reduced from 11 to
3 which were used for the analysis in the research; City, Rating and Number of Reviews. Two
extra variables, Name and Ranking, were retained in the dataset as identifiers, bringing the total
of variables in the final dataset to 5. In data analysis null entries broadly refers to observations
that have missing entries for one or more of the variables (Chambers, 2017). Null entries
contribute to miss interpretation of data characteristics and hence have to be corrected for the
case of small datasets and removed for the case of large datasets (Freedman, 2009). Given the
initial data from Damien (2017) was a large dataset, the missing entries were removed resulting
in a final dataset with 108 155 observations.
Limitations
The data from Damien (2017) considers a sample of restaurants in European cities, this excludes
other service type that are not restaurants and not located in Europe. Therefore, the
generalizability of the inferences from the analysis in this study may be limited as compared to
an instance where a global random sample was considered.
10
Paraphrase This Document
Need a fresh take? Get an instant paraphrase of this document with our AI Paraphraser
Data Handling and Decision Making
Task 5 & Task 6
Statistical Methods
The analysis part in this study involved the application of three analyses techniques: One-way
ANOVA, Correlation Analysis and Regression Analysis. One-way ANOVA is an analysis
technique that applies for analyzing the existence of significance groups’ difference among for a
categorical variable, when a numerical variable is considered as the factor of comparison (Kim,
2014). Correlation analysis is a statistical technique that is applied for analyzing the relationship
between two numerical variables (Kirk, 2016). Regression analysis is an analysis technique that
uses mathematical equations as a way of representing the nature of the relationship between
variables (Jaulin, 2010).
There was need to observe separate and joint relationship that Number of Reviews and City have
with Rating so as to provide more information. The One-way ANOVA is used for observing the
relationship between City and Rating variables to determine whether the cities significantly
differ when it comes to the ratings and number of reviews. The Correlation analysis is used for
observing the association between Rating and Number of Reviews variables to determine
whether there is a significant association between Number of Reviews and Ratings. The
Regression Analysis is used to observe the joint association that Number of Reviews and City
have with Rating to determine how the number of reviews about a destination and the location of
the destination jointly relate to the rating the destination when considered together.
Descriptive Statistics
11
Data Handling and Decision Making
Table 2: City Frequencies below gives the frequencies of the destinations for each of the 31 cities
with the corresponding bar graph as given in Figure 2: City Frequencies below. From both the
Table 2: City Frequencies and the Figure 2: City Frequencies below show that at 14.2% and
12.3% respectively, London and Paris lead in the highest number of destinations reviewed on
TripAdvisor in Europe. In addition, at 0.4% and 0.5% respectively, Ljubljana and Luxembourg
have the lowest number of destinations reviewed on TripAdvisor in Europe.
12
⊘ This is a preview!⊘
Do you want full access?
Subscribe today to unlock all pages.
Trusted by 1+ million students worldwide
1 out of 30
Related Documents


Your All-in-One AI-Powered Toolkit for Academic Success.
+13062052269
info@desklib.com
Available 24*7 on WhatsApp / Email
![[object Object]](/_next/static/media/star-bottom.7253800d.svg)
Unlock your academic potential
Copyright © 2020–2026 A2Z Services. All Rights Reserved. Developed and managed by ZUCOL.