Quantitative Methods for Accounting & Finance: TSTA401 Assignment

Verified

Added on  2023/04/25

|6
|642
|261
Homework Assignment
AI Summary
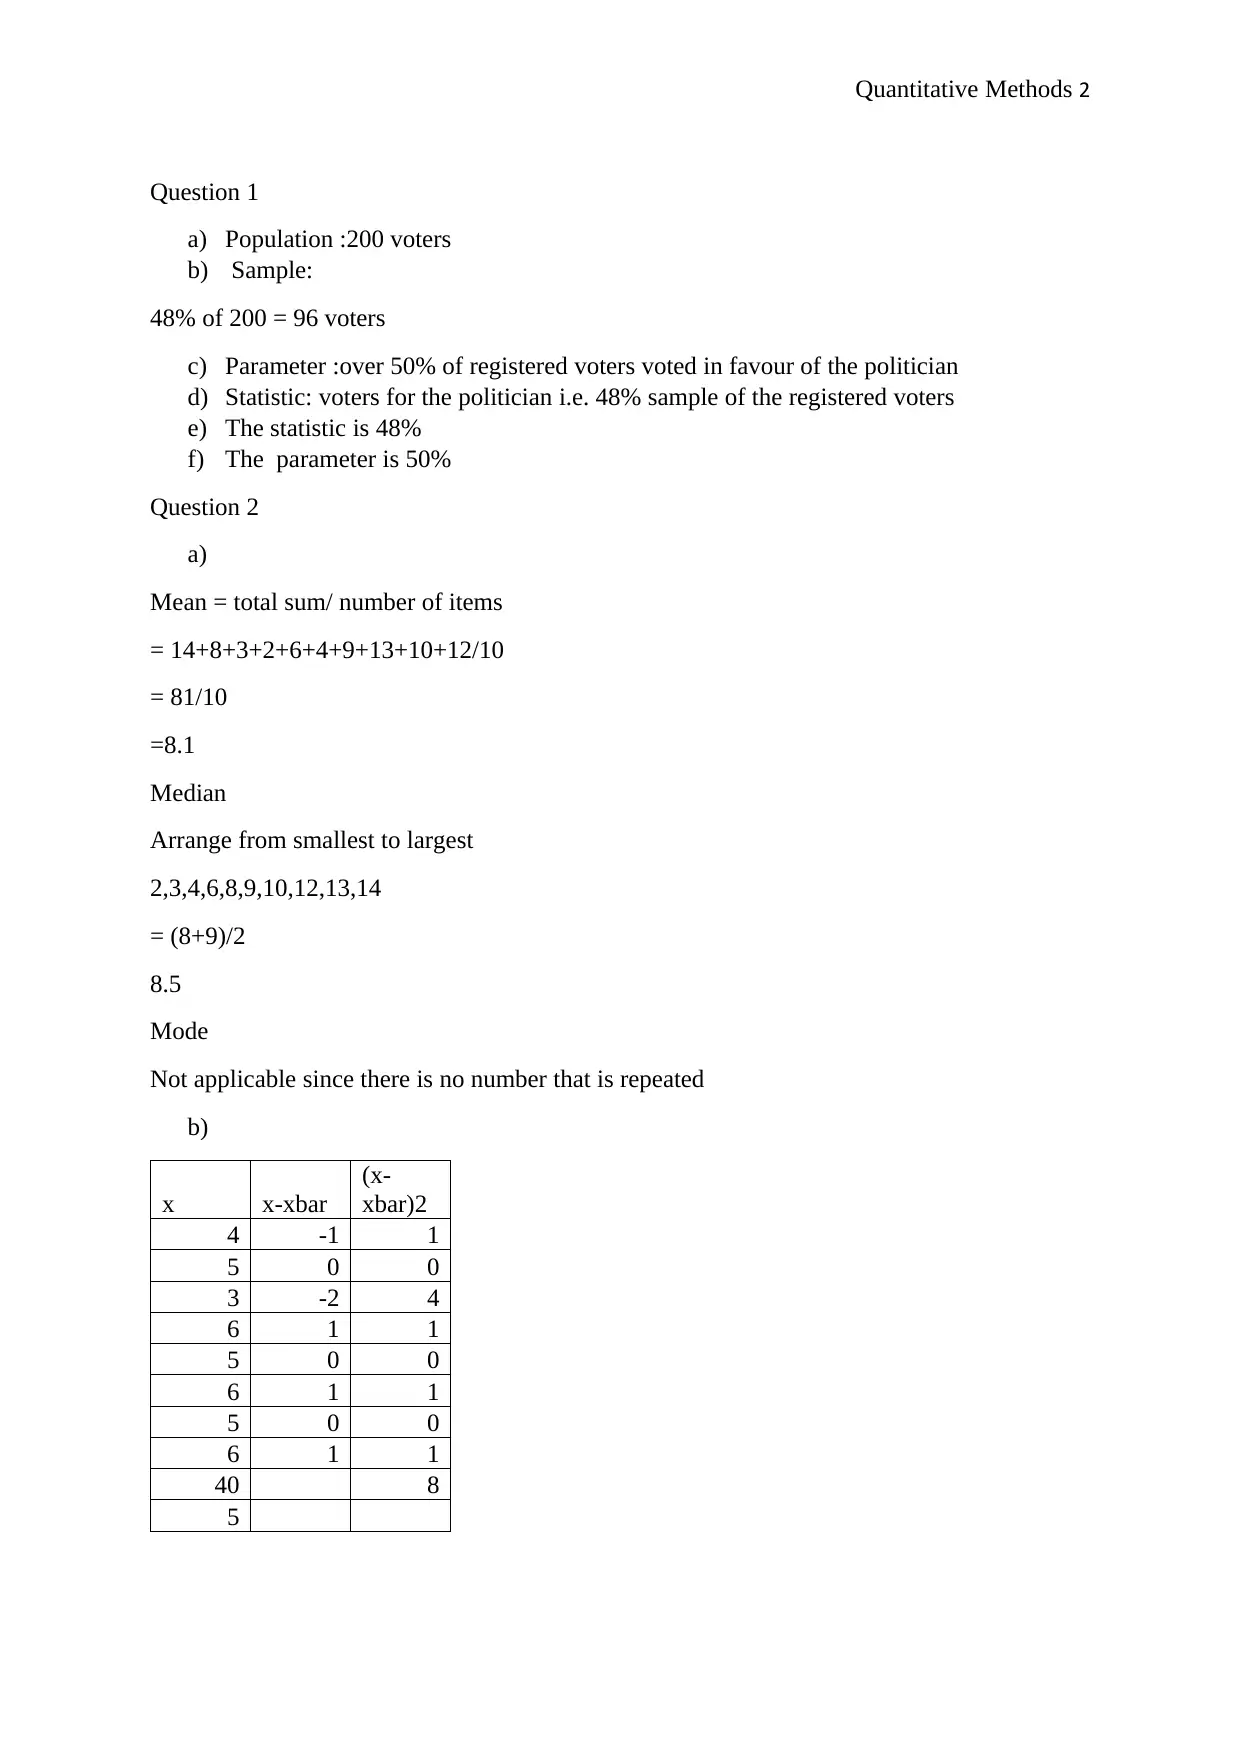
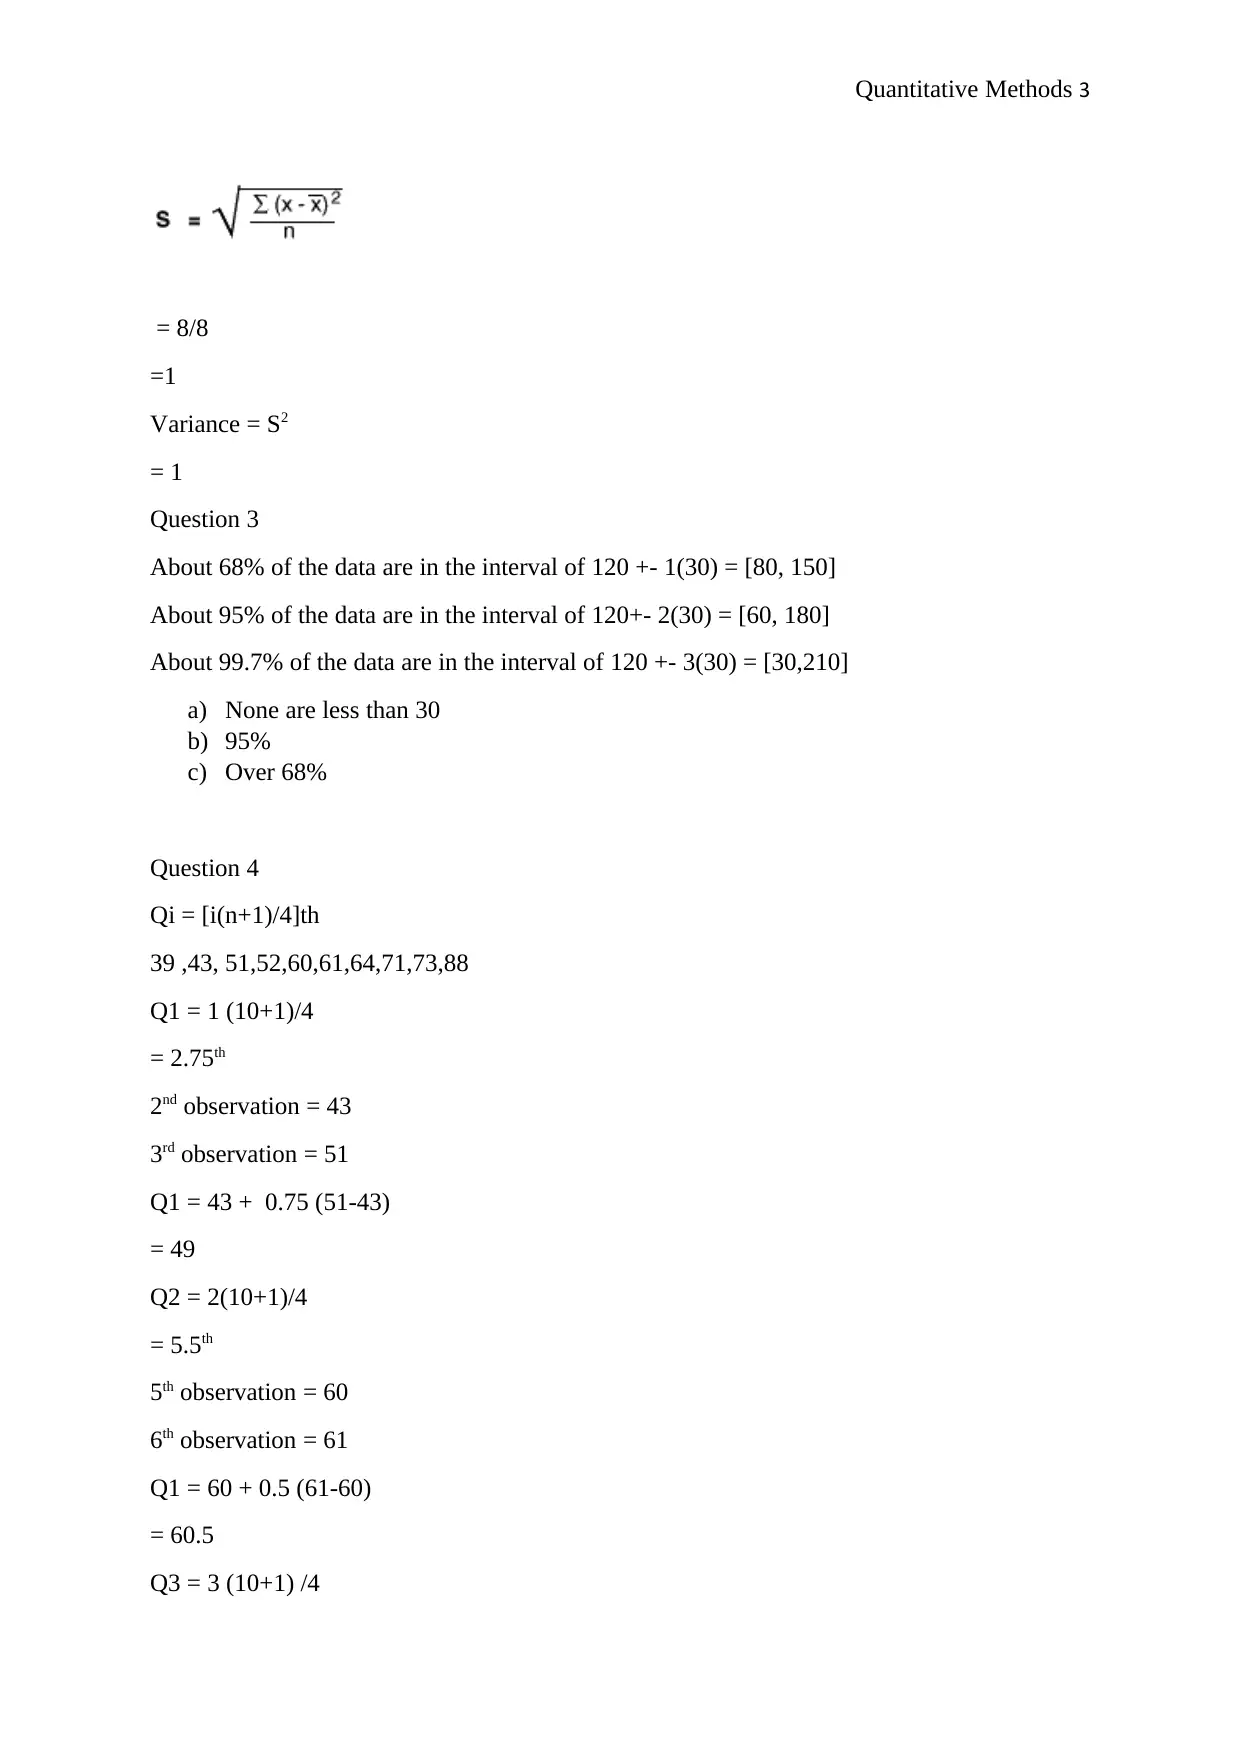
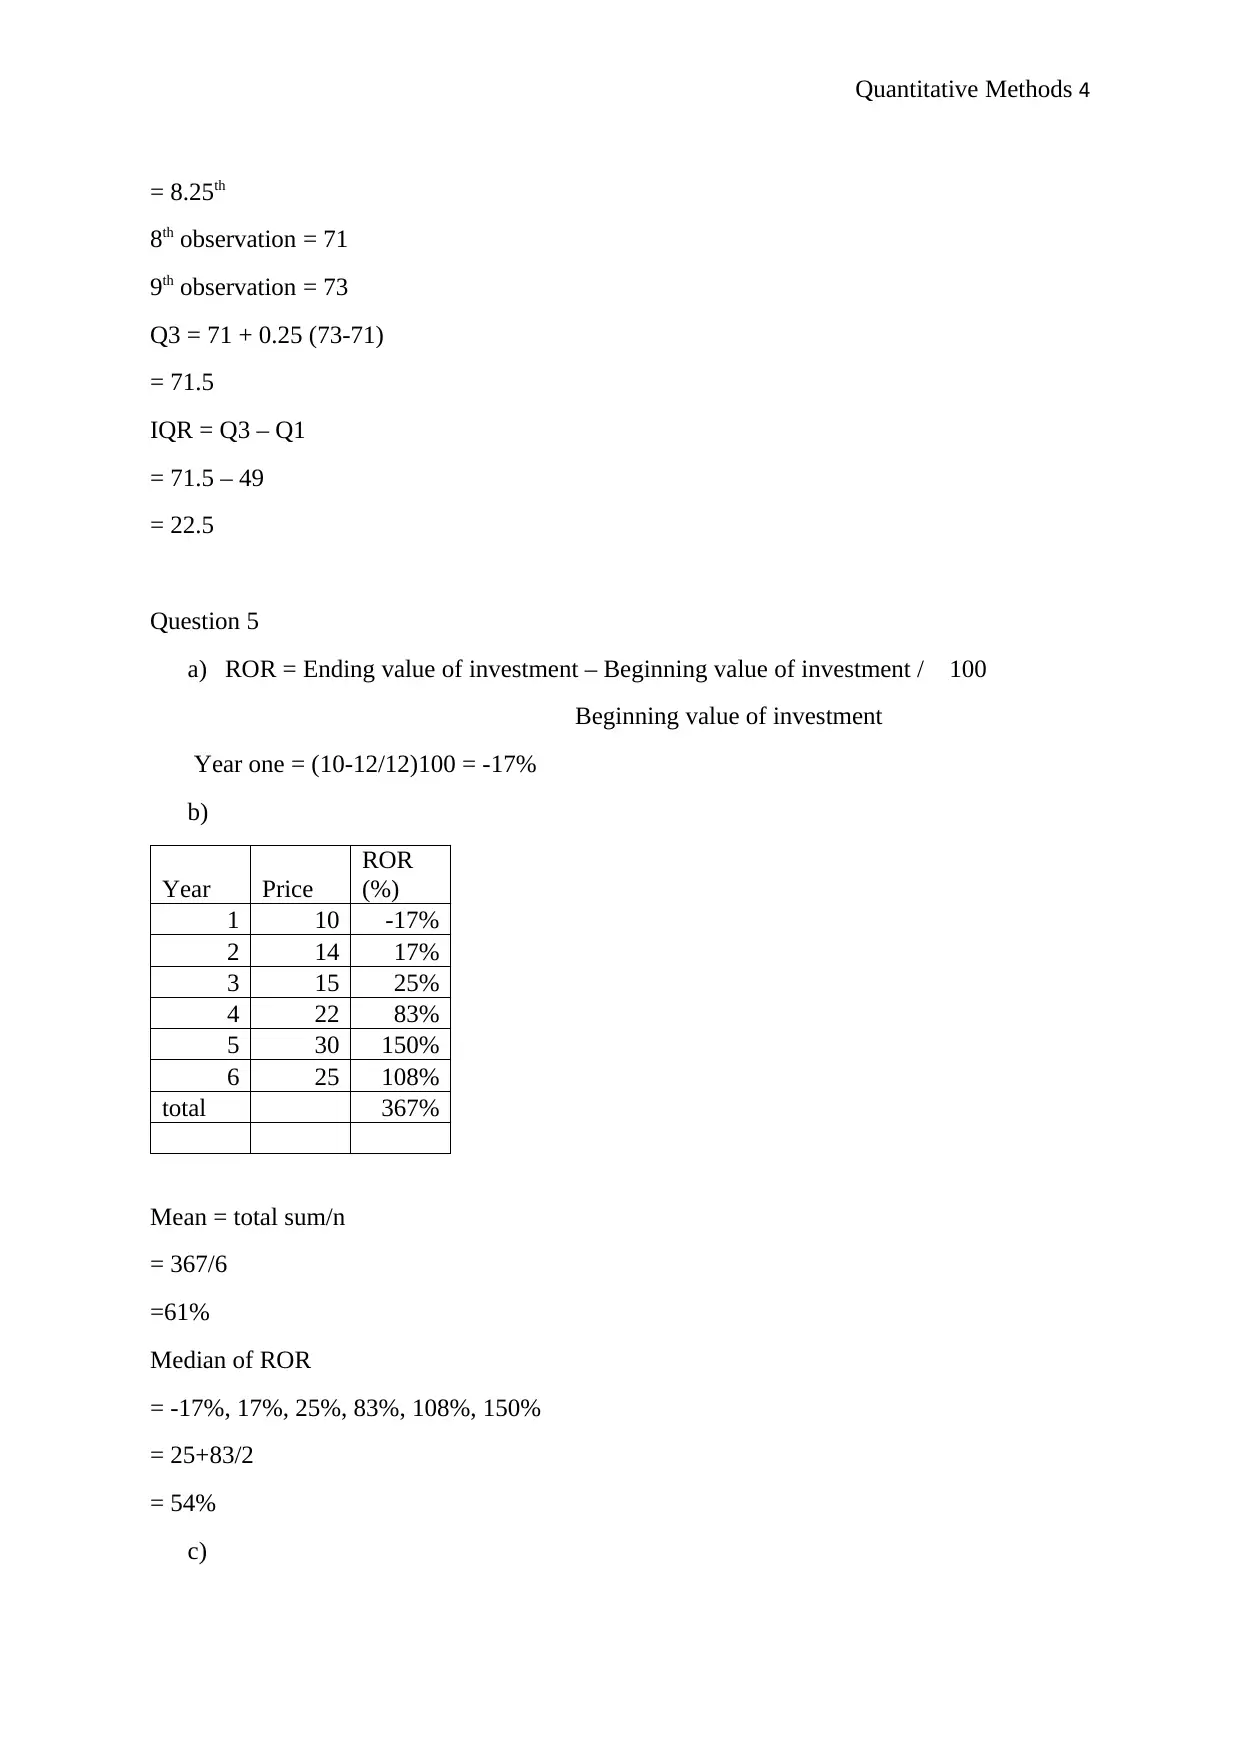
This document presents the solutions to a Quantitative Methods assignment, specifically for the TSTA401 course in Accounting and Finance, Term 1, 2019. The assignment covers topics such as population and sample identification, parameter and statistic determination, calculation of mean, median, and mode, variance computation, application of the empirical rule, quartile calculations including interquartile range (IQR), rate of return (ROR) analysis including mean, median, and geometric mean, and basic probability calculations. Detailed step-by-step solutions are provided for each question, demonstrating a clear understanding of the quantitative methods applied in finance and accounting contexts.
Document Page
Quantitative Methods 1
Quantitative Methods
Student’s Name
Student’s Number
University
Module Code
Module Name
Date
tabler-icon-diamond-filled.svg

Paraphrase This Document

Need a fresh take? Get an instant paraphrase of this document with our AI Paraphraser
Document Page
Quantitative Methods 2
Question 1
a) Population :200 voters
b) Sample:
48% of 200 = 96 voters
c) Parameter :over 50% of registered voters voted in favour of the politician
d) Statistic: voters for the politician i.e. 48% sample of the registered voters
e) The statistic is 48%
f) The parameter is 50%
Question 2
a)
Mean = total sum/ number of items
= 14+8+3+2+6+4+9+13+10+12/10
= 81/10
=8.1
Median
Arrange from smallest to largest
2,3,4,6,8,9,10,12,13,14
= (8+9)/2
8.5
Mode
Not applicable since there is no number that is repeated
b)
x x-xbar
(x-
xbar)2
4 -1 1
5 0 0
3 -2 4
6 1 1
5 0 0
6 1 1
5 0 0
6 1 1
40 8
5
Document Page
Quantitative Methods 3
= 8/8
=1
Variance = S2
= 1
Question 3
About 68% of the data are in the interval of 120 +- 1(30) = [80, 150]
About 95% of the data are in the interval of 120+- 2(30) = [60, 180]
About 99.7% of the data are in the interval of 120 +- 3(30) = [30,210]
a) None are less than 30
b) 95%
c) Over 68%
Question 4
Qi = [i(n+1)/4]th
39 ,43, 51,52,60,61,64,71,73,88
Q1 = 1 (10+1)/4
= 2.75th
2nd observation = 43
3rd observation = 51
Q1 = 43 + 0.75 (51-43)
= 49
Q2 = 2(10+1)/4
= 5.5th
5th observation = 60
6th observation = 61
Q1 = 60 + 0.5 (61-60)
= 60.5
Q3 = 3 (10+1) /4
Document Page
Quantitative Methods 4
= 8.25th
8th observation = 71
9th observation = 73
Q3 = 71 + 0.25 (73-71)
= 71.5
IQR = Q3 – Q1
= 71.5 – 49
= 22.5
Question 5
a) ROR = Ending value of investment – Beginning value of investment / 100
Beginning value of investment
Year one = (10-12/12)100 = -17%
b)
Year Price
ROR
(%)
1 10 -17%
2 14 17%
3 15 25%
4 22 83%
5 30 150%
6 25 108%
total 367%
Mean = total sum/n
= 367/6
=61%
Median of ROR
= -17%, 17%, 25%, 83%, 108%, 150%
= 25+83/2
= 54%
c)
tabler-icon-diamond-filled.svg

Paraphrase This Document

Need a fresh take? Get an instant paraphrase of this document with our AI Paraphraser
Document Page
Quantitative Methods 5
GM = ((x1)(x2)(x3) ... (xn))1/n
[ (-17) (17)(25)(83)(150)(108)]0.166
9,714,735,000 ^0.16666
= 46.19%
d)
The geometric mean is the best statistic because it is most useful when numbers in a series
are not independent of each other (Lind, Marchal, and Wathen, 2012; Anderson et al., 2012).
The prices are not independent of each other.
Question 6
a) ½
b) 2/3
c) 1/3
Document Page
Quantitative Methods 6
References
Anderson, D.R., Sweeney, D.J., Williams, T.A., Camm, J.D. and Cochran, J.J.,
2012. Quantitative methods for business. Cengage Learning.
Lind, D.A., Marchal, W.G. and Wathen, S.A., 2012. Statistical techniques in business &
economics. New York, NY: McGraw-Hill/Irwin.
chevron_up_icon
1 out of 6
circle_padding
hide_on_mobile
zoom_out_icon
[object Object]