TSTA 602 Case Study: Quantitative Methods in Finance - Nobel Prize

Verified

Added on  2023/06/18

|52
|5542
|50
Case Study
AI Summary
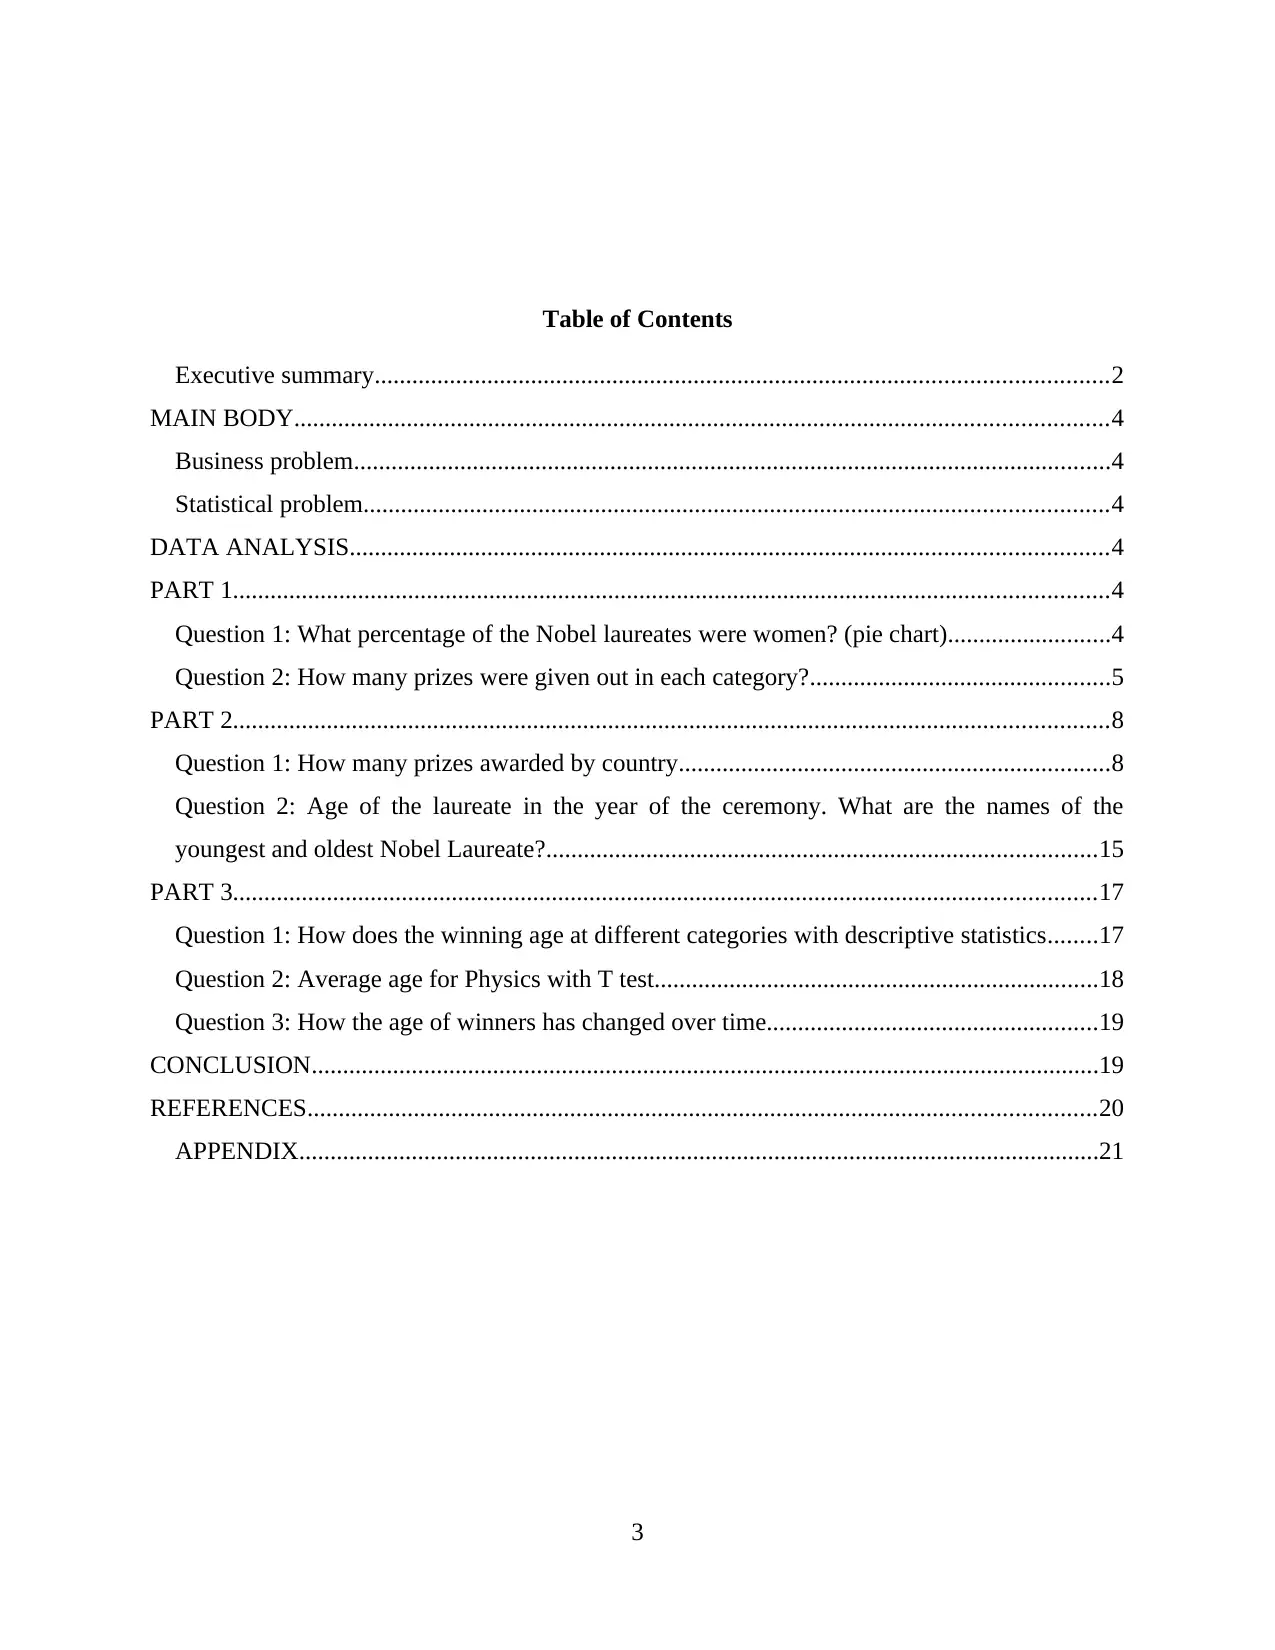
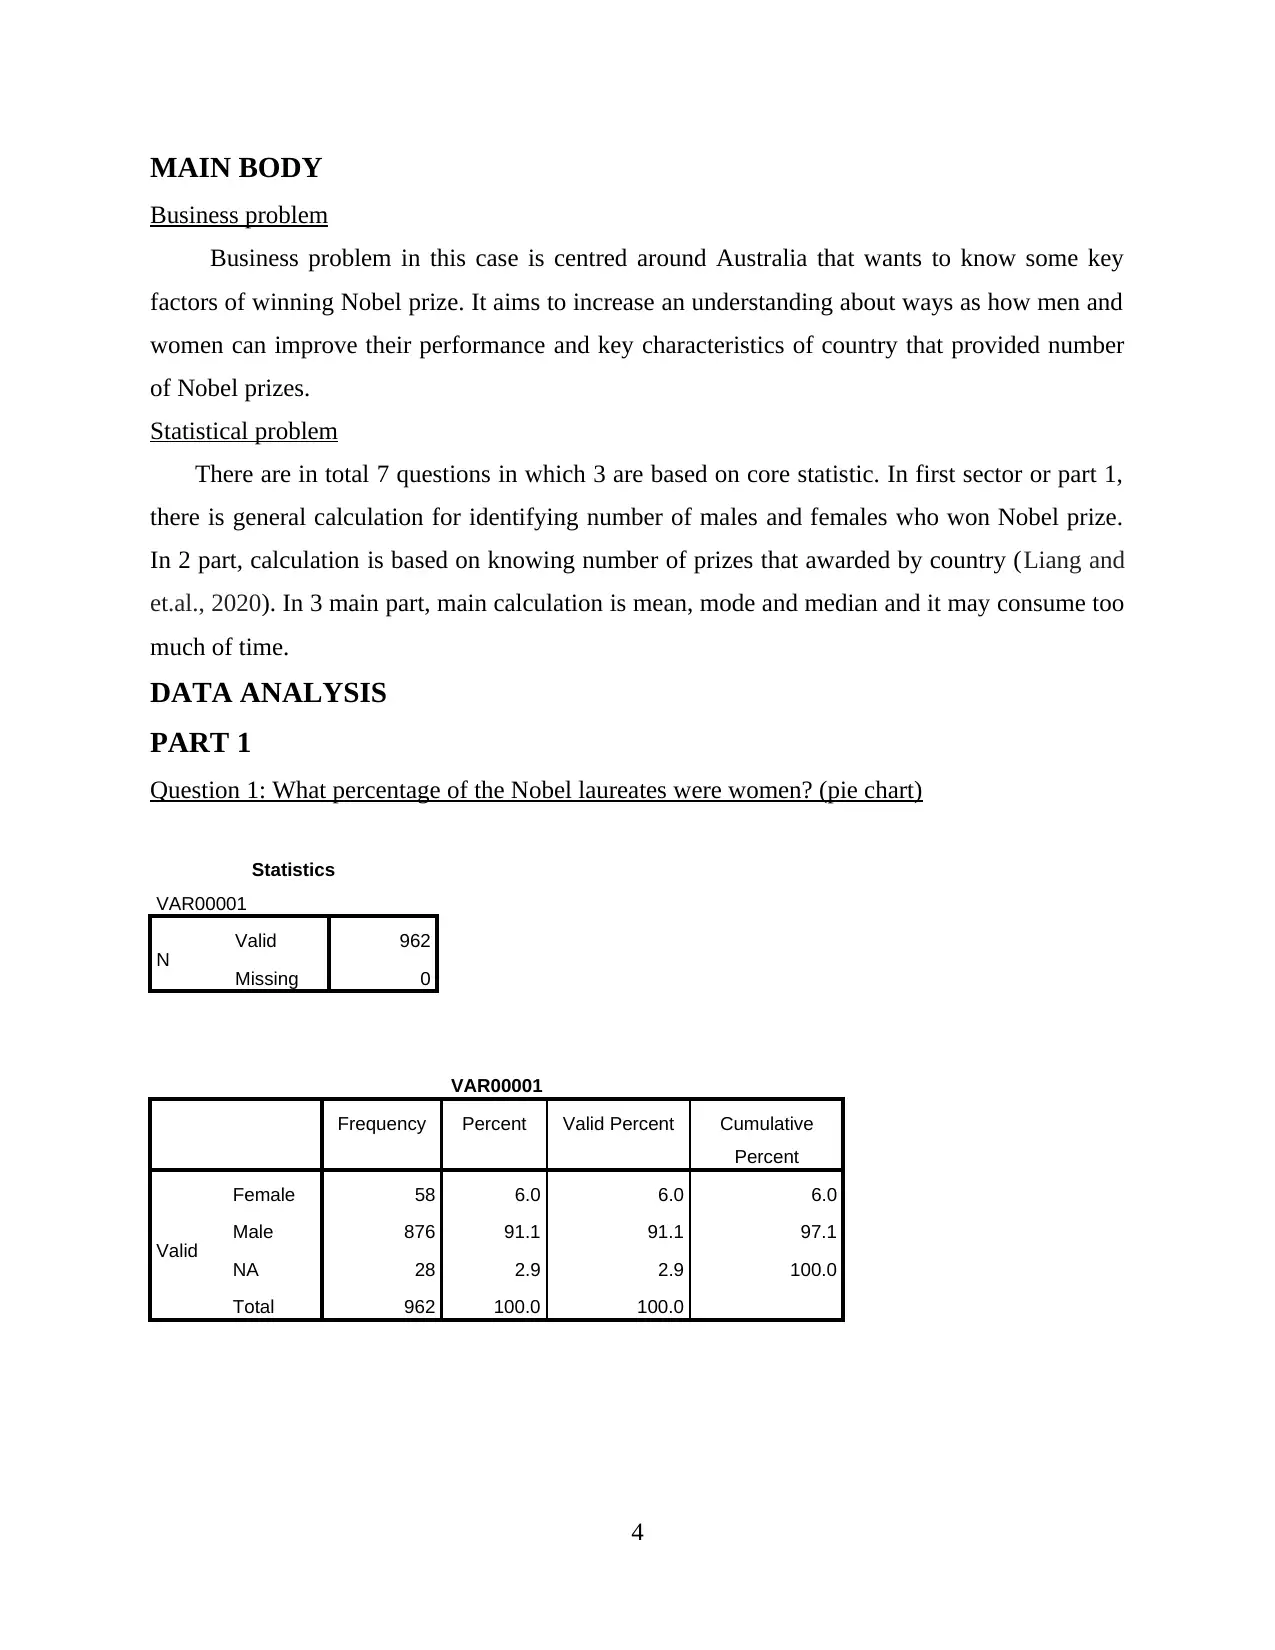
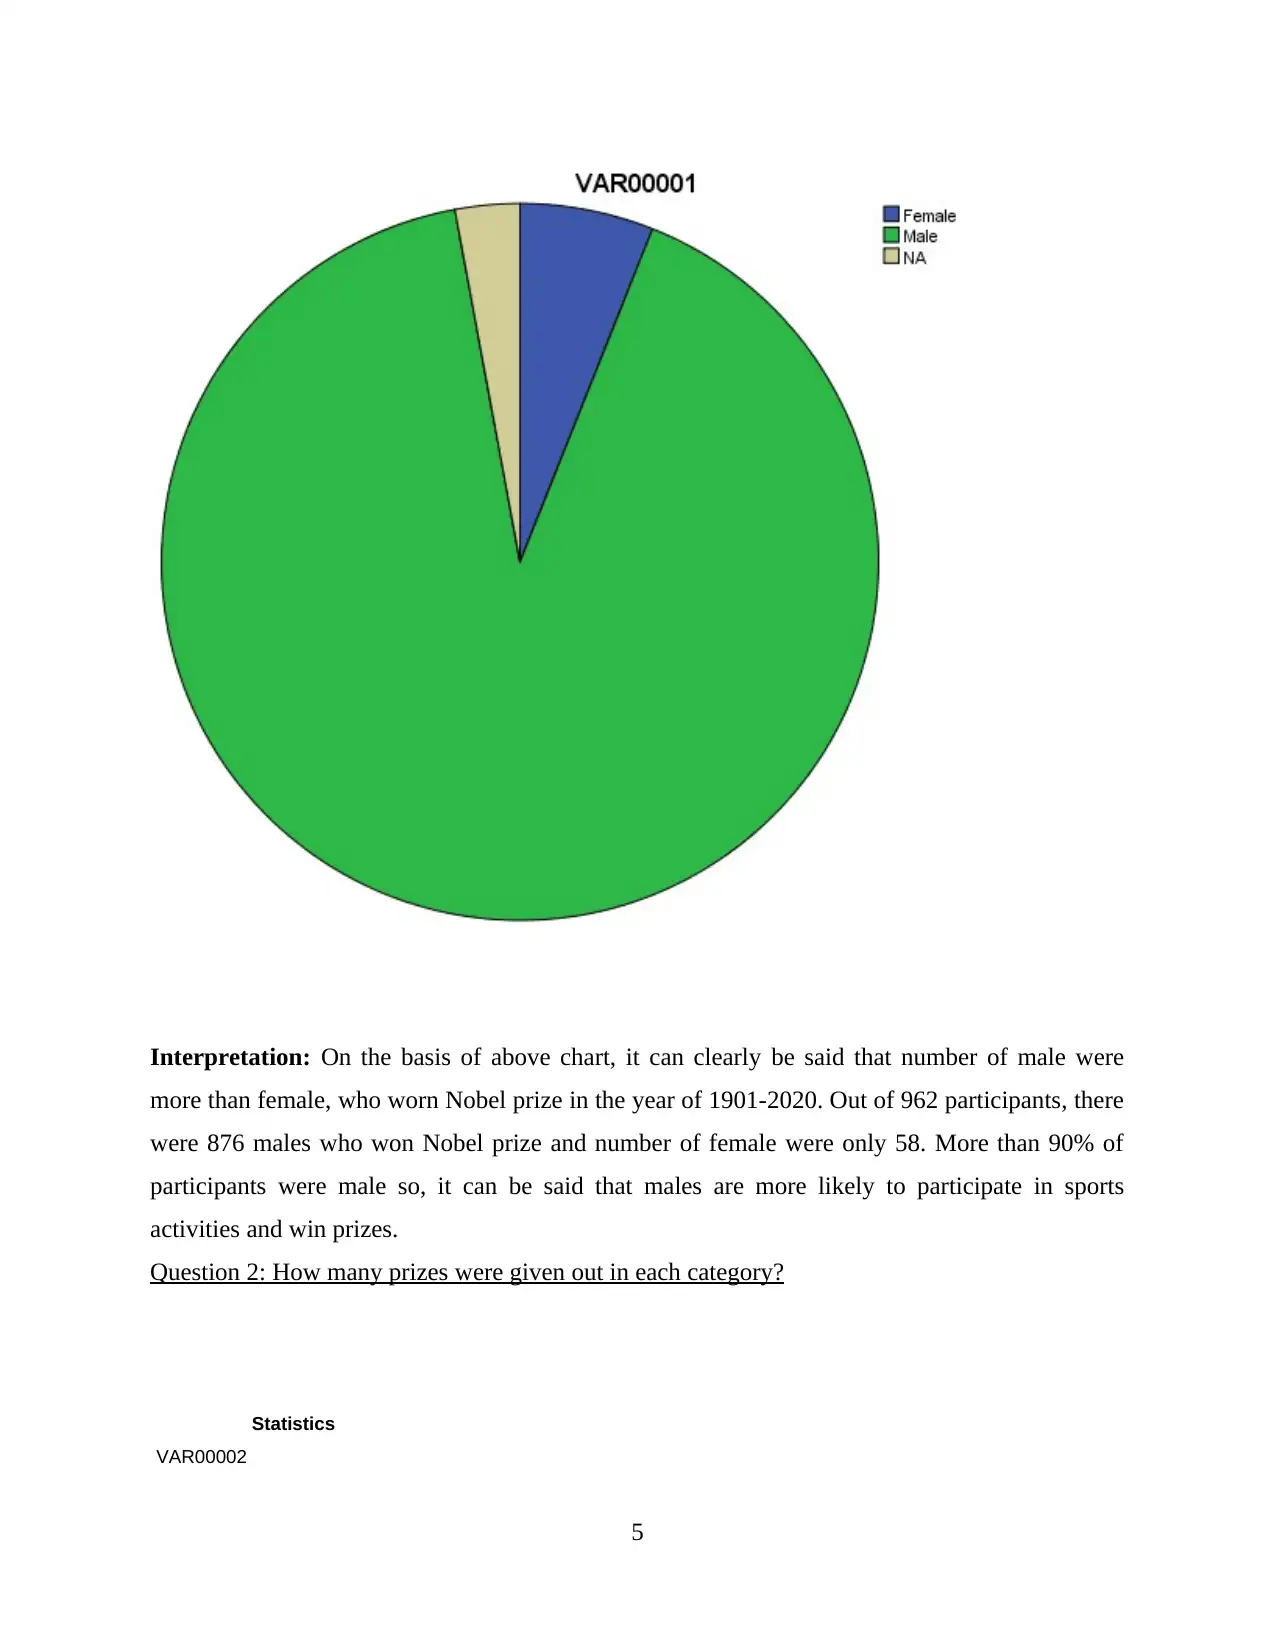
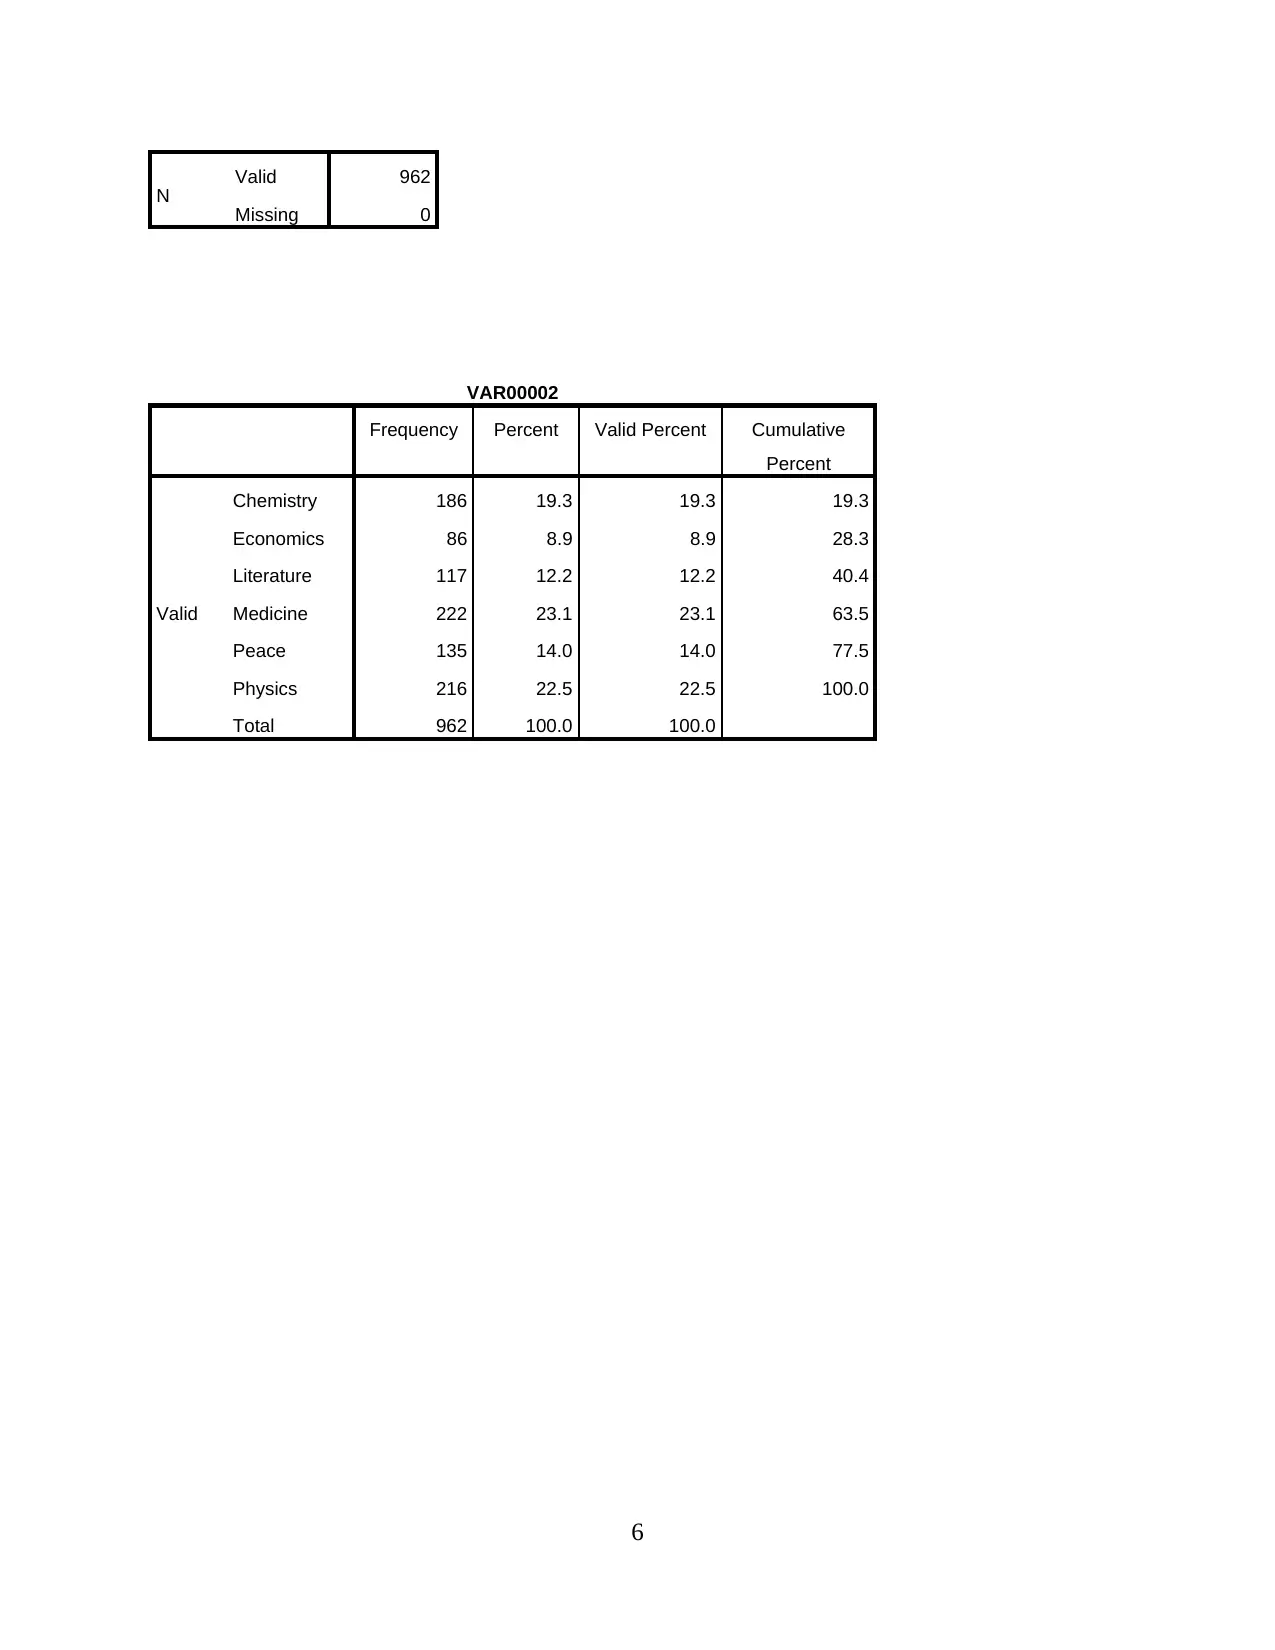
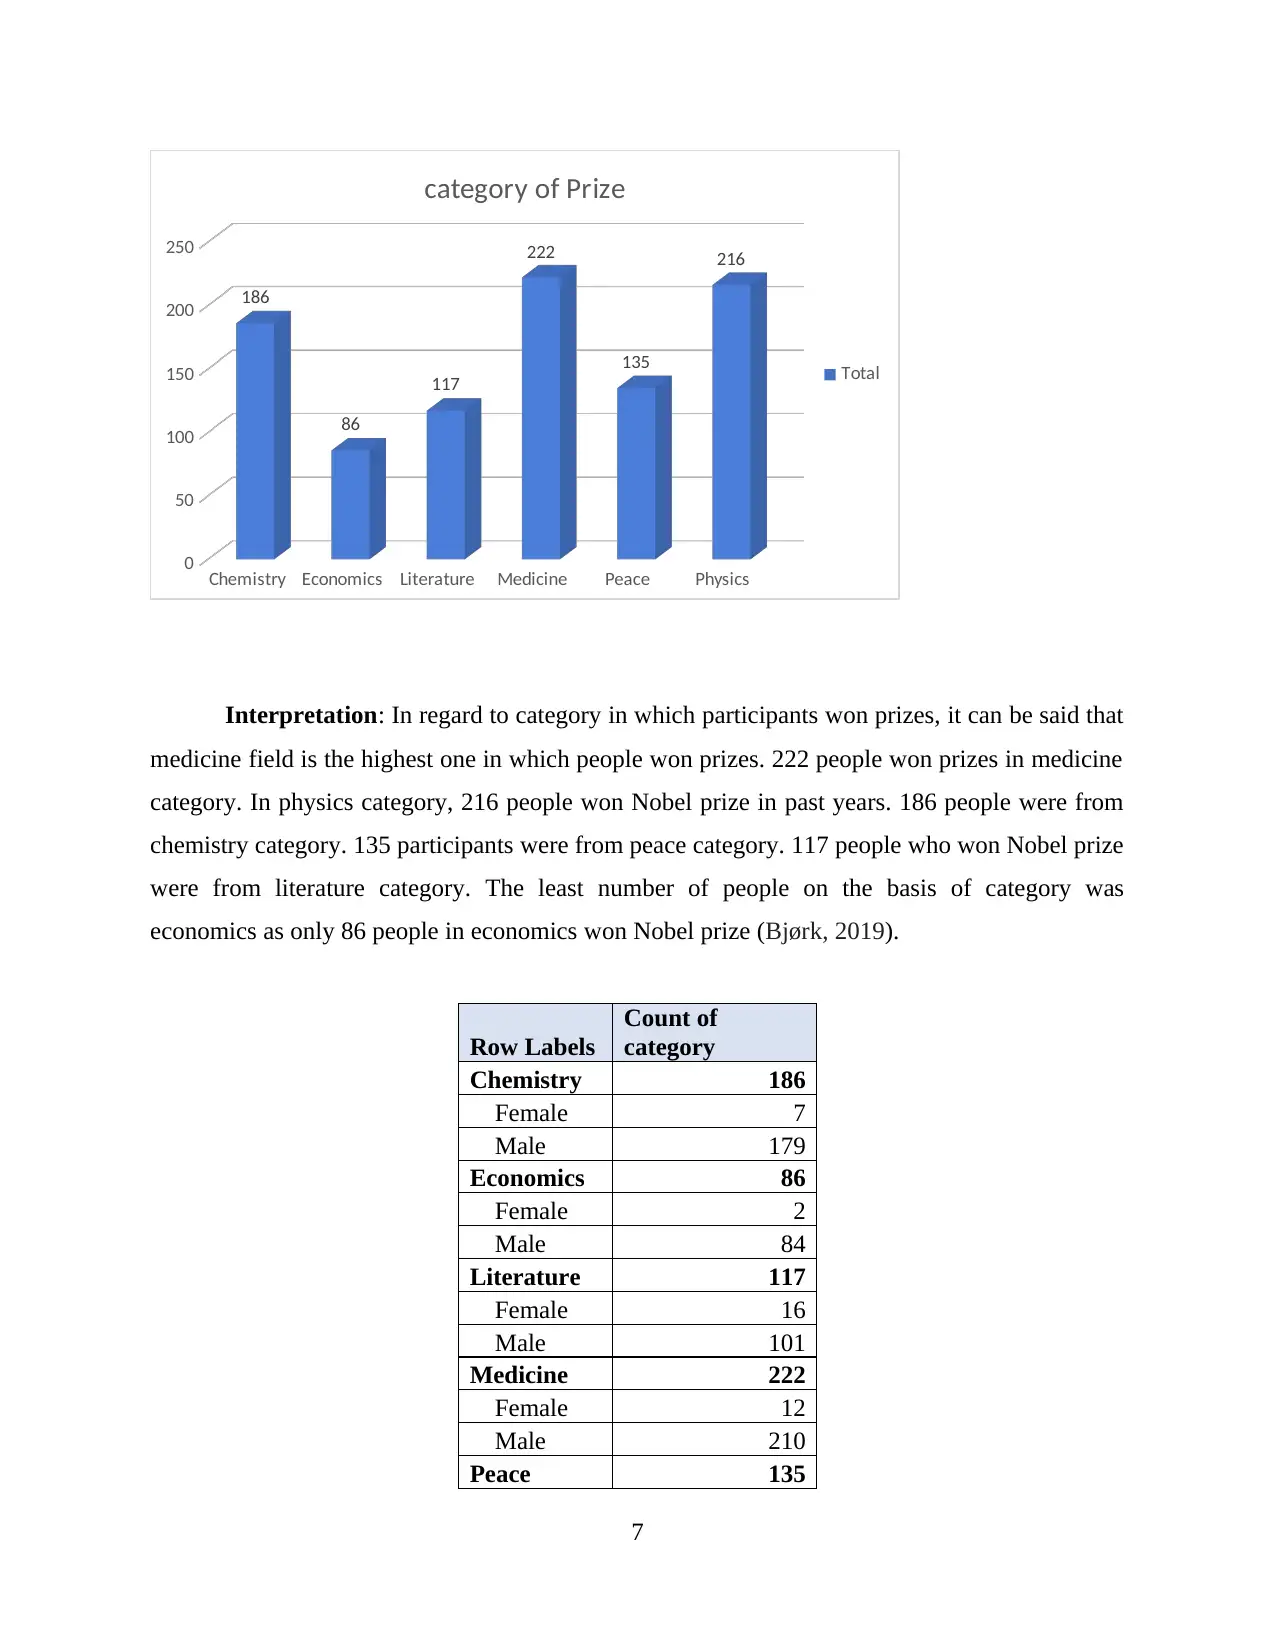
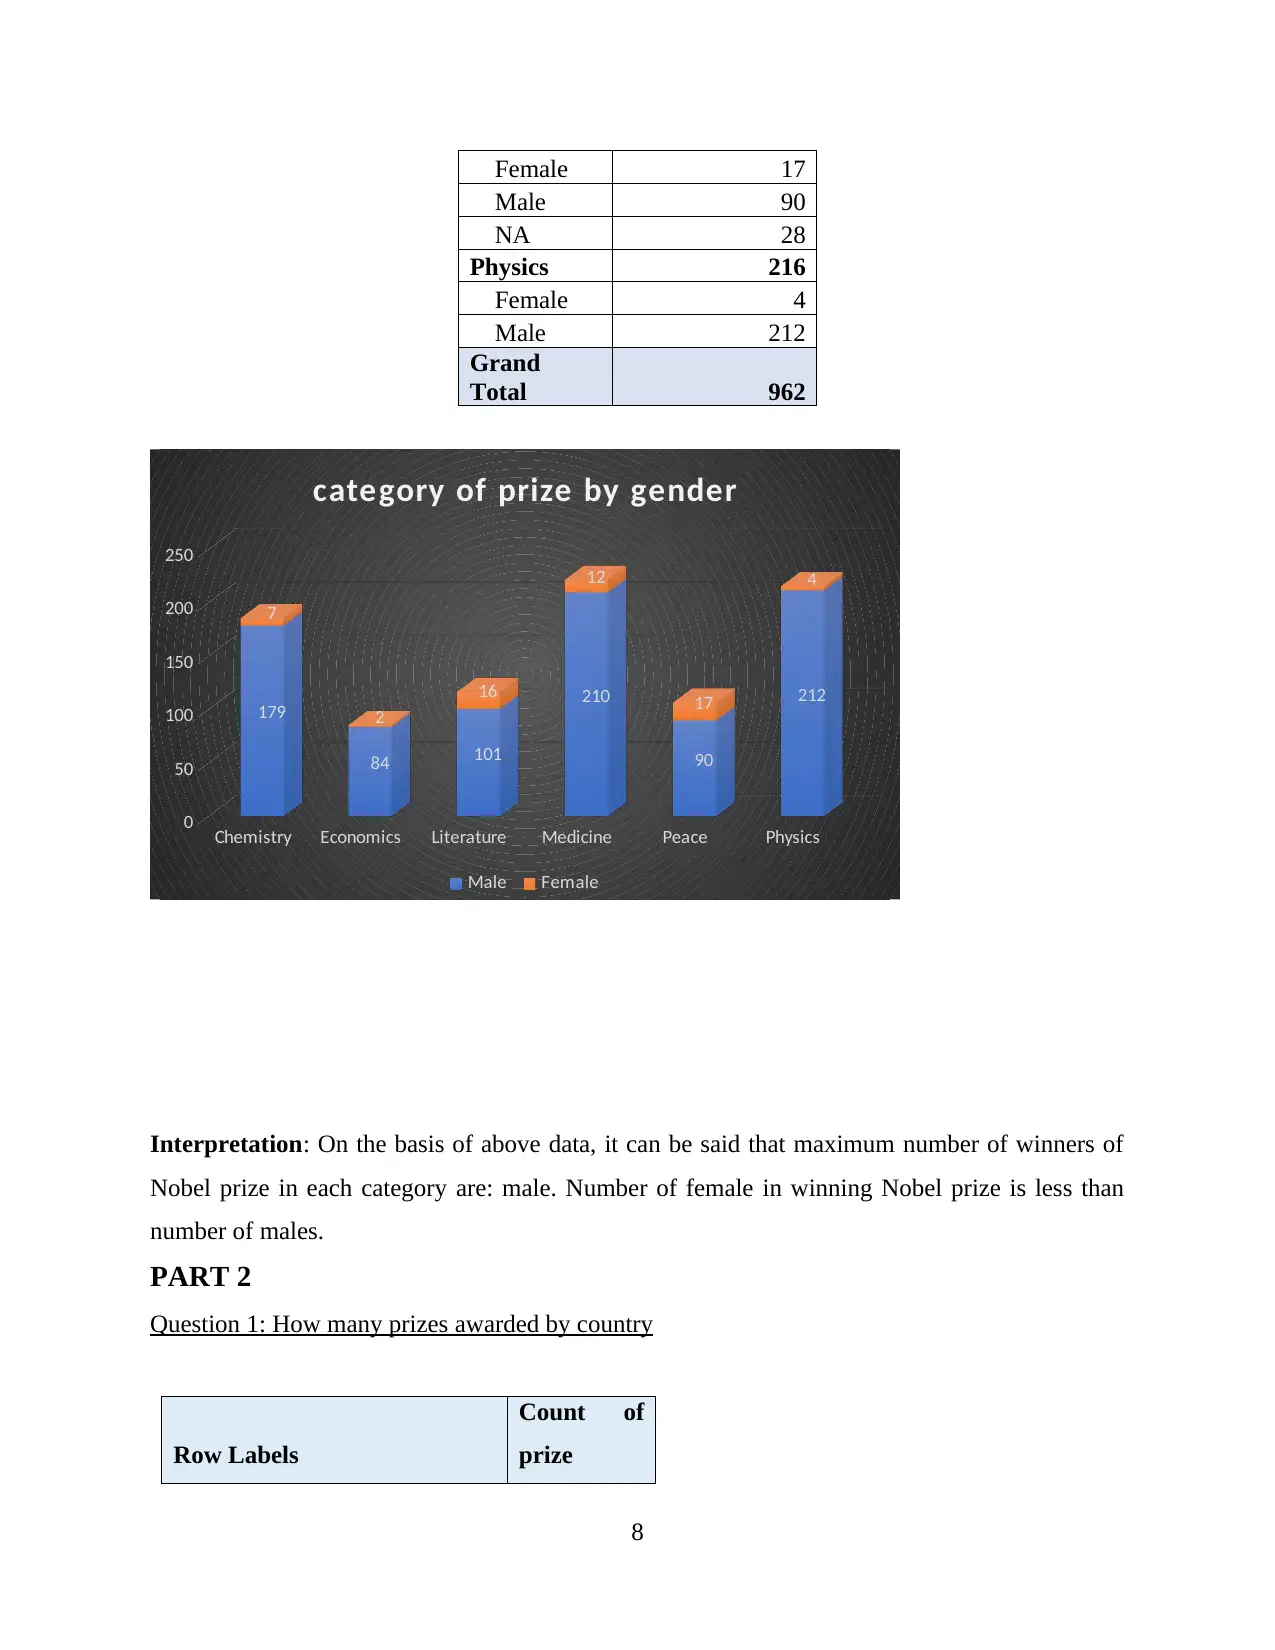
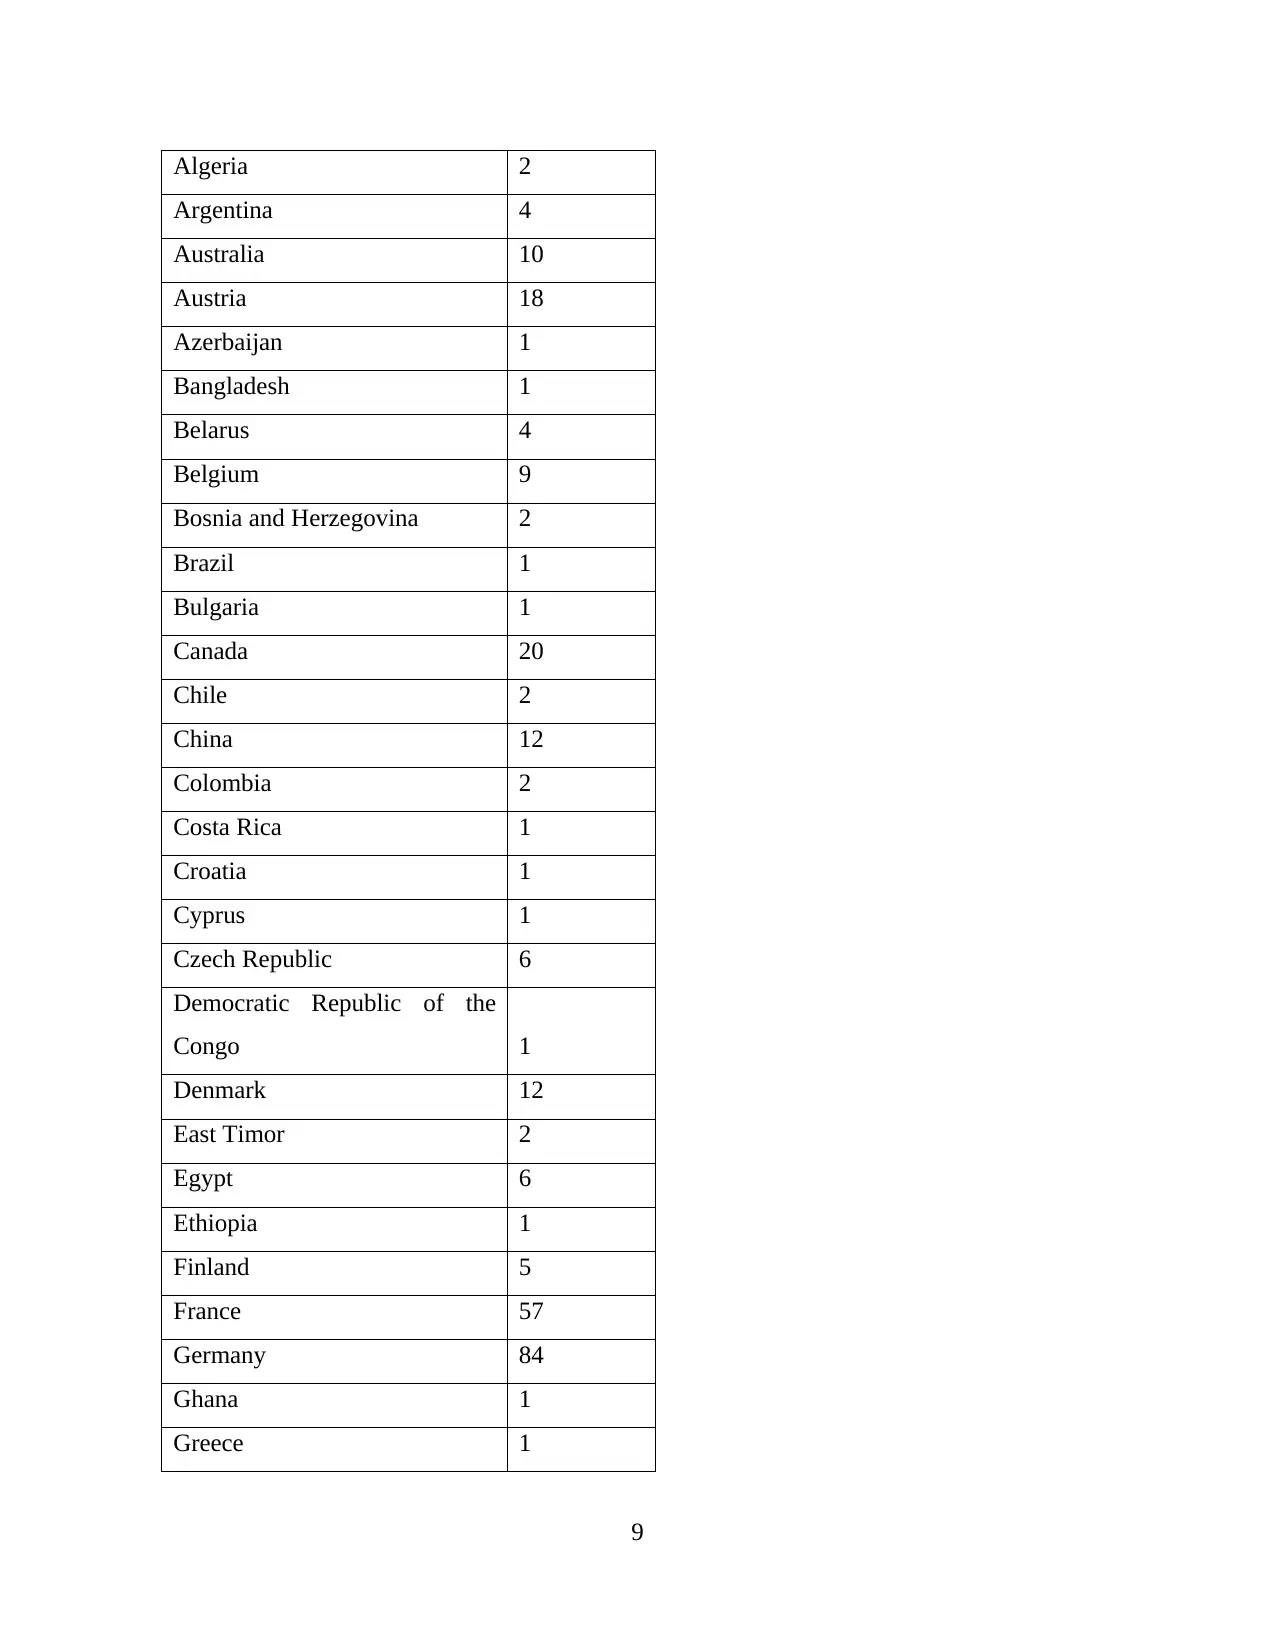
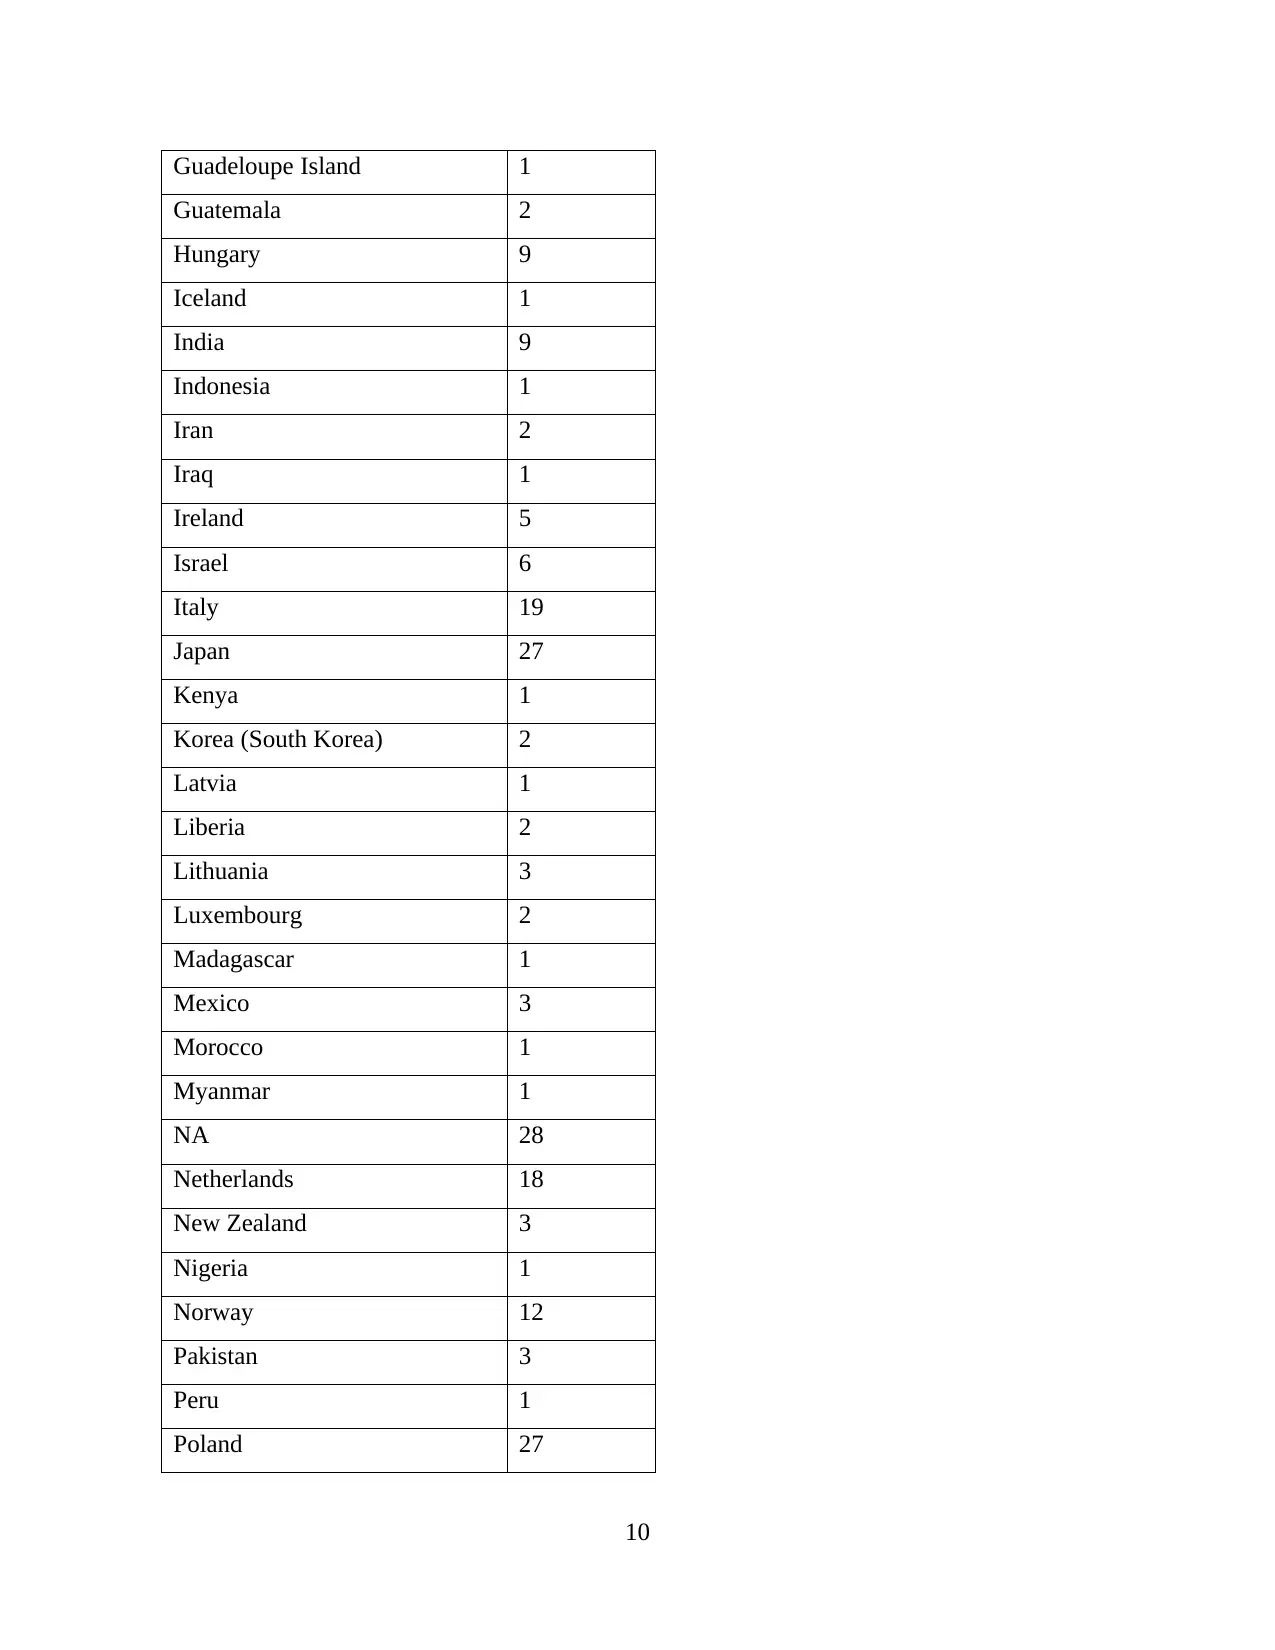
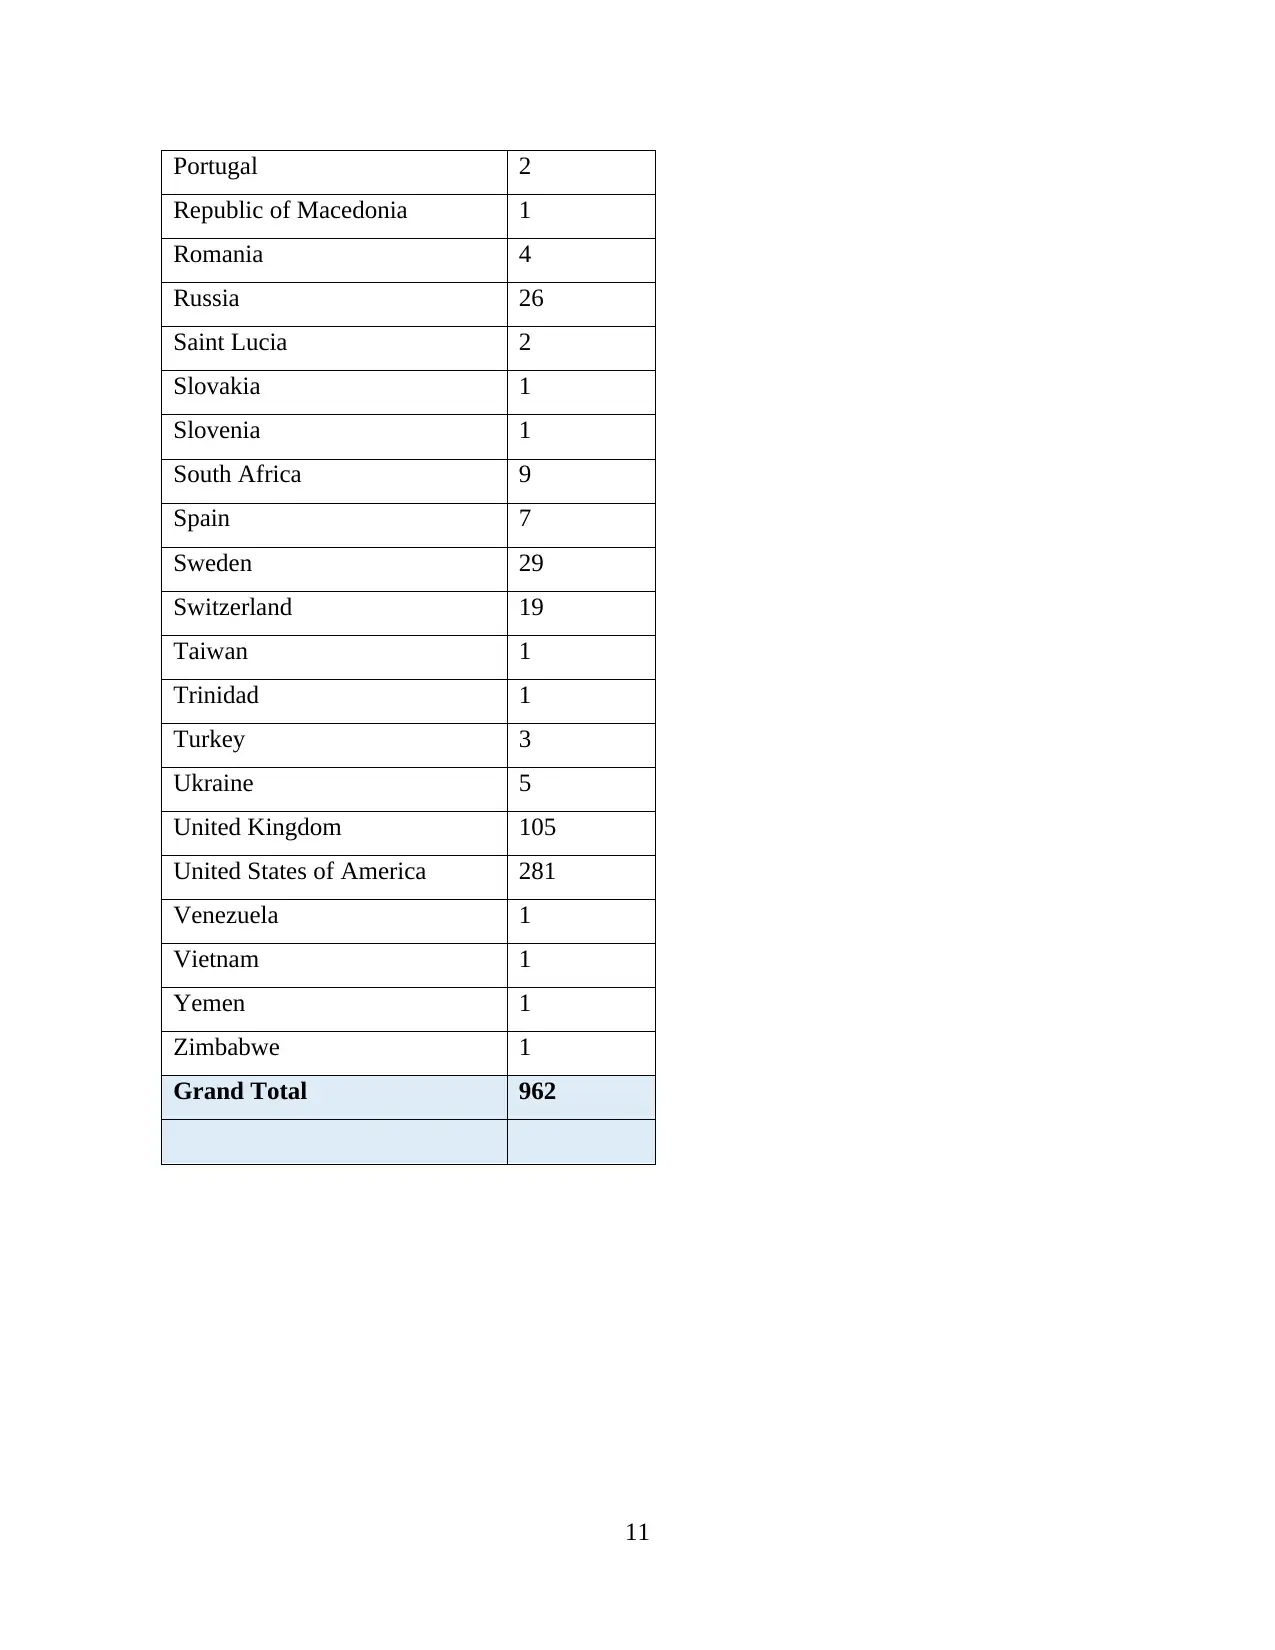
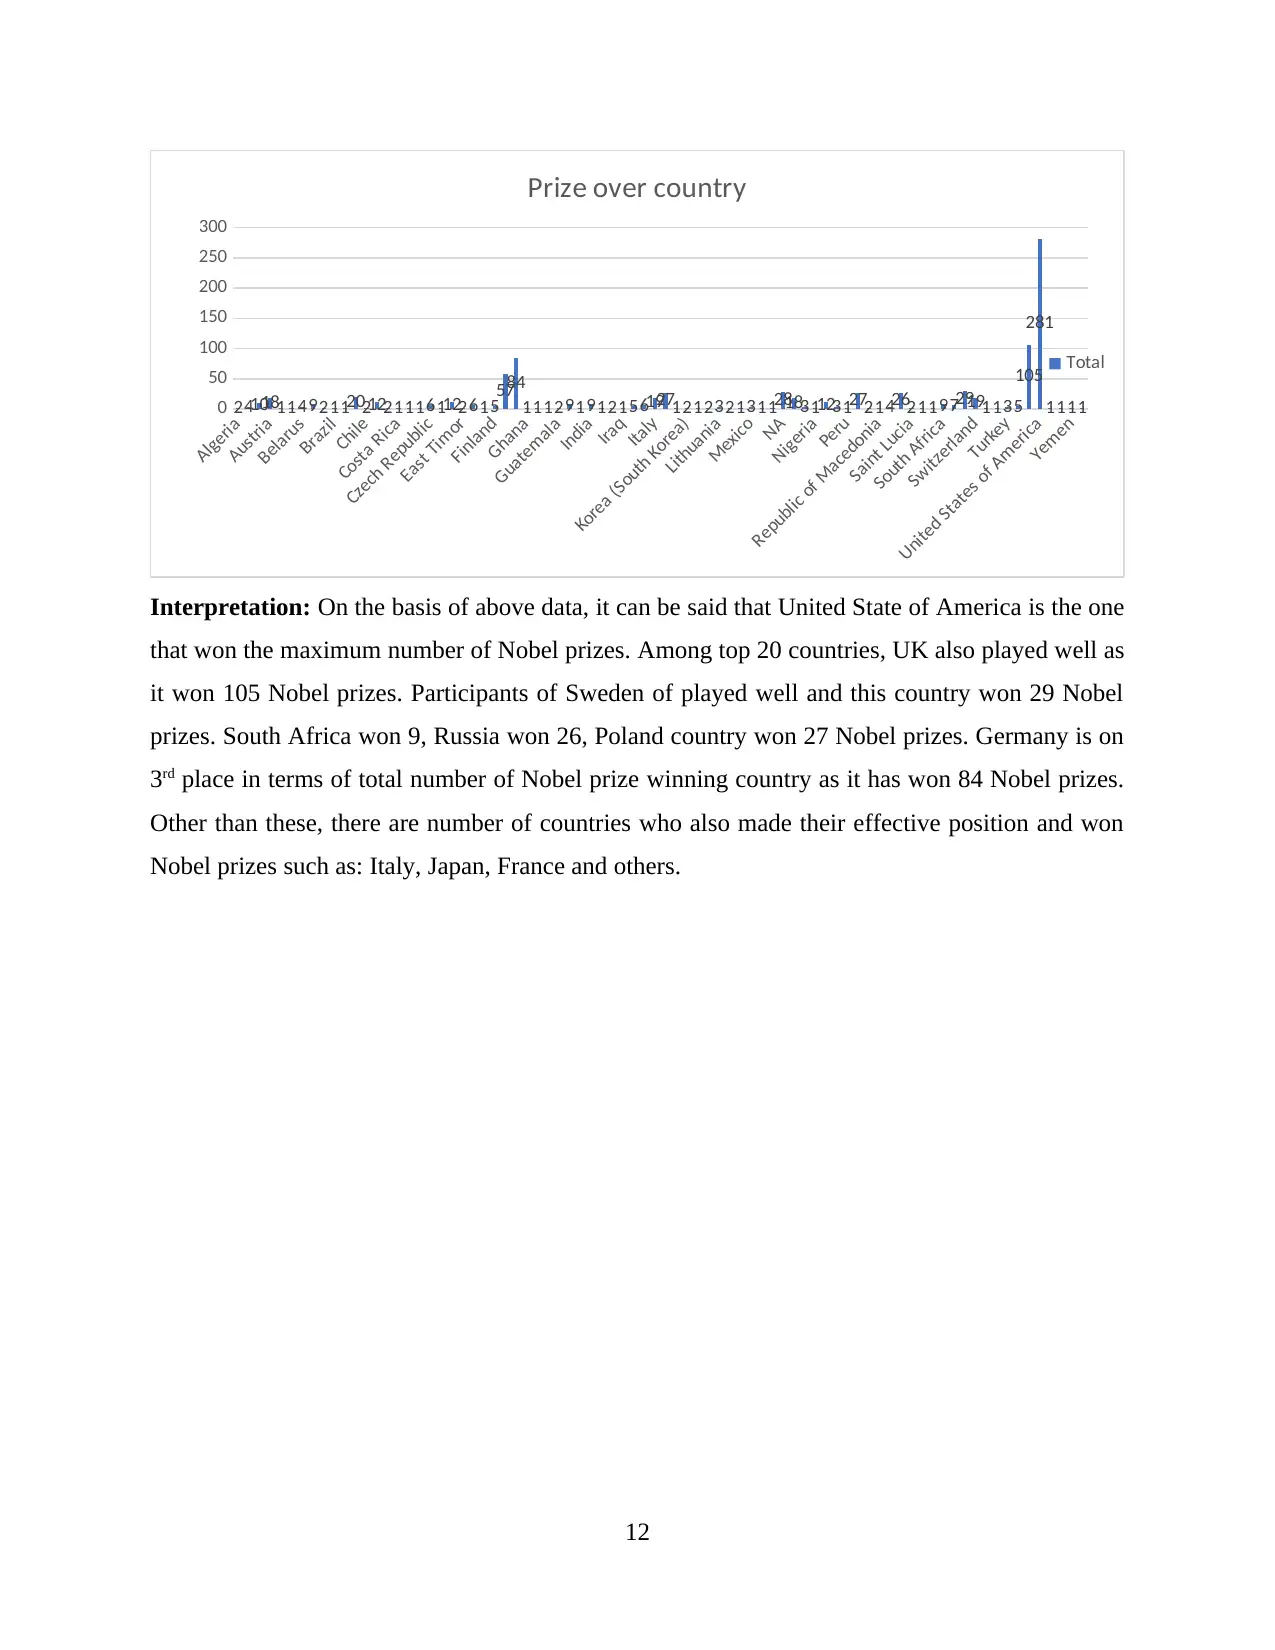
This report analyzes Nobel Prize laureate data to uncover patterns and key factors related to winning. It examines the percentage of female laureates, the distribution of prizes across categories, and the number of prizes awarded per country, with the United States leading. The analysis includes age statistics, identifying the youngest and oldest laureates, and comparing winning ages across different categories using descriptive statistics and T-tests. The report finds the mean age of winners varies by category, with economics having the highest average age. The study uses statistical tools to provide insights into factors influencing Nobel Prize wins and suggests areas for improvement. Desklib provides similar solved assignments for students.
Document Page
Quantitative Methods for
Accounting & Finance
1
tabler-icon-diamond-filled.svg

Paraphrase This Document

Need a fresh take? Get an instant paraphrase of this document with our AI Paraphraser
Document Page
Executive summary
Primary purpose of conducting this report is to uncover patterns in the past Nobel
Laureates and gathering information related to Nobel prize. some appropriate and relevant data is
given on which basis, this study will show numbers of women and men who participated and
won Nobel prize. Their tactics of playing game, reasons and other patterns. It shows some
motivation factors that lead and motivate participants towards wining Nobel prize. It also shows
number of prizes that was awarded by countries and average age of people who won as well as
participated in games for Nobel prize.
2
Document Page
Table of Contents
Executive summary.....................................................................................................................2
MAIN BODY..................................................................................................................................4
Business problem.........................................................................................................................4
Statistical problem.......................................................................................................................4
DATA ANALYSIS.........................................................................................................................4
PART 1............................................................................................................................................4
Question 1: What percentage of the Nobel laureates were women? (pie chart)..........................4
Question 2: How many prizes were given out in each category?................................................5
PART 2............................................................................................................................................8
Question 1: How many prizes awarded by country.....................................................................8
Question 2: Age of the laureate in the year of the ceremony. What are the names of the
youngest and oldest Nobel Laureate?........................................................................................15
PART 3..........................................................................................................................................17
Question 1: How does the winning age at different categories with descriptive statistics........17
Question 2: Average age for Physics with T test.......................................................................18
Question 3: How the age of winners has changed over time.....................................................19
CONCLUSION..............................................................................................................................19
REFERENCES..............................................................................................................................20
APPENDIX................................................................................................................................21
3
Document Page
MAIN BODY
Business problem
Business problem in this case is centred around Australia that wants to know some key
factors of winning Nobel prize. It aims to increase an understanding about ways as how men and
women can improve their performance and key characteristics of country that provided number
of Nobel prizes.
Statistical problem
There are in total 7 questions in which 3 are based on core statistic. In first sector or part 1,
there is general calculation for identifying number of males and females who won Nobel prize.
In 2 part, calculation is based on knowing number of prizes that awarded by country (Liang and
et.al., 2020). In 3 main part, main calculation is mean, mode and median and it may consume too
much of time.
DATA ANALYSIS
PART 1
Question 1: What percentage of the Nobel laureates were women? (pie chart)
Statistics
VAR00001
N Valid 962
Missing 0
VAR00001
Frequency Percent Valid Percent Cumulative
Percent
Valid
Female 58 6.0 6.0 6.0
Male 876 91.1 91.1 97.1
NA 28 2.9 2.9 100.0
Total 962 100.0 100.0
4
tabler-icon-diamond-filled.svg

Paraphrase This Document

Need a fresh take? Get an instant paraphrase of this document with our AI Paraphraser
Document Page
Interpretation: On the basis of above chart, it can clearly be said that number of male were
more than female, who worn Nobel prize in the year of 1901-2020. Out of 962 participants, there
were 876 males who won Nobel prize and number of female were only 58. More than 90% of
participants were male so, it can be said that males are more likely to participate in sports
activities and win prizes.
Question 2: How many prizes were given out in each category?
Statistics
VAR00002
5
Document Page
N Valid 962
Missing 0
VAR00002
Frequency Percent Valid Percent Cumulative
Percent
Valid
Chemistry 186 19.3 19.3 19.3
Economics 86 8.9 8.9 28.3
Literature 117 12.2 12.2 40.4
Medicine 222 23.1 23.1 63.5
Peace 135 14.0 14.0 77.5
Physics 216 22.5 22.5 100.0
Total 962 100.0 100.0
6
Document Page
Chemistry Economics Literature Medicine Peace Physics
0
50
100
150
200
250
186
86
117
222
135
216
category of Prize
Total
Interpretation: In regard to category in which participants won prizes, it can be said that
medicine field is the highest one in which people won prizes. 222 people won prizes in medicine
category. In physics category, 216 people won Nobel prize in past years. 186 people were from
chemistry category. 135 participants were from peace category. 117 people who won Nobel prize
were from literature category. The least number of people on the basis of category was
economics as only 86 people in economics won Nobel prize (Bjørk, 2019).
Row Labels
Count of
category
Chemistry 186
Female 7
Male 179
Economics 86
Female 2
Male 84
Literature 117
Female 16
Male 101
Medicine 222
Female 12
Male 210
Peace 135
7
tabler-icon-diamond-filled.svg

Paraphrase This Document

Need a fresh take? Get an instant paraphrase of this document with our AI Paraphraser
Document Page
Female 17
Male 90
NA 28
Physics 216
Female 4
Male 212
Grand
Total 962
Chemistry Economics Literature Medicine Peace Physics
0
50
100
150
200
250
179
84 101
210
90
212
7
2
16
12
17
4
category of prize by gender
Male Female
Interpretation: On the basis of above data, it can be said that maximum number of winners of
Nobel prize in each category are: male. Number of female in winning Nobel prize is less than
number of males.
PART 2
Question 1: How many prizes awarded by country
Row Labels
Count of
prize
8
Document Page
Algeria 2
Argentina 4
Australia 10
Austria 18
Azerbaijan 1
Bangladesh 1
Belarus 4
Belgium 9
Bosnia and Herzegovina 2
Brazil 1
Bulgaria 1
Canada 20
Chile 2
China 12
Colombia 2
Costa Rica 1
Croatia 1
Cyprus 1
Czech Republic 6
Democratic Republic of the
Congo 1
Denmark 12
East Timor 2
Egypt 6
Ethiopia 1
Finland 5
France 57
Germany 84
Ghana 1
Greece 1
9
Document Page
Guadeloupe Island 1
Guatemala 2
Hungary 9
Iceland 1
India 9
Indonesia 1
Iran 2
Iraq 1
Ireland 5
Israel 6
Italy 19
Japan 27
Kenya 1
Korea (South Korea) 2
Latvia 1
Liberia 2
Lithuania 3
Luxembourg 2
Madagascar 1
Mexico 3
Morocco 1
Myanmar 1
NA 28
Netherlands 18
New Zealand 3
Nigeria 1
Norway 12
Pakistan 3
Peru 1
Poland 27
10
tabler-icon-diamond-filled.svg

Paraphrase This Document

Need a fresh take? Get an instant paraphrase of this document with our AI Paraphraser
Document Page
Portugal 2
Republic of Macedonia 1
Romania 4
Russia 26
Saint Lucia 2
Slovakia 1
Slovenia 1
South Africa 9
Spain 7
Sweden 29
Switzerland 19
Taiwan 1
Trinidad 1
Turkey 3
Ukraine 5
United Kingdom 105
United States of America 281
Venezuela 1
Vietnam 1
Yemen 1
Zimbabwe 1
Grand Total 962
11
Document Page
Algeria
Austria
Belarus
Brazil
Chile
Costa Rica
Czech Republic
East Timor
Finland
Ghana
Guatemala
India
Iraq
Italy
Korea (South Korea)
Lithuania
Mexico
NA
Nigeria
Peru
Republic of Macedonia
Saint Lucia
South Africa
Switzerland
Turkey
United States of America
Yemen
0
50
100
150
200
250
300
2410181149211202122111611226155784
11129191215619271212321311281831123127214262119729191135
105
281
1111
Prize over country
Total
Interpretation: On the basis of above data, it can be said that United State of America is the one
that won the maximum number of Nobel prizes. Among top 20 countries, UK also played well as
it won 105 Nobel prizes. Participants of Sweden of played well and this country won 29 Nobel
prizes. South Africa won 9, Russia won 26, Poland country won 27 Nobel prizes. Germany is on
3rd place in terms of total number of Nobel prize winning country as it has won 84 Nobel prizes.
Other than these, there are number of countries who also made their effective position and won
Nobel prizes such as: Italy, Japan, France and others.
12
chevron_up_icon
1 out of 52
circle_padding
hide_on_mobile
zoom_out_icon
[object Object]