Financial Performance Analysis of TUI Travel PLC Report
VerifiedAdded on 2020/02/05
|12
|3265
|63
Report
AI Summary
This report provides a financial analysis of TUI Travel PLC, a UK-based travel group. It examines the company's operations, users of its financial statements, and key financial ratios. The report focuses on profitability, liquidity, and solvency ratios over a five-year period. Profitability ratios, including gross profit, net profit, and operating profit margins, are analyzed to assess TUI's operational performance. Liquidity ratios, such as current and quick ratios, are evaluated to determine the company's ability to meet short-term obligations. Solvency ratios, including the debt-to-equity ratio, are assessed to gauge the company's long-term financial stability. The analysis reveals trends in TUI's financial performance, highlighting areas of strength and weakness. The report concludes with an overall assessment of TUI Travel PLC's financial health and provides insights into its performance within the travel industry.

ACCOUNTING
Paraphrase This Document
Need a fresh take? Get an instant paraphrase of this document with our AI Paraphraser
Table of Contents
INTRODUCTION......................................................................................................................3
TUI Travel PLC's operations............................................................................................3
Users of TUI travel PLC..................................................................................................4
Financial statement analysis of TUI Travel PLC..............................................................5
CONCLUSION .........................................................................................................................8
REFERENCES...........................................................................................................................9
APPENDIX..............................................................................................................................11
INTRODUCTION
Every business organization is required to prepare necessary accounts to measure
their performance on a regular basis. It is the process of recording all business transactions in
an appropriate manner. Income statement and balance sheet are two major statements
prepared as financial statements of the business. The main purpose of profit and loss account
is o find out business profits while balance sheet prepares to determine organization’s
financial status.. By using this statement, mangers of the company will able to evaluate and
examine organization’s performance and will take effective decisions to resolve the issues.
Present project report will help to analyse financial performance of TUI Travel PLC through
ratio analysis method.
TUI Travel PLC's operations
TUI travel PLC is a UK based travel Group Company which was founded in the year
2007 and it is listed on London Stock Exchange (LSE). It was established through merger of
First Choice Holidays and Tourism division of TUI AG. It serves customers at global market
and provides travelling services to large number of customers. Headquarter of TUI was
established in Crawley, West Sussex, UK. It has two subsidiaries that are Thomson Airways
and Thomson Holidays. It is operating in 180 countries over the world while main operations
are in Central Europe, Northern Europe and Western Europe. It was established to fulfil its
vision that is about to make travel experience for the consumers and ensure business
sustainability. It mainly operates in three categories that are as under:
Mainstream
Accommodation and Destination
Specialist and Activity
Thus, it provides accommodation through hotels, motels. Travel industry is one of the
fastest growing industries that make high contribution to government revenues in UK. That is
the most important reason for selecting TUI Travel PLC for the present report. . Travelling
organizations plays a major role in attracting large number of tourists of the countries and
enlarge their revenues. it. It will increase foreign currency revenue and it will help in
economic growth. In UK, TUI is one of the largest travel companies that are operating
worldwide. It is serving consumers at each and every destination so that travellers will feel
better and highly satisfied..
⊘ This is a preview!⊘
Do you want full access?
Subscribe today to unlock all pages.
Trusted by 1+ million students worldwide
Users of TUI travel PLC
Users are the individual who are directly or indirectly affected by the TUI's operation
and have some kind of interest in company’s performance. TUI travel PLC has various
ranges of internal as well as external users. Internal users are the persons who are available
inside the organization and are directly affected by the operations while external users are
outsiders which are described below;
Internal users: Employees and managers are some of the internal users of TUI travel PLC
Employees: Workers plays a major role in TUI's success because they provide travel
based services to their travellers. Their aim is to get high salary, reward, appraisal and other
monetary awards. They use profit and loss account to determine business information. It is
because high growth in revenue and profitability helps in fulfilling objectives and vice versa
(Healy and Palepu, 2012). Moreover, they require safe and hazard free working environment,
training and development program to improve their skills and work based knowledge.
Managers: Managing directors, board of directors and departmental managers are the
individual who manages overall functioning of TUI. Therefore, they use income statement to
examine revenues and expenses and try to maximize their profits. On the other hand, balance
sheet assists in analyzing financial health in relation to solvency, efficiency, liquidity and
others (Schweisfurth and Herstatt, 2016). Moreover, cash flow statement is used to measure
the changes between reported cash balances at two different balance sheet dates. They take
decisions and formulate operating policies so as to improve potential performance.
External users: Lenders, customers, government, competitors, investors and creditors are the
external users of TUI Group. They have different purpose and need various types of
information from company's financial statement. Out of these, some of the external users are
explained below:
Lenders: Lenders are the persons who lend their own money to TUI and mitigate their
financial requirements. Their main purpose is to get regular amount of interest on their funds.
Moreover, they desire to secure their money by keeping business assets as security. For
instance, bank demand collateral security on the funds provided on loans so that funds will be
secured. They need information about TUI's performance and financial strength. Henceforth,
they analyse business profitability through profit and loss account. However, they also
determine TUI's capital structure and interest bearing capacity to take decisions that how
much money can be given to the organization (ALLINI and et.al., 2015). Moreover, they
Paraphrase This Document
Need a fresh take? Get an instant paraphrase of this document with our AI Paraphraser
measure cash flow capacity to assess that if TUI is able to pay timely interest to the lenders or
not. It will help in taking better quality of lending decisions and funds security.
Investors: Investors are the person who invests funds in the form of share capital.
They take risk by investing in the TUI group and their main purpose is to maximize their
return. Both the current and potential investors who are planning to invest funds in TUI come
under this group. They acquire information through profit and loss account and balance sheet
to analyse risk and reward relationship (Pratt, 2013). They analyse profitability, leverage and
solvency position of TUI. Moreover, cash flow statement provides information about cash
generating ability to ensure regular dividend return. Moreover, stock market price, earning
per share and dividend growth helps to satisfy investor’s objectives to a great extent
(Susnienė and Vanagas, 2015).
Creditors: The individual who supplies goods or material at credit are known as
creditors. Their main purpose is to ensure safety of their credit. Therefore, they gather
information in relation to TUI's credit worthiness, working capital management, profitability
and cash generating ability. High liquidity and better profit earning organization will attract
large number of creditors on their own credit terms.
Government: It collects tax earnings on TUI's profits to ensure economic growth and
development. Therefore, their main purpose is to gather regular tax income. They acquire
information about profits to compute firm's tax obligations and match it with the filled return
by them. In case of inappropriate payments, government charges penalties and other kind of
law suits. Moreover, they analyse business functioning to make policies in relation to
industrial development. This in turn, UK government can ensure high economic growth and
development.
Financial statement analysis of TUI Travel PLC
TUI Travel PLC's accountants prepare profitability statement and balance sheet to
determine their profits and financial status. Profit and loss account combines all the revenues
and expenditures while balance sheet includes firm's assets and liabilities (Albu and Albu,
2012).
Ratio analysis: It is a method to evaluate TUI's historical performance. In this method,
various kinds of ratios such as profitability, liquidity, efficiency and solvency ratio can be
computed to assess company's operational results and financial strength. With reference to
TUI Group, ratio analysis has been carried out for the past five years which is hereunder:
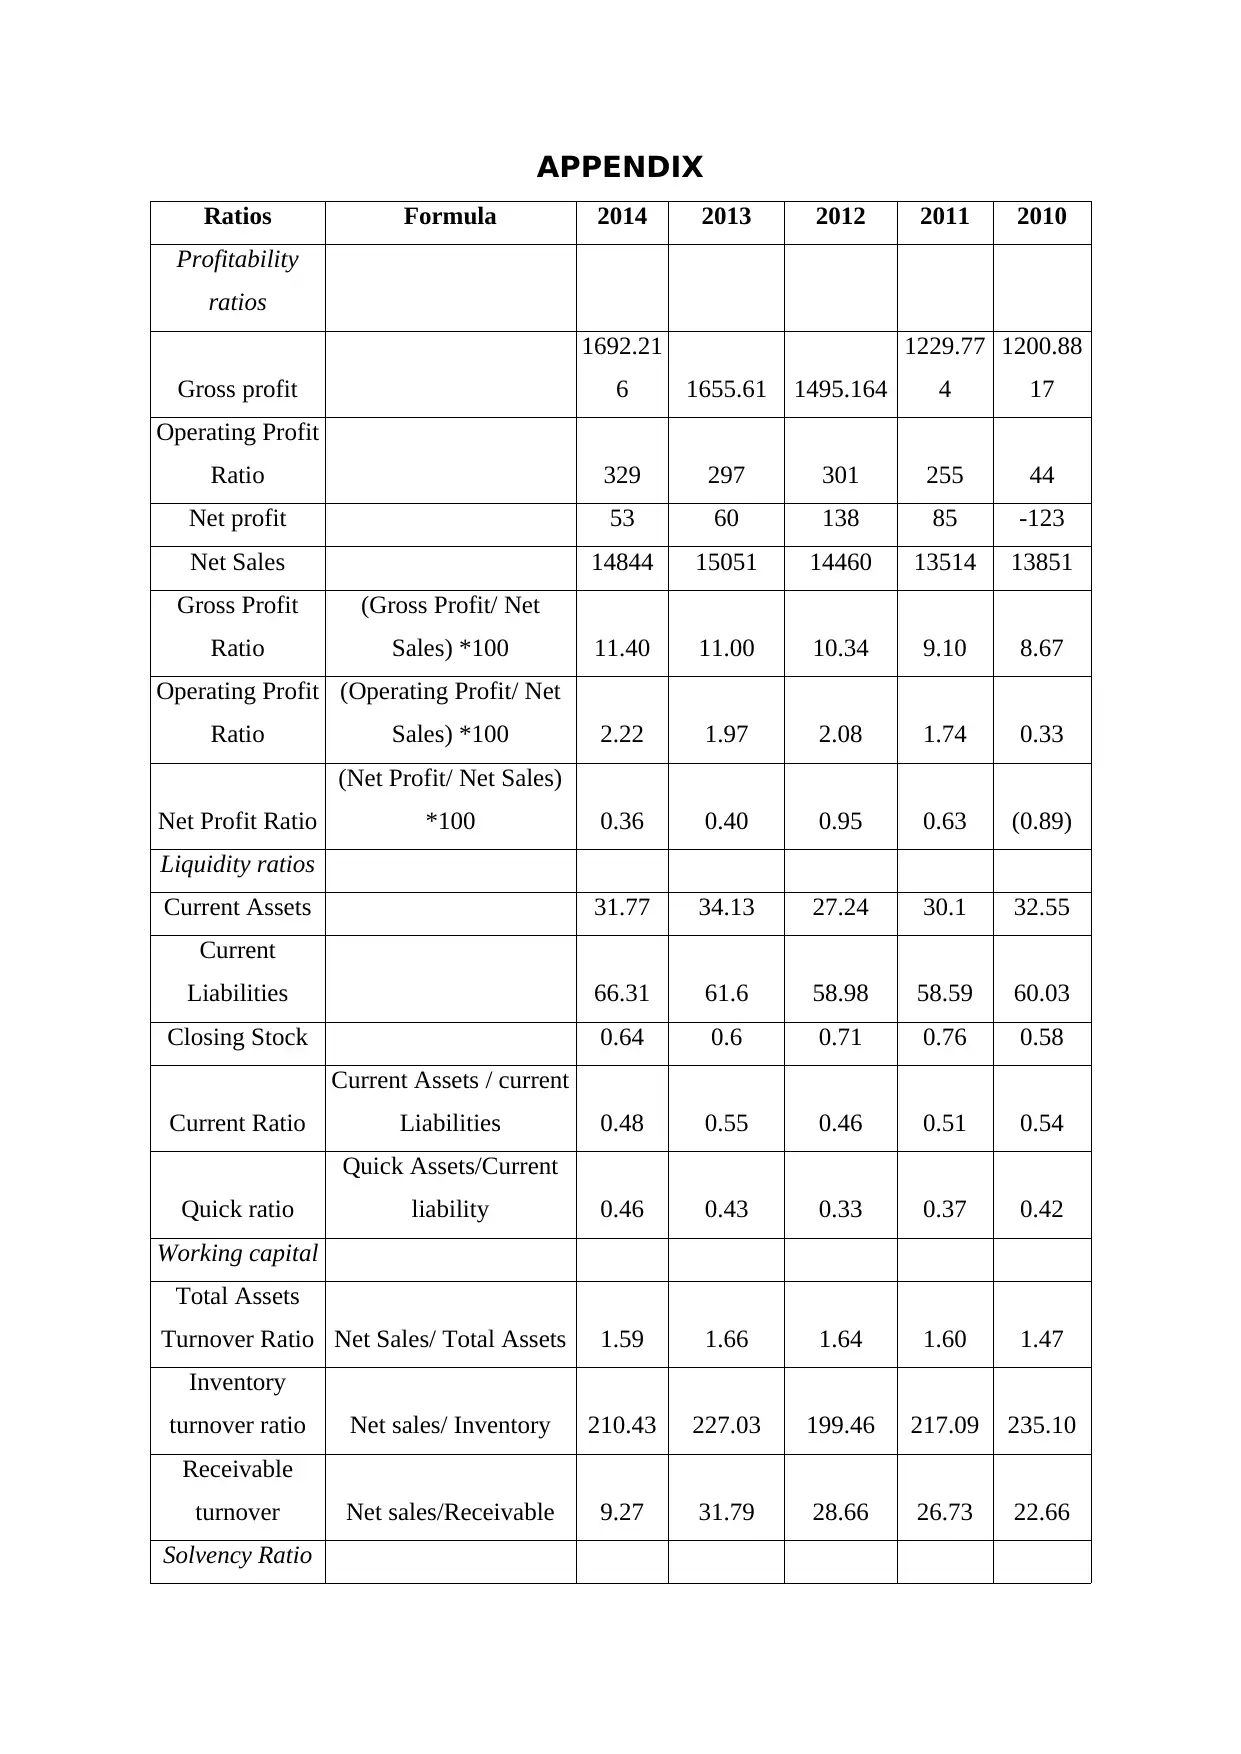
Profitability ratios: As its name, this kind of ratios helps to analyse and evaluate TUI's
operational performance. There are various kinds of profitability ratios such as gross profit,
net profit, operating profit, return on equity and return on capital employed.
Gross profit ratio (GP): GP is the excess of total sales revenues over cost of goods
sold. In 2010, TUI's GP was 8.67 which turned out to 11.40 in 2014. Upward moving trend
says that TUI is earning high GP due to larger sales and lower costs. High travellers demand
and higher product prices may be the reasons behind this (Bragg, 2012). Thus, it is a good
sign of TUI's operating activities because it says that TUI is receiving larger profits on their
total sales revenues.
Net profit (NP): NP is the difference between gross profit and total operating
expenses. In context to TUI, it has been moved in favourable direction because in 2010, it
was having loss of 0.89% that is turned to profit of 0.63%, in 2014. Thus, it is a good sign
because it tells that TUI converted their net loss in a favourable direction and earned profits
to 0.36%. It took place because of higher sales and lower operating expenses (Wagenhofer,
2015).
Operating profit margin (OP): TUI's OP ratio got inclined from 0.33 to 2.22 which
shows a significantly increase. High operational income and lower expenses are the reasons
for high operational profits and it is a good sign of TUI's operational performance.
Liquidity ratios: It determines TUI's ability to pay off short term liabilities such as creditors,
overdraft and other accounts payables.
Current ratio (CR): It identifies the relationship between TUI's current assets (CA)
and current liabilities (CL) while the difference between both the CA and CL is known as
working capital (WC). With reference to TUI, its CR decreased from 0.54 to 0.48; hence, it is
not a good sign. It may be caused because of lower current assets and high current liability.
Another reason is that TUI takes a long period to convert its stock into cash (Perinpanathan,
2015). In other words, TUI's cash is stuck in its inventory henceforth, TUI is not able to
gather cash and discharge their short term obligations in an effective manner. Current assets
and current liabilities chart is presented here:
⊘ This is a preview!⊘
Do you want full access?
Subscribe today to unlock all pages.
Trusted by 1+ million students worldwide
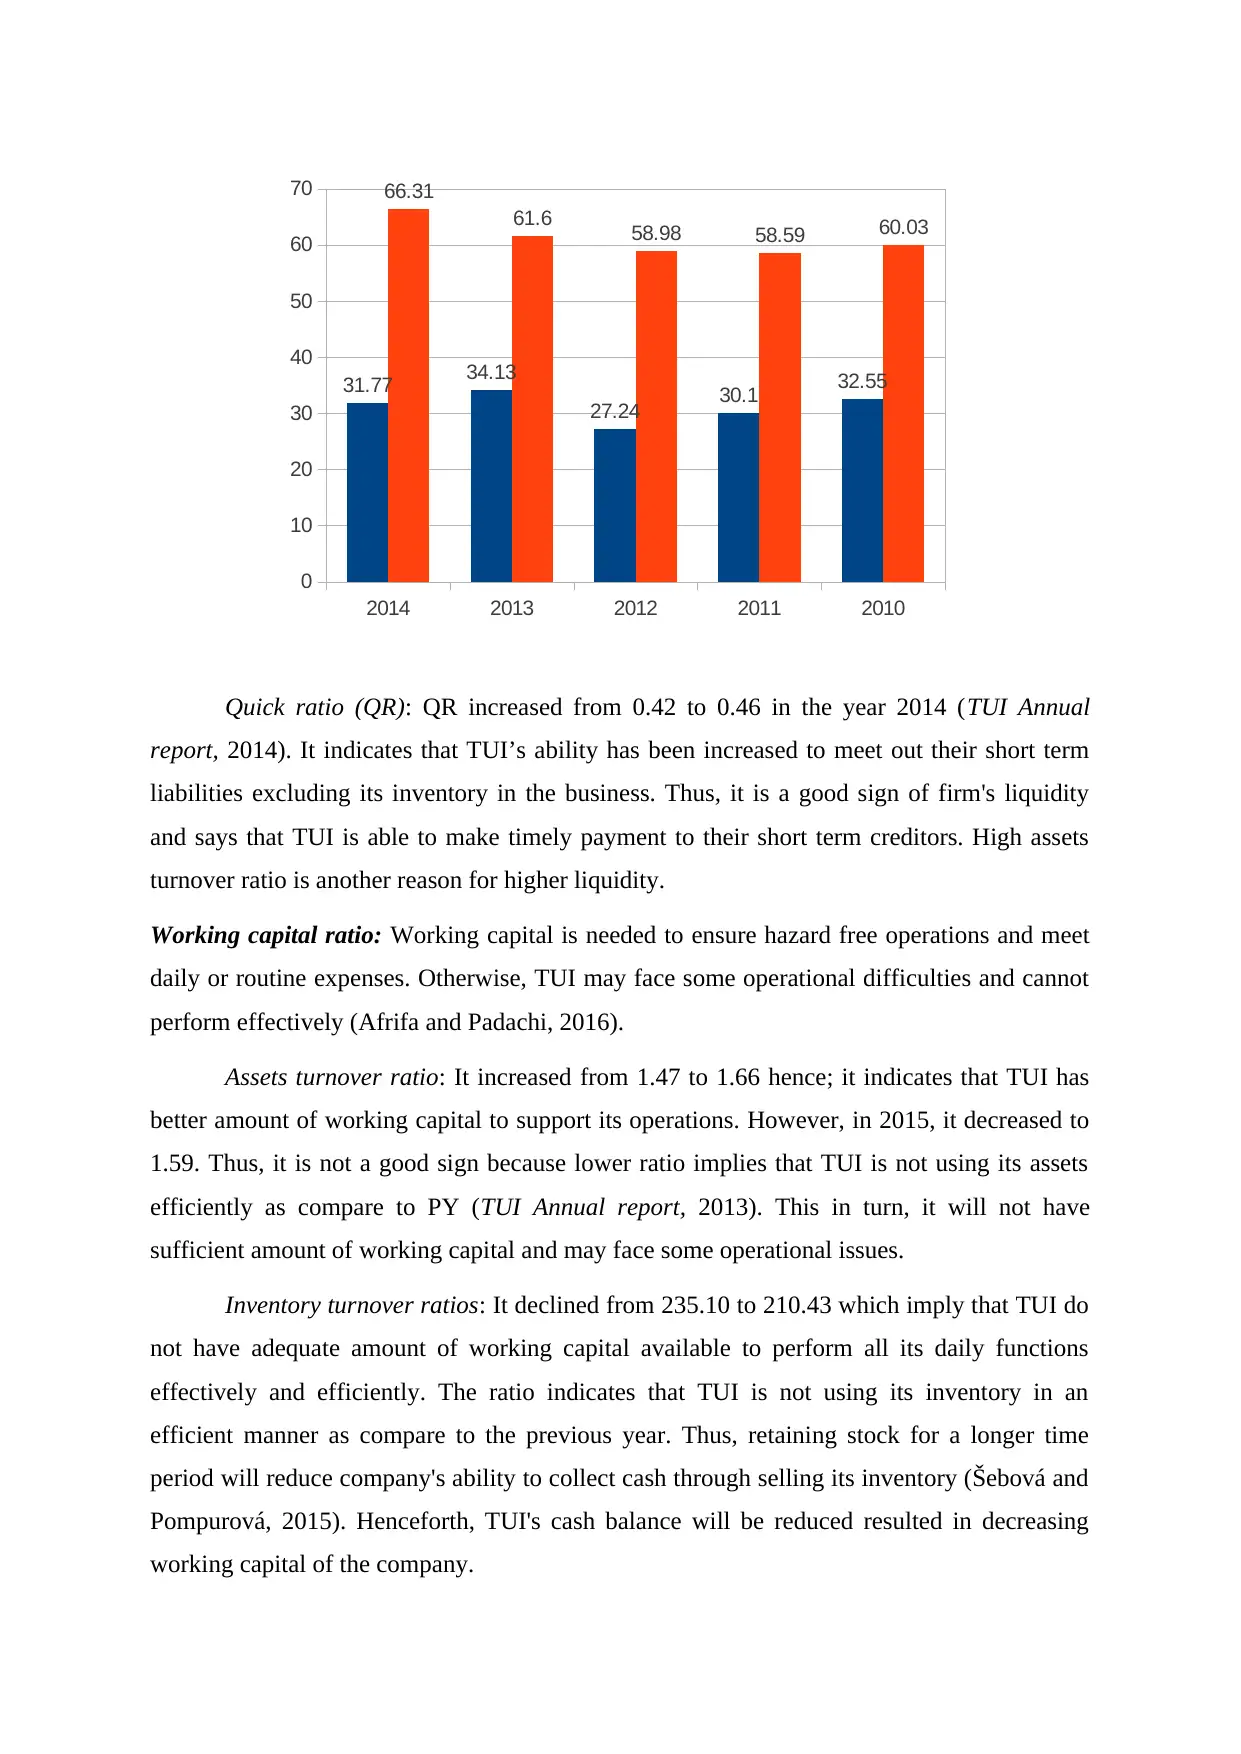
Quick ratio (QR): QR increased from 0.42 to 0.46 in the year 2014 (TUI Annual
report, 2014). It indicates that TUI’s ability has been increased to meet out their short term
liabilities excluding its inventory in the business. Thus, it is a good sign of firm's liquidity
and says that TUI is able to make timely payment to their short term creditors. High assets
turnover ratio is another reason for higher liquidity.
Working capital ratio: Working capital is needed to ensure hazard free operations and meet
daily or routine expenses. Otherwise, TUI may face some operational difficulties and cannot
perform effectively (Afrifa and Padachi, 2016).
Assets turnover ratio: It increased from 1.47 to 1.66 hence; it indicates that TUI has
better amount of working capital to support its operations. However, in 2015, it decreased to
1.59. Thus, it is not a good sign because lower ratio implies that TUI is not using its assets
efficiently as compare to PY (TUI Annual report, 2013). This in turn, it will not have
sufficient amount of working capital and may face some operational issues.
Inventory turnover ratios: It declined from 235.10 to 210.43 which imply that TUI do
not have adequate amount of working capital available to perform all its daily functions
effectively and efficiently. The ratio indicates that TUI is not using its inventory in an
efficient manner as compare to the previous year. Thus, retaining stock for a longer time
period will reduce company's ability to collect cash through selling its inventory (Šebová and
Pompurová, 2015). Henceforth, TUI's cash balance will be reduced resulted in decreasing
working capital of the company.
2014 2013 2012 2011 2010
0
10
20
30
40
50
60
70
31.77 34.13
27.24 30.1 32.55
66.31
61.6 58.98 58.59 60.03
Paraphrase This Document
Need a fresh take? Get an instant paraphrase of this document with our AI Paraphraser

Receivable turnover ratios: It inclined from 22.66 to 31.79 in the year
2013 .However, in 2014.it shows a significant decrease as it reduced to 9.27. It indicates that
TUI is not receiving cash quickly from their debtors comparatively to previous years. This in
turn, TUI's available cash balance has been reduced.
Solvency ratios: It measures TUI's ability to pay off their long term business obligations on
time (Xia, Fei and Liu, 2015). Debt equity chart is presented here:
TUI's debt equity ratio inclined from 0.40 to 1.21. Increasing trend of D/E ratio
imposes high financial risk. It has increased because of high use of debt and repayment to
equity. In the year 2014, debt and equity were amounted to 12.22 and 10.09. Thus, extensive
use of debt imposes liability to pay regular interest to the lenders which resulted in higher
financial risk.
CONCLUSION
From this report, it can be concluded that, financial accounting determine TUI's
performance and financial position. Moreover, it satisfies various users’ information need
through providing authentic and valid information. Financial statement analysis concluded
that TUI's operational performance is good because of increased profitability. On the
contrary, declining trend of liquidity concluded that TUI is unable to meet their short term
liabilities effectively. Another, decreased working capital affects TUI's operation adversely.
In addition to it, solvency ratio concluded that TUI is unable to meet its long term
obligations. Therefore, it can be said that TUI's management should formulate necessary
1 2 3 4 5
0
5
10
15
20
25
12.22
7.97 8.04 8.86 8.57
10.09
15.22
18.15
20.85 21.27

policies and take strategic decisions to improve potential performance. This in turn, TUI will
be able to ensure long term sustainability.
be able to ensure long term sustainability.
⊘ This is a preview!⊘
Do you want full access?
Subscribe today to unlock all pages.
Trusted by 1+ million students worldwide
REFERENCES
Books and Journals
Afrifa, G.A. and Padachi, K., 2016. Working capital level influence on SME profitability.
Journal of Small Business and Enterprise Development. 23(1).
Albu, N. and Albu, C.N., 2012. International Financial Reporting Standards in an emerging
economy: lessons from Romania. Australian Accounting Review. 22(4). pp. 341-352.
ALLINI, A. and et.al., 2015. Discussing the usefulness of Fair Value from the lenders’
perspective. WSEAS TRANSACTIONS ON BUSINESS AND ECONOMICS. 12. pp.
198-210.
Bragg, S.M., 2012. Business ratios and formulas: a comprehensive guide.. John Wiley &
Sons.
Healy, P. and Palepu, K., 2012. Business Analysis Valuation: Using Financial Statements.
Cengage Learning.
Perinpanathan, R., 2015. Using Altman's Model and Current Ratio to Assess the Financial
Distress of Listed Companies in the Default Board of Colombo Stock Exchange.
Scientific Research Journal (SCIRJ). 3.
Pratt, J., 2013. Financial accounting in an economic context. Wiley Global Education.
Schweisfurth, T.G. and Herstatt, C., 2016. How internal users contribute to corporate product
innovation: the case of embedded users. R&D Management. 46(S1). pp. 107-126.
Šebová, Ľ. and Pompurová, K., 2015. FINANCIAL SITUATION OF THE
ACCOMMODATION AND HOSPITALITY SERVICES SECTOR IN SLOVAKIA
IN THE YEARS 2009-2013. Czech Hospitality & Tourism Papers. 11(24).
Susnienė, D. and Vanagas, P., 2015. Development of Stakeholder Relationships by
Integrating Their Needs into Organization’s Goals and Objectives. Engineering
economics. 48(3). pp. 88-93.
Wagenhofer, A., 2015. Usefulness and implications for financial accounting. The Routledge
Companion to Financial Accounting Theory. p. 341.
Xia, D.F., Fei, W.Y. and Liu, H.J., 2015. Estimating the shareholder’s terminal payoff based
on insurer’s solvency ratio in mixed fractional Brownian market. Applied
Mathematics-A Journal of Chinese Universities. 30(3). pp. 317-324.
Online
TUI Annual report, 2013. [Pdf]. Available through:
<https://www.tuigroup.com/damfiles/default/ir/31_Geschaeftsbericht_2012_13/
downloads/TUI_AR_2012-13_English-5ddf620bfb92bb62c37948c37dfc6354.pdf>.
[Accessed on 16th March, 2016].
Paraphrase This Document
Need a fresh take? Get an instant paraphrase of this document with our AI Paraphraser

TUI Annual report, 2014. [Pdf[. Available through;
<http://www.tuitravelplc.com/system/files/uploads/financialdocs/TUI_Travel_PLC_A
RA_2014_single_interactive.pdf>. [Accessed on 16th March, 2016].
<http://www.tuitravelplc.com/system/files/uploads/financialdocs/TUI_Travel_PLC_A
RA_2014_single_interactive.pdf>. [Accessed on 16th March, 2016].
APPENDIX
Ratios Formula 2014 2013 2012 2011 2010
Profitability
ratios
Gross profit
1692.21
6 1655.61 1495.164
1229.77
4
1200.88
17
Operating Profit
Ratio 329 297 301 255 44
Net profit 53 60 138 85 -123
Net Sales 14844 15051 14460 13514 13851
Gross Profit
Ratio
(Gross Profit/ Net
Sales) *100 11.40 11.00 10.34 9.10 8.67
Operating Profit
Ratio
(Operating Profit/ Net
Sales) *100 2.22 1.97 2.08 1.74 0.33
Net Profit Ratio
(Net Profit/ Net Sales)
*100 0.36 0.40 0.95 0.63 (0.89)
Liquidity ratios
Current Assets 31.77 34.13 27.24 30.1 32.55
Current
Liabilities 66.31 61.6 58.98 58.59 60.03
Closing Stock 0.64 0.6 0.71 0.76 0.58
Current Ratio
Current Assets / current
Liabilities 0.48 0.55 0.46 0.51 0.54
Quick ratio
Quick Assets/Current
liability 0.46 0.43 0.33 0.37 0.42
Working capital
Total Assets
Turnover Ratio Net Sales/ Total Assets 1.59 1.66 1.64 1.60 1.47
Inventory
turnover ratio Net sales/ Inventory 210.43 227.03 199.46 217.09 235.10
Receivable
turnover Net sales/Receivable 9.27 31.79 28.66 26.73 22.66
Solvency Ratio
⊘ This is a preview!⊘
Do you want full access?
Subscribe today to unlock all pages.
Trusted by 1+ million students worldwide
1 out of 12
Related Documents


Your All-in-One AI-Powered Toolkit for Academic Success.
+13062052269
info@desklib.com
Available 24*7 on WhatsApp / Email
![[object Object]](/_next/static/media/star-bottom.7253800d.svg)
Unlock your academic potential
Copyright © 2020–2026 A2Z Services. All Rights Reserved. Developed and managed by ZUCOL.