Business Decision Making in New Tour Product Development: TUI Group
VerifiedAdded on 2023/04/04
|18
|3630
|456
Report
AI Summary
This report examines the business decision-making processes within TUI Group as it plans to introduce a new tour package. It details the collection of primary and secondary data, including a survey of 90 customers, and employs statistical tools such as central tendency, dispersion, and correlation-coefficient for analysis. The report summarizes raw data in spreadsheets, analyzes market trends, and uses dispersion measurements to develop the new tour. It also explains the application of quartile, percentile, and correlation coefficient, and provides graphical presentations and trend lines to forecast demand for 2017 and 2018. Furthermore, the report includes a business presentation and a formal business report outlining the proposed new product development initiatives, the use of information processing tools, a project plan, and financial tools for viable investment decisions. The analysis indicates volatile sales trends and suggests that a unique tour package is necessary to attract more visitors and stabilize revenues.

BUSINESS DECISION-
MAKING
MAKING
Paraphrase This Document
Need a fresh take? Get an instant paraphrase of this document with our AI Paraphraser


Table of Contents
INTRODUCTION................................................................................................................................3
TASK 1..............................................................................................................................................3
1.1 Plan for the collection of primary and secondary data.........................................................3
1.2 Survey methodology and sampling frame.............................................................................4
1.3Designing a questionnaire to carry out the survey................................................................4
TASK 2..............................................................................................................................................6
2.1 Creating information by summarizing the raw data in spreadsheet.....................................6
2.2 Analyzing the results to aid in solid decision-making with regards to the market...............7
2.3 Analysis of the data using measurement of dispersion to develop the new tour................8
2.4 Explaining the use of quartile, percentile and correlation coefficient..................................9
TASK 3............................................................................................................................................10
3.1 Graphical presentation and charts......................................................................................10
3.2 Create a trend line in spreadsheet and its use to forecast demand for 2017 & 2018........11
3.3 Preparing a business presentation based on your analysis.................................................12
3.4 Produce a formal business report for the proposed new product development initiatives
...................................................................................................................................................12
TASK 4............................................................................................................................................13
4.1 Use of appropriate information processing tools...............................................................13
4.2 Preparation of a project plan using appropriate software..................................................14
4.3 Use of financial tools to take viable investment decisions.................................................14
CONCLUSION.................................................................................................................................15
REFERENCES...................................................................................................................................17
⊘ This is a preview!⊘
Do you want full access?
Subscribe today to unlock all pages.
Trusted by 1+ million students worldwide

INTRODUCTION
In the competitive corporate scenario, businesses success is greatly depends upon the
solid, rationalized and effective quality of business decisions. Before making any decision,
managers are responsible to search out all the possible solutions and analyze each & every
alternative to select the best course of alternatives or actions to combat hurdles and fuel growth.
The thrust of the current research is to investigate the effectiveness of business decisions in the
growth of a leading tour operator, TUI Group. It is a multinational tour operator which design
luxurious tours for providing the best leisure services, accommodation, hotels, airlines, cruises &
others for giving the best holiday experience to the visitors. It has gained a strong brand
popularity in the market by delivering the exceptional quality offerings to the visitors and
currently, it is looking to introduce a new tour package for attracting crowd audience. Thus, the
report will gather data by surveying 90 customers and other secondary source. However, analysis
will be made by employing statistical tools & techniques like central tendency, dispersion &
correlation-coefficient.
TASK 1
1.1 Plan for the collection of primary and secondary data
TUI Travel Group is looking to bring a new tour product in the market and for which, it
is require obtaining a multitude of information which can be collected by two sources,
enumerated underneath:
Primary source: The first-hand or highly-fresh materialistic information can be obtain
by the researcher using primary source i.e. survey, field observation, interview, questionnaire
and others. The obtained information from these sources are highly-realistic and considered
reliable, authentic and valid because researcher himself gather it from the respondents
(Solomon, 2014). Thus, it is decided to organize a web survey wherein participants will be
invited to participants in the survey on their free consent for providing their responses to
examine their preference and perception towards the new tour product offering.
Secondary source: It is just inverse source to the opposite wherein TUI Group marketer
will not have to carry any real survey and can use other’s reports, library sources, published
articles, research papers, useable industrial statistics, TUI’s annual financial reports and other
online material (Poussaint and et.al., 2016). For assessing the business performance, it is
decided to make a secondary analysis of sales and profit of TUI Group over last one decade.
The data about the same will be gather from the official website or any other web source.
Paraphrase This Document
Need a fresh take? Get an instant paraphrase of this document with our AI Paraphraser

1.2 Survey methodology and sampling frame
As decided earlier, TUI Travel Group will organize a web survey, in which, consumers
will be the respondents and all of them are invited to take voluntary participation. The desired
candidate will be ask with several questions, open and close-ended upon which they will provide
their responses and opinion and enable the tour operator to make better planning to launch
successfully the new tour product. The best advantage of the survey is privacy & confidentiality
promote & encourage the participants to give authentic views and help the firm in solid planning.
Moreover, questionnaire which design various question will take very few minutes in fulfilment
and gather required and necessary information.
TUI is UK’s leading outbound tour operator whose consumer base is spreaded all over
the world, therefore, it is too difficult to survey everyone on web, and therefore, a sample (group
of people) of 90 current visitors has been chosen using simple random sampling technique free
of biasness (Babajana and Phillips, 2016). The questionnaire will gather both the qualitative
aspect information like individual choices, preferences and demand and quantitative data like
information about prices & others. With the help of this, tour operator will be able to make solid
plans and decisions for effectively introduce the new tour product.
1.3Designing a questionnaire to carry out the survey
QUESTIONNAIRE
(Provide authentic and valid information, it is highly secured and will not be disclosed by
maintaining full confidentiality)
Demographic information:
Locality:______________________________
Age:__________________________________
Annual income: ______________________
Occupation:_____________________________
Q.1: What first comes in your mind when decides to travel?
Leisure
Meeting friend, family and relatives
Business meeting
Employment
Other (Kindly specify)
Q.2. Based on your experience, how well TUI’s travelling services and tour packages has

satisfied your tour requirements?
Extremely well
Very well
Average
To some extent
Not satisfied at all
Q.3. Which is the most influencing factor that you consider before others while booking tour
package?
Luxury hotel
Cheaper price
Attractive discounts
Sightseeing
Other (Please specify)
Q.4. In which kind of the tour, you wants to visit?
Business tour
Escorted tour
Inclusive tour
Independent tour
Q.5. Which of the tour you often prefer?
Inbound tour package
Outbound tour package
Q.6. Do you think that TUI Travel Group must introduce new tour packages to provide unique
travelling experience to the visitors?
Yes
No
Q.7. What prices ranges you might be ready to pay to the TUI for enjoying the memorable
travelling experience?
Less than £500
£500-£800
£800-£1100
Above £1100
⊘ This is a preview!⊘
Do you want full access?
Subscribe today to unlock all pages.
Trusted by 1+ million students worldwide

Q.8. What features will you demand in the new tour product offering of TUI?
World class hotel
Cruise ships
Reasonable price
Easier access
Attractive tourist destinations
Other (Please specify)
Q.9. Which of the following has a greater impact on your buying decisions?
Marketing
Discounting offers
Word of mouth publicity
Social-media advertisement
Others (Please specify)
Q.10. How do you book the tour packages at TUI?
Telephone conversation
Online
Any one
Q.11. Let us know the biggest rivalry of TUI Group?
Thomas Cook
Cox and Kings
Thompson Holidays
Other (Please mention)
Q.12 Give us the valuable suggestions to come with the best and unique tour package?
___________________________________________________________
TASK 2
2.1 Creating information by summarizing the raw data in spreadsheet
Representative values are used in the statistical analysis to make an idea about the entire
data series. The most important central tendency measures for the measurement of representative
values are presented below:
Mean: It is also called average which is the most effective measurement of central
tendency which is computed by adding the sum of total values divided with the total number of
Paraphrase This Document
Need a fresh take? Get an instant paraphrase of this document with our AI Paraphraser

items (Zhang, 2016).
Mode: It is the highest frequency incurring value which has been reported in the data set
for a number of years.
Median: It is different from the mean which divides the data set into two equal parts by
finding out the 50% value, one group’s value are above the median and another is below the
value (Zheng and et.al., 2016).
Year
Revenue (In Euro
Mil)
Profit (In Euro
Mil) % change % change
2007 20514 -890
2008 21865 236 6.59% -126.52%
2009 18631 -142 -14.79% -160.17%
2010 16350 101 -12.24% -171.13%
2011 17480 23 6.91% -77.23%
2012 18330 -15 4.86% -165.22%
2013 18478 -11 0.81% -26.67%
2014 18715 105 1.28% -1054.55%
2015 17516 340 -6.41% 223.81%
2016 17184 1037 -1.90% 205.00%
Total 185,063 784
Average sales = 185,063/10 years= 18,506.3
Average profit = 784/10 years = 78.4
Median = (N+1)/2
= (10+1)/2th item
= (11/2)th item
= 5.5th item
= (18,330+18,478)/2
= 18,404
Median profit = (23+101)/2
= (124/2)
= 62
Mode – Not exists
2.2 Analyzing the results to aid in solid decision-making with regards to the market
From the results founded, it is presented that TUI Travel group’s average annual sales
income is computed to 18,506.3, however, looking to the current sales value, it is founded lower
than average which is a sign of poor business performance. However, average return is reported

very less to 78.4 Euro million and currently, its actual return worth 784 is far greater than the
mean profit.
However, the median (M) of both the sales revenues and net earnings are founded 18,404
and 62 Euro million which showcase, that current sales of the business is below half of the sales
whereas profit is founded high (Zheng and et.al., 2016). In contrast to this, in every year,
performance shows a volatile trend both ups and downs therefore, in none of the year, similar
level of sales & profit is generated, thus, there is no mode exists in the data set.
2.3 Analysis of the data using measurement of dispersion to develop the new tour
Range = Highest – Lowest
Sales = 21,865 – 16,350
= 5,515
Profit = 1,037 – (-890)
= 1927
Year
Revenue (In Euro
Mil) DX = X-A DX^2
Profit (In Euro
Mil) DX = X-A DX^2
2007 20514 3034 9205156 -890 -913 833569
2008 21865 4385 19228225 236 213 45369
2009 18631 1151 1324801 -142 -165 27225
2010 16350 -1130 1276900 101 78 6084
2011 17480 0 0 23 0 0
2012 18330 850 722500 -15 -38 1444
2013 18478 998 996004 -11 -34 1156
2014 18715 1235 1525225 105 82 6724
2015 17516 36 1296 340 317 100489
2016 17184 -296 87616 1037 1014 1028196
10263 34367723 784 554 2050256
Standard deviation = √∑DX^2/N – (∑Dx)^2/(N)^2
Sales = √34367723/10 – (10263)^2/(10)^2
= 1543.85
Profit = √2050256/10 – (554)^2/(10)^2
= 449.3956
Finding the outcome of the dispersion statistics, it is clear the range is founded greater in
sales data to 5515 thus, this dataset has more spreadness or scattered. However, profitability
range is comparatively less to 1927 indicates less spreader. Range quantifies dispersion using
only highest and lowest values thus, the results are highly affects by the extreme values,
⊘ This is a preview!⊘
Do you want full access?
Subscribe today to unlock all pages.
Trusted by 1+ million students worldwide
therefore; standard deviation is a better way of dispersion which find out difference between
each value from the average to find out the scatter (Poussaint and et.al., 2016). The sales figures
reported St. dev. of 1543.85 which is very high from St. dev. under profit series of 449.39 thus,
series one has more variability at high dispersion. Changing the consumer attitude & luxurious
holiday choices is the main reason behind the volatile sales income of TUI Group. Thus, it is
suggested to the tour operator to introduce a unique tour package to attract more visitors from
both the home and foreign countries and thereby stabilize the revenues.
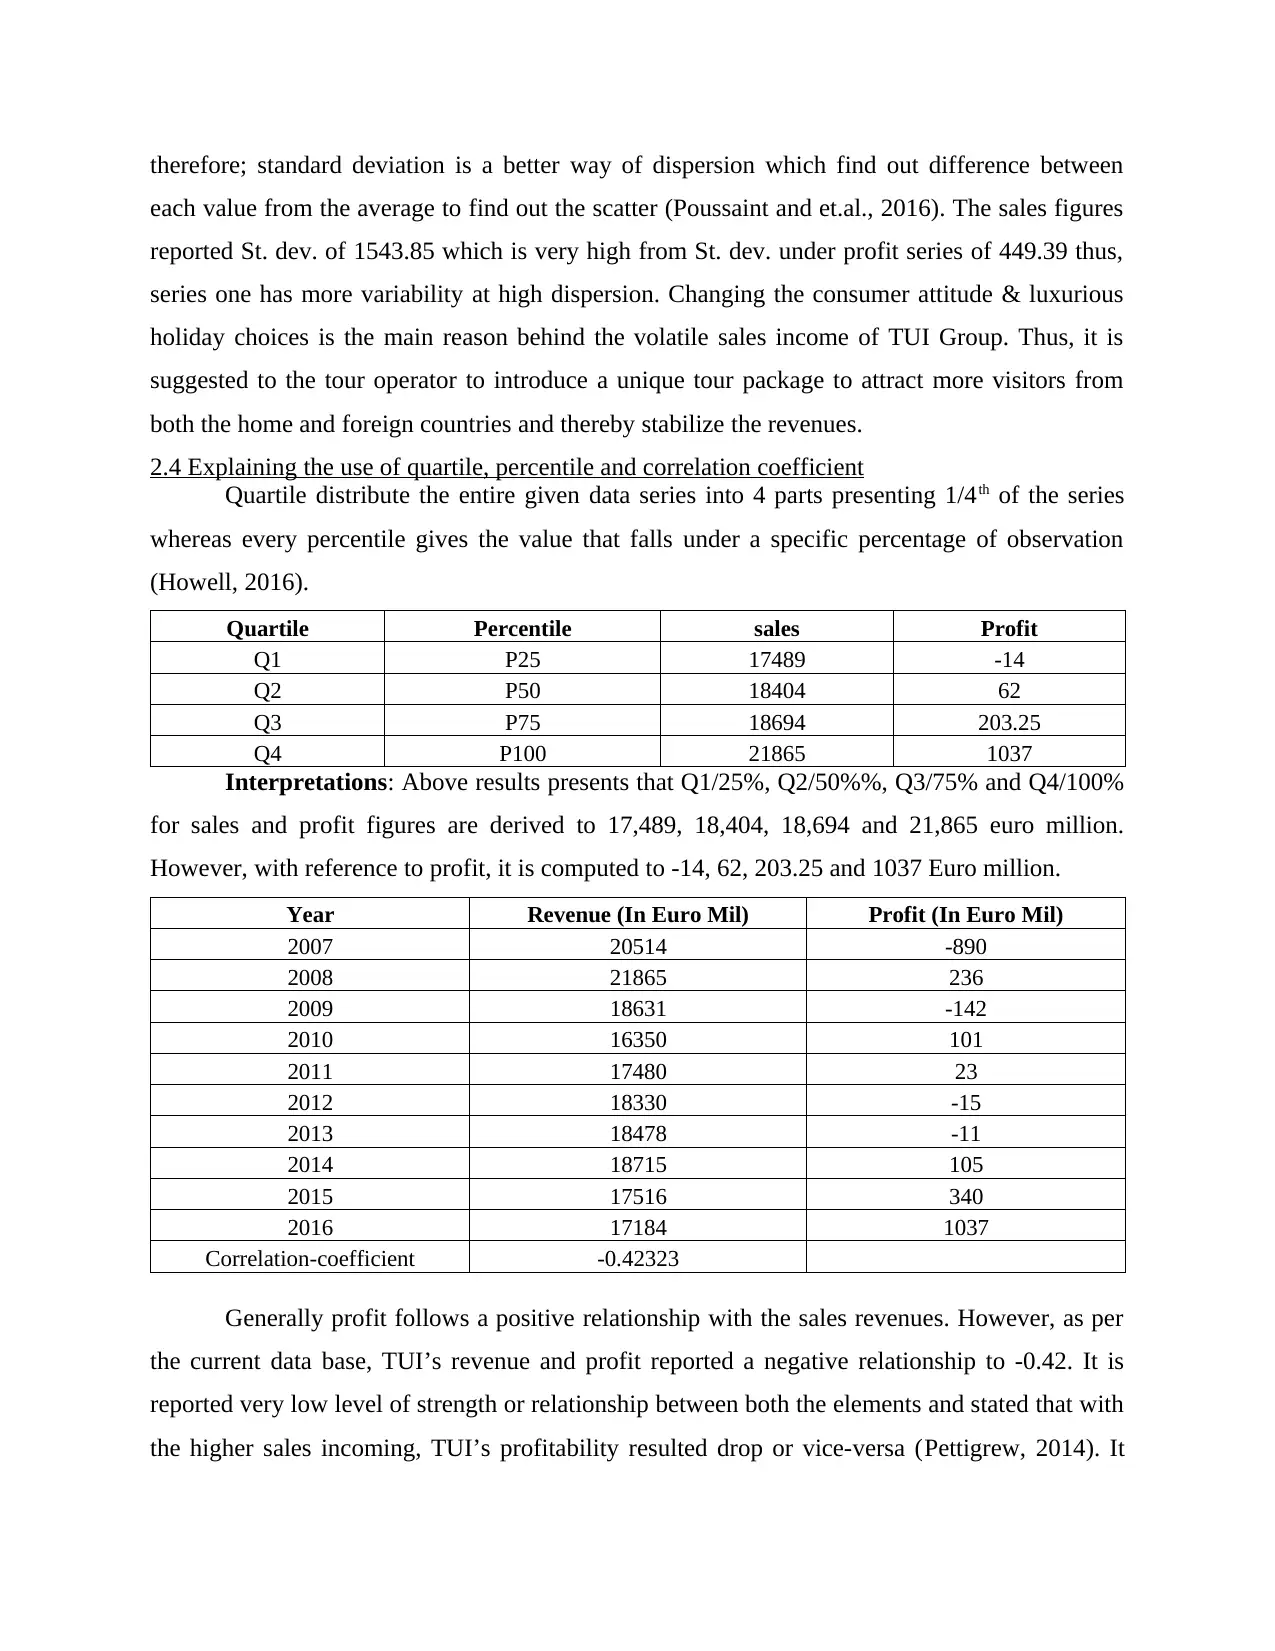
2.4 Explaining the use of quartile, percentile and correlation coefficient
Quartile distribute the entire given data series into 4 parts presenting 1/4th of the series
whereas every percentile gives the value that falls under a specific percentage of observation
(Howell, 2016).
Quartile Percentile sales Profit
Q1 P25 17489 -14
Q2 P50 18404 62
Q3 P75 18694 203.25
Q4 P100 21865 1037
Interpretations: Above results presents that Q1/25%, Q2/50%%, Q3/75% and Q4/100%
for sales and profit figures are derived to 17,489, 18,404, 18,694 and 21,865 euro million.
However, with reference to profit, it is computed to -14, 62, 203.25 and 1037 Euro million.
Year Revenue (In Euro Mil) Profit (In Euro Mil)
2007 20514 -890
2008 21865 236
2009 18631 -142
2010 16350 101
2011 17480 23
2012 18330 -15
2013 18478 -11
2014 18715 105
2015 17516 340
2016 17184 1037
Correlation-coefficient -0.42323
Generally profit follows a positive relationship with the sales revenues. However, as per
the current data base, TUI’s revenue and profit reported a negative relationship to -0.42. It is
reported very low level of strength or relationship between both the elements and stated that with
the higher sales incoming, TUI’s profitability resulted drop or vice-versa (Pettigrew, 2014). It
each value from the average to find out the scatter (Poussaint and et.al., 2016). The sales figures
reported St. dev. of 1543.85 which is very high from St. dev. under profit series of 449.39 thus,
series one has more variability at high dispersion. Changing the consumer attitude & luxurious
holiday choices is the main reason behind the volatile sales income of TUI Group. Thus, it is
suggested to the tour operator to introduce a unique tour package to attract more visitors from
both the home and foreign countries and thereby stabilize the revenues.
2.4 Explaining the use of quartile, percentile and correlation coefficient
Quartile distribute the entire given data series into 4 parts presenting 1/4th of the series
whereas every percentile gives the value that falls under a specific percentage of observation
(Howell, 2016).
Quartile Percentile sales Profit
Q1 P25 17489 -14
Q2 P50 18404 62
Q3 P75 18694 203.25
Q4 P100 21865 1037
Interpretations: Above results presents that Q1/25%, Q2/50%%, Q3/75% and Q4/100%
for sales and profit figures are derived to 17,489, 18,404, 18,694 and 21,865 euro million.
However, with reference to profit, it is computed to -14, 62, 203.25 and 1037 Euro million.
Year Revenue (In Euro Mil) Profit (In Euro Mil)
2007 20514 -890
2008 21865 236
2009 18631 -142
2010 16350 101
2011 17480 23
2012 18330 -15
2013 18478 -11
2014 18715 105
2015 17516 340
2016 17184 1037
Correlation-coefficient -0.42323
Generally profit follows a positive relationship with the sales revenues. However, as per
the current data base, TUI’s revenue and profit reported a negative relationship to -0.42. It is
reported very low level of strength or relationship between both the elements and stated that with
the higher sales incoming, TUI’s profitability resulted drop or vice-versa (Pettigrew, 2014). It
Paraphrase This Document
Need a fresh take? Get an instant paraphrase of this document with our AI Paraphraser

may be possible like for instance, high booking of the hotel may raise the cost of accommodation
and results in less yield.
TASK 3
3.1 Graphical presentation and charts
2007 2008 2009 2010 2011 2012 2013 2014 2015 2016
-5000
0
5000
10000
15000
20000
25000
TUI's sales and profitability
Revenue (In Euro Mil) Profit (In Euro Mil)
Year
Amount (In Euro million)
2007
2008
2009
2010
2011
2012
2013
2014
2015
2016
-5000 0 5000 10000 15000 20000 25000
TUI's sales and profit
Profit (In Euro Mil) Revenue (In Euro Mil)
Amount (In Euro million)
Year

2007 2008 2009 2010 2011 2012 2013 2014 2015 2016
-5000
0
5000
10000
15000
20000
25000
TUI's sales and proffitability
Revenue (In Euro Mil) Profit (In Euro Mil) Year
Year
Amount (In Euro million)
Findings and analysis: Looking to the constructed graphs, it can be seen that in 2008,
TUI’s sales revenues goes up by YOY growth of 6.59% to 21,865 Euro million. However,
thereafter, it shows a declined trend because in 2009 & 2010, the income has resulted down by
14.79% and 12.24% and came to 18,631 and 16,350 Euro million. Declined trend in the
consumer demands, tough level of competition, and availability of tour packages at discounted
prices, price sensitive visitors etc. may be the several reasons behind declined sales revenues
(TUI’s financials, 2016). However, after this, TUI witnessed positive growth at a YOY growth
by 6.91%, 4.86%, 0.81% and 1.28% respectively. In past 2 year, it came down to 17516 and
17184 Euro million by 6.41% and 1.90% due to tough competitive rivalries and changes in the
visitors tour choices. However, on the other side, profit figures shows a continuous volatile trend
because in 2009, TUI’s operation reported loss of 142 Euro million and then in next year, it
reported favorable profit of 101 Euro million and after continuously decreased till 2013 and
came to 11 Euro million. In the ending two year, it had spotted positive performance at profit has
been reported to 340 & 1037 Euro million respectively.
3.2 Create a trend line in spreadsheet and its use to forecast demand for 2017 & 2018
⊘ This is a preview!⊘
Do you want full access?
Subscribe today to unlock all pages.
Trusted by 1+ million students worldwide
1 out of 18
Related Documents


Your All-in-One AI-Powered Toolkit for Academic Success.
+13062052269
info@desklib.com
Available 24*7 on WhatsApp / Email
![[object Object]](/_next/static/media/star-bottom.7253800d.svg)
Unlock your academic potential
Copyright © 2020–2026 A2Z Services. All Rights Reserved. Developed and managed by ZUCOL.