TUI Travel Group: Forecasting and Business Decision Analysis

Verified

Added on  2023/04/04

|17
|908
|255
Report
AI Summary
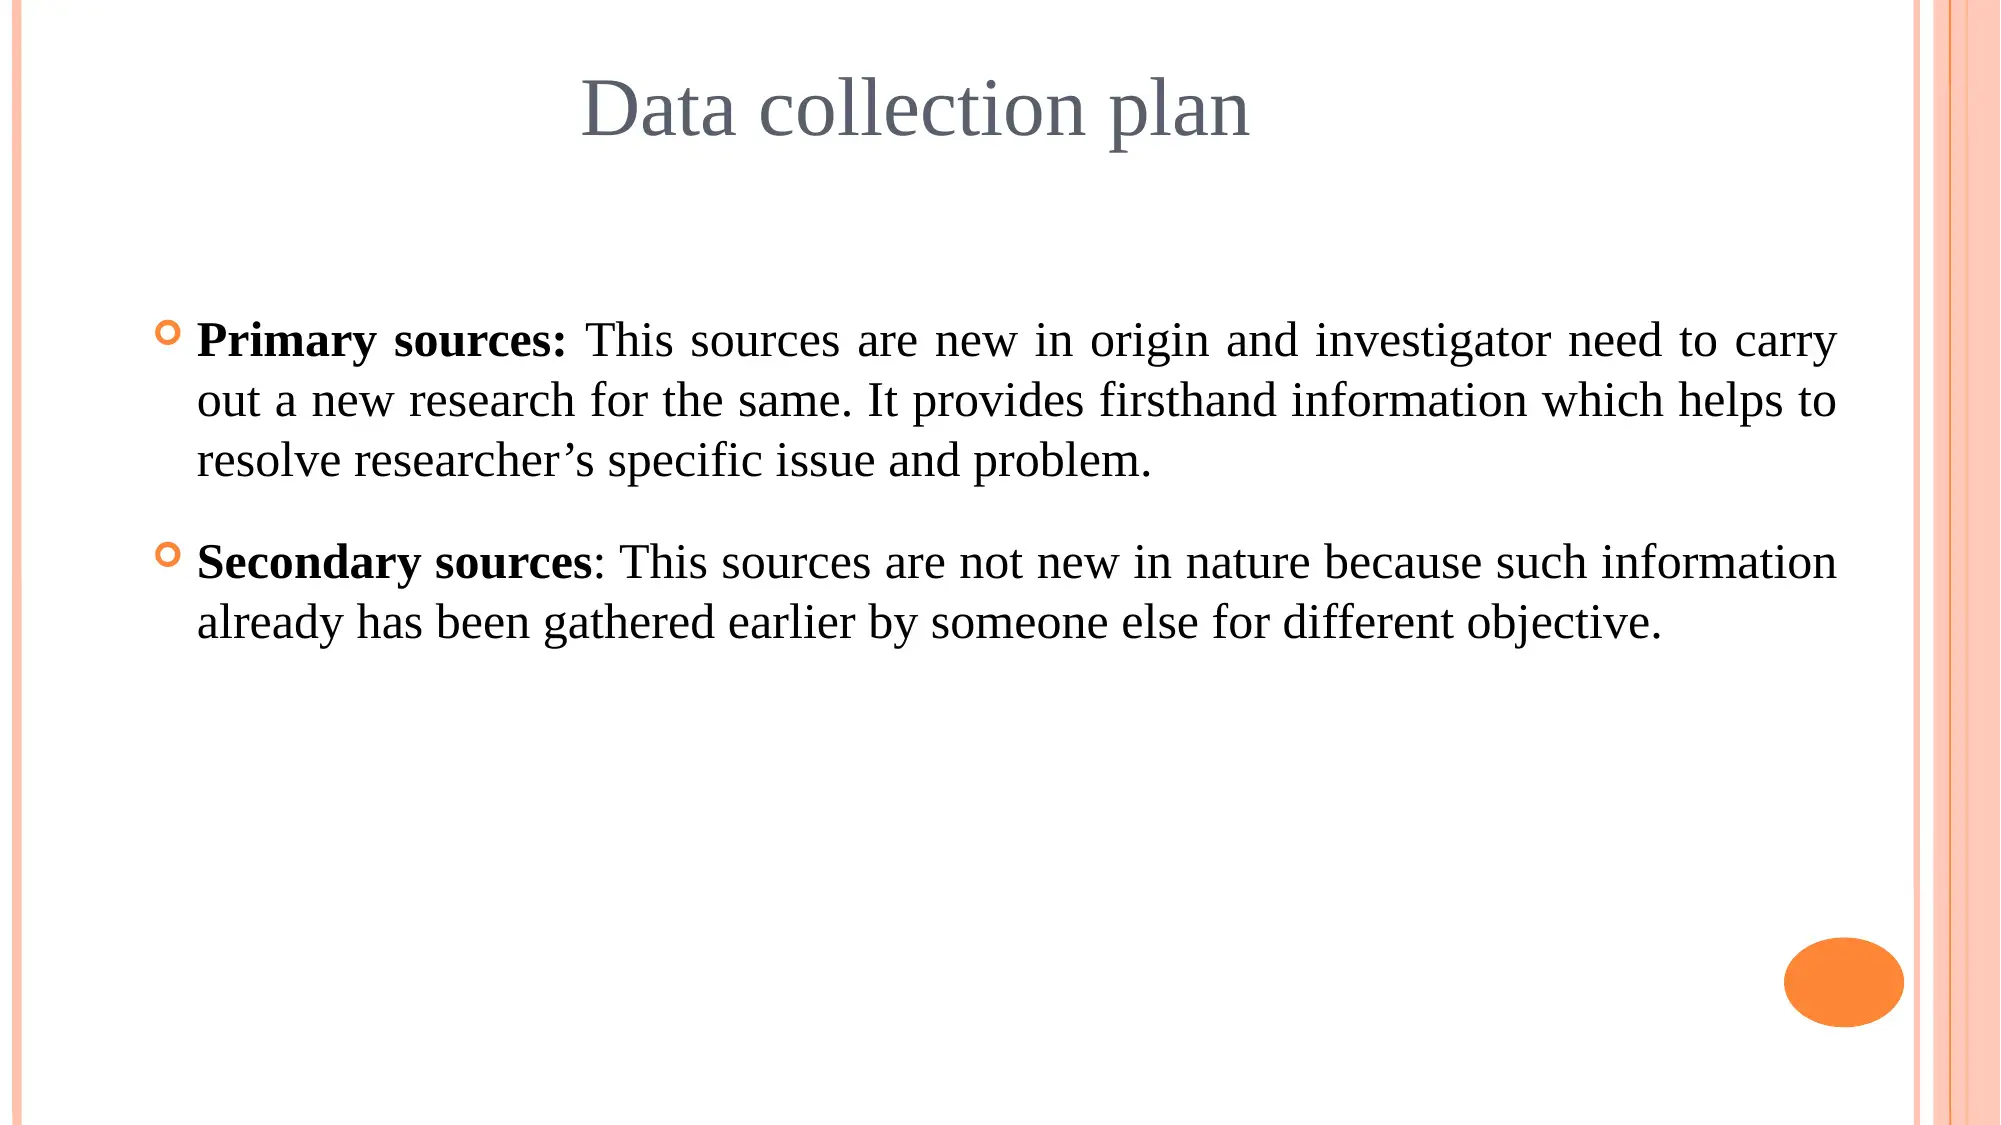
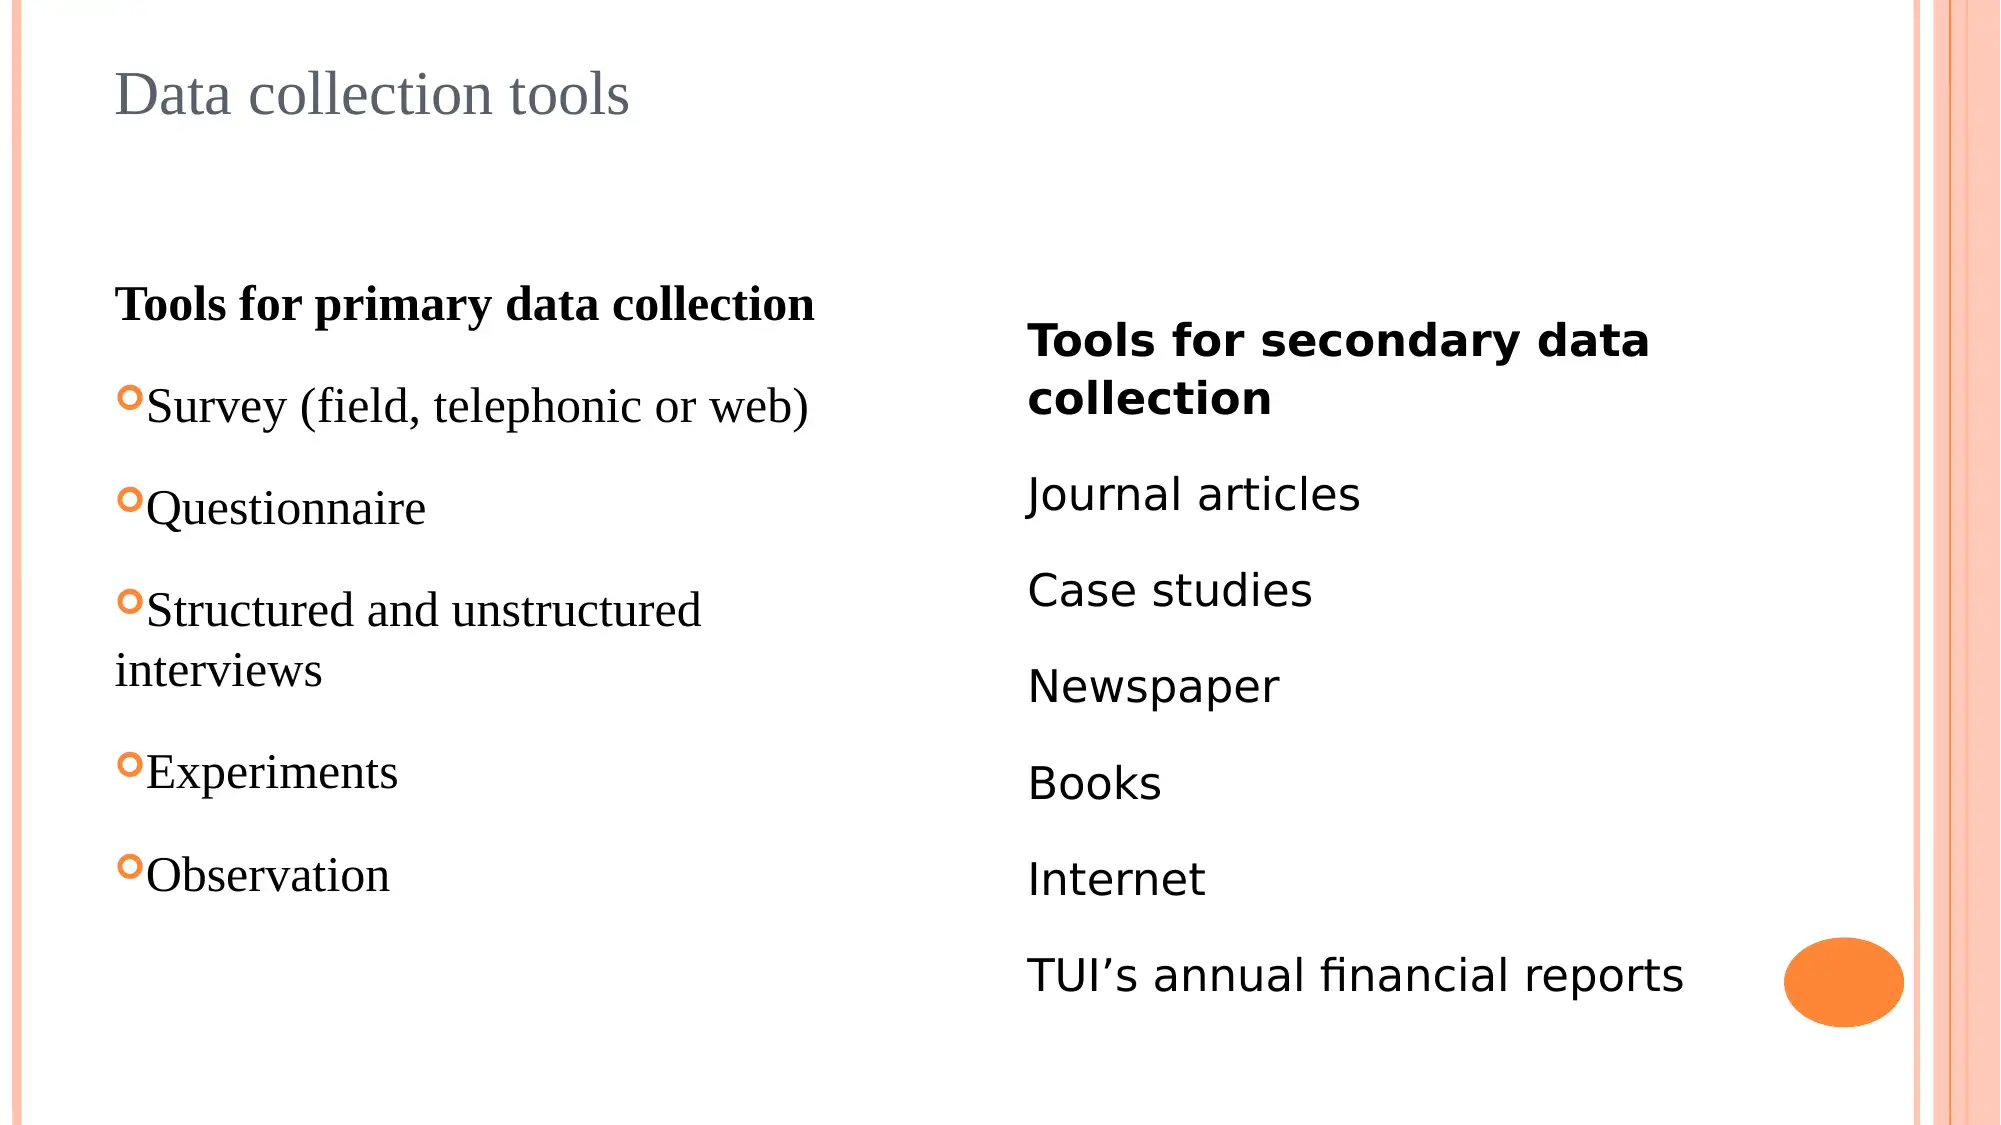
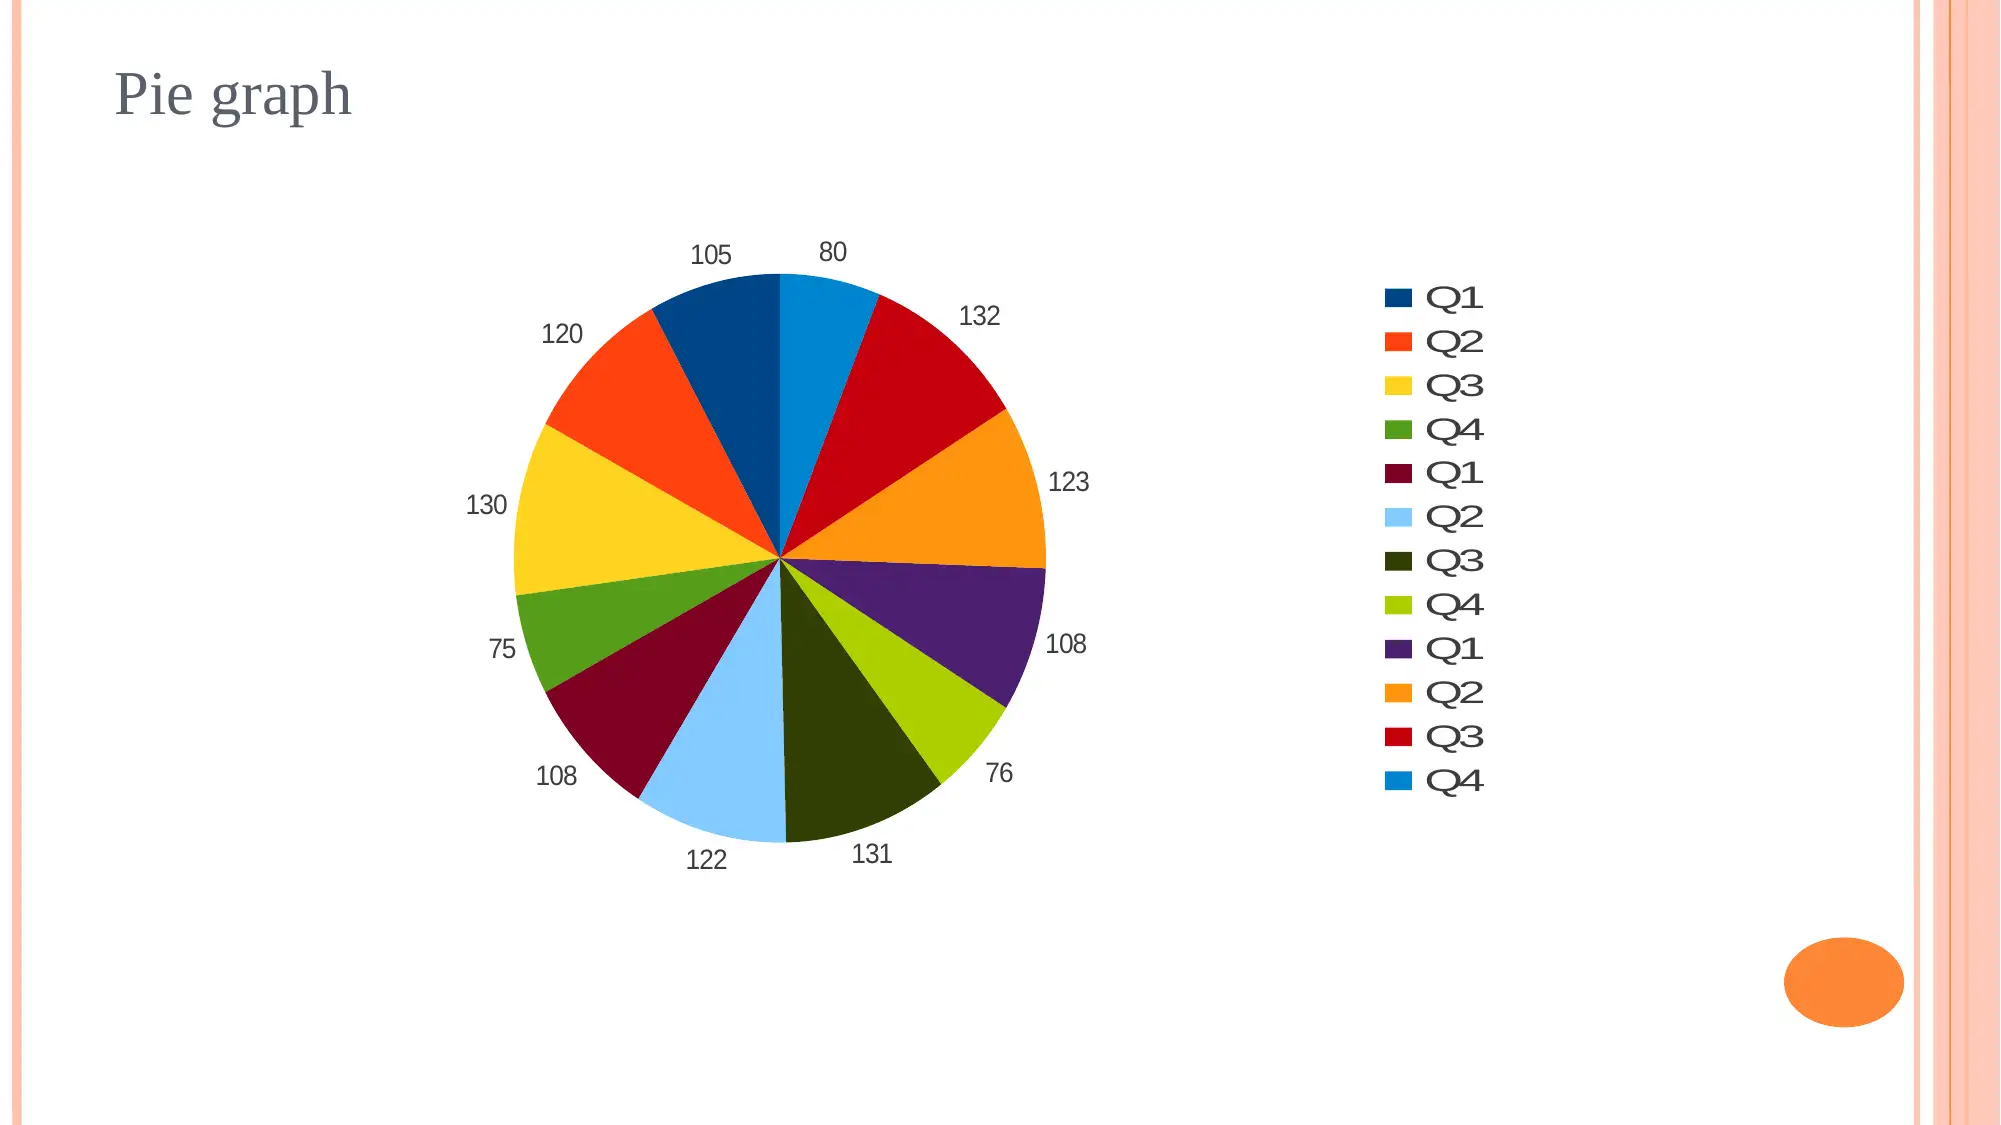
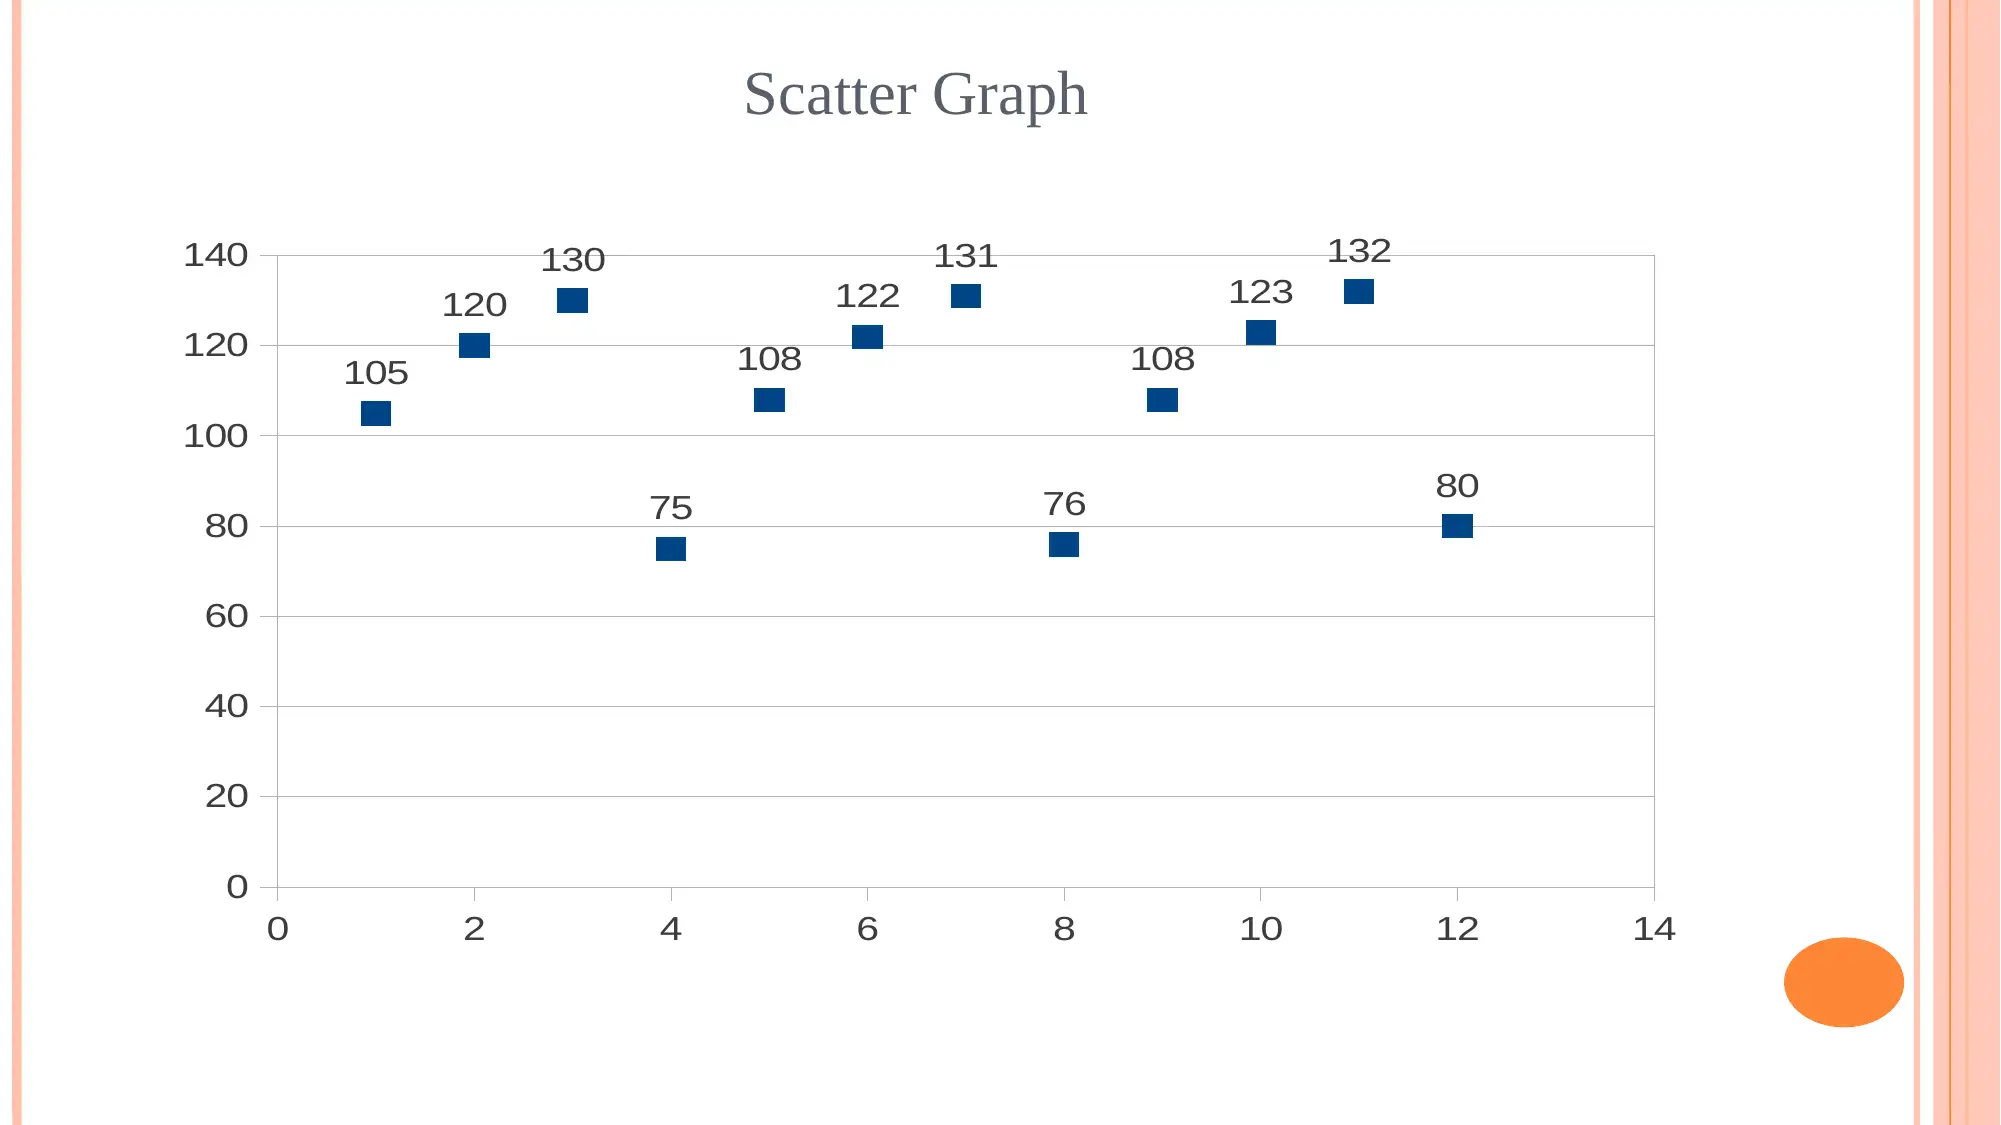
This report analyzes the business decision-making process of TUI Travel Group, a leading British tour operator. It outlines the data collection plan, differentiating between primary and secondary sources, and details the tools used, including surveys, questionnaires, interviews, and various data sources like journal articles and annual financial reports. The report explains the survey methodology, focusing on an online survey with a simple random sampling frame. It presents and interprets various graphs, including histograms, line graphs, column graphs, pie charts, and scatter graphs, to visualize revenue and sales data from Africa and the Middle East between 2014 and 2016. Furthermore, the report utilizes a trend line to forecast future sales and revenue for 2017 and 2018, providing specific figures for each quarter. The analysis offers insights into the trends and potential future performance of the company in these regions.
Document Page
Business decision-making
tabler-icon-diamond-filled.svg

Paraphrase This Document

Need a fresh take? Get an instant paraphrase of this document with our AI Paraphraser
Document Page
TUI Travel Group
TUI Travel & Group is a leading
British tour operator who renders
best quality travelling services to
provide excellent travelling
experiences to the people.
Document Page
Data collection plan
Primary sources: This sources are new in origin and investigator need to carry
out a new research for the same. It provides firsthand information which helps to
resolve researcher’s specific issue and problem.
Secondary sources: This sources are not new in nature because such information
already has been gathered earlier by someone else for different objective.
Document Page
Data collection tools
Tools for primary data collection
Survey (field, telephonic or web)
Questionnaire
Structured and unstructured
interviews
Experiments
Observation
Tools for secondary data
collection
Journal articles
Case studies
Newspaper
Books
Internet
TUI’s annual financial reports
tabler-icon-diamond-filled.svg

Paraphrase This Document

Need a fresh take? Get an instant paraphrase of this document with our AI Paraphraser
Document Page
Survey methodology
It is a technique of primary data collection that gather data from the sample units
by using different instruments like questionnaire and evaluate the same for the
purpose of concluding the entire population.
In the current plan, it has been decided to conduct an online survey by creating e-
questionnaire which will design a set of questions keeping into account TUI’s
information need to introduce a new tour product in the market.
Document Page
Sampling frame
Simple random selection is considered unbiased and appropriate, in which,
randomly a number of audience and enable TUI to successfully90 customers will be
selected from whom questions will asked as per their voluntary consent.
Biasfree selection helps to find out the right information about target introduce the
new goods.
Document Page
Histogram for the price in Morocco
As per the results founded that
majority of the visitors are likely to
pay reasonable or average prices of
650-675 at a frequency of 31
(34.44%).
tabler-icon-diamond-filled.svg

Paraphrase This Document

Need a fresh take? Get an instant paraphrase of this document with our AI Paraphraser
Document Page
Line graph
Q1 Q2 Q3 Q4 Q1 Q2 Q3 Q4 Q1 Q2 Q3 Q4
0
20
40
60
80
100
120
140
105
120
130
75
108
122
131
76
108
123
132
80
Document Page
Column graph
Q1 Q2 Q3 Q4 Q1 Q2 Q3 Q4 Q1 Q2 Q3 Q4
0
20
40
60
80
100
120
140
105
120
130
75
108
122
131
76
108
123
132
80
Document Page
Pie graph
105
120
130
75
108
122 131
76
108
123
132
80
Q1
Q2
Q3
Q4
Q1
Q2
Q3
Q4
Q1
Q2
Q3
Q4
tabler-icon-diamond-filled.svg

Paraphrase This Document

Need a fresh take? Get an instant paraphrase of this document with our AI Paraphraser
Document Page
Interpretation
The current presented graphs shows and describes about the level of revenue and sales
generated by the tour firm from the destination like as Africa and middle east from the
financial year 2014 to 2016.
It can be visualized from the above presented graphs and charts that in each and every
quarter the revenue of the Africa and middle east destination is increases but in the last
like as fourth quarter it reduces.
There same kind of trend in every year which is from the FY 2014 to 2016. Here at the
end of first quarter amount generated by Africa and middle east is 105 GBP which
reduces at the end of fourth quarter and reaches up to 75 GBP in the FY 2014.
The same kind of condition is there in both the fiscal years such as 2015 and 2016 where
amount is worth of 108 and 108 for first quarter as well as 76 and 80 GBP for fourth
quarter respectively.
Document Page
Scatter Graph
0 2 4 6 8 10 12 14
0
20
40
60
80
100
120
140
105
120
130
75
108
122
131
76
108
123
132
80
chevron_up_icon
1 out of 17
circle_padding
hide_on_mobile
zoom_out_icon
[object Object]