Business Decision-Making Report: Data Analysis of TUI Travel Group

Verified

Added on  2023/04/04

|14
|736
|431
Report
AI Summary
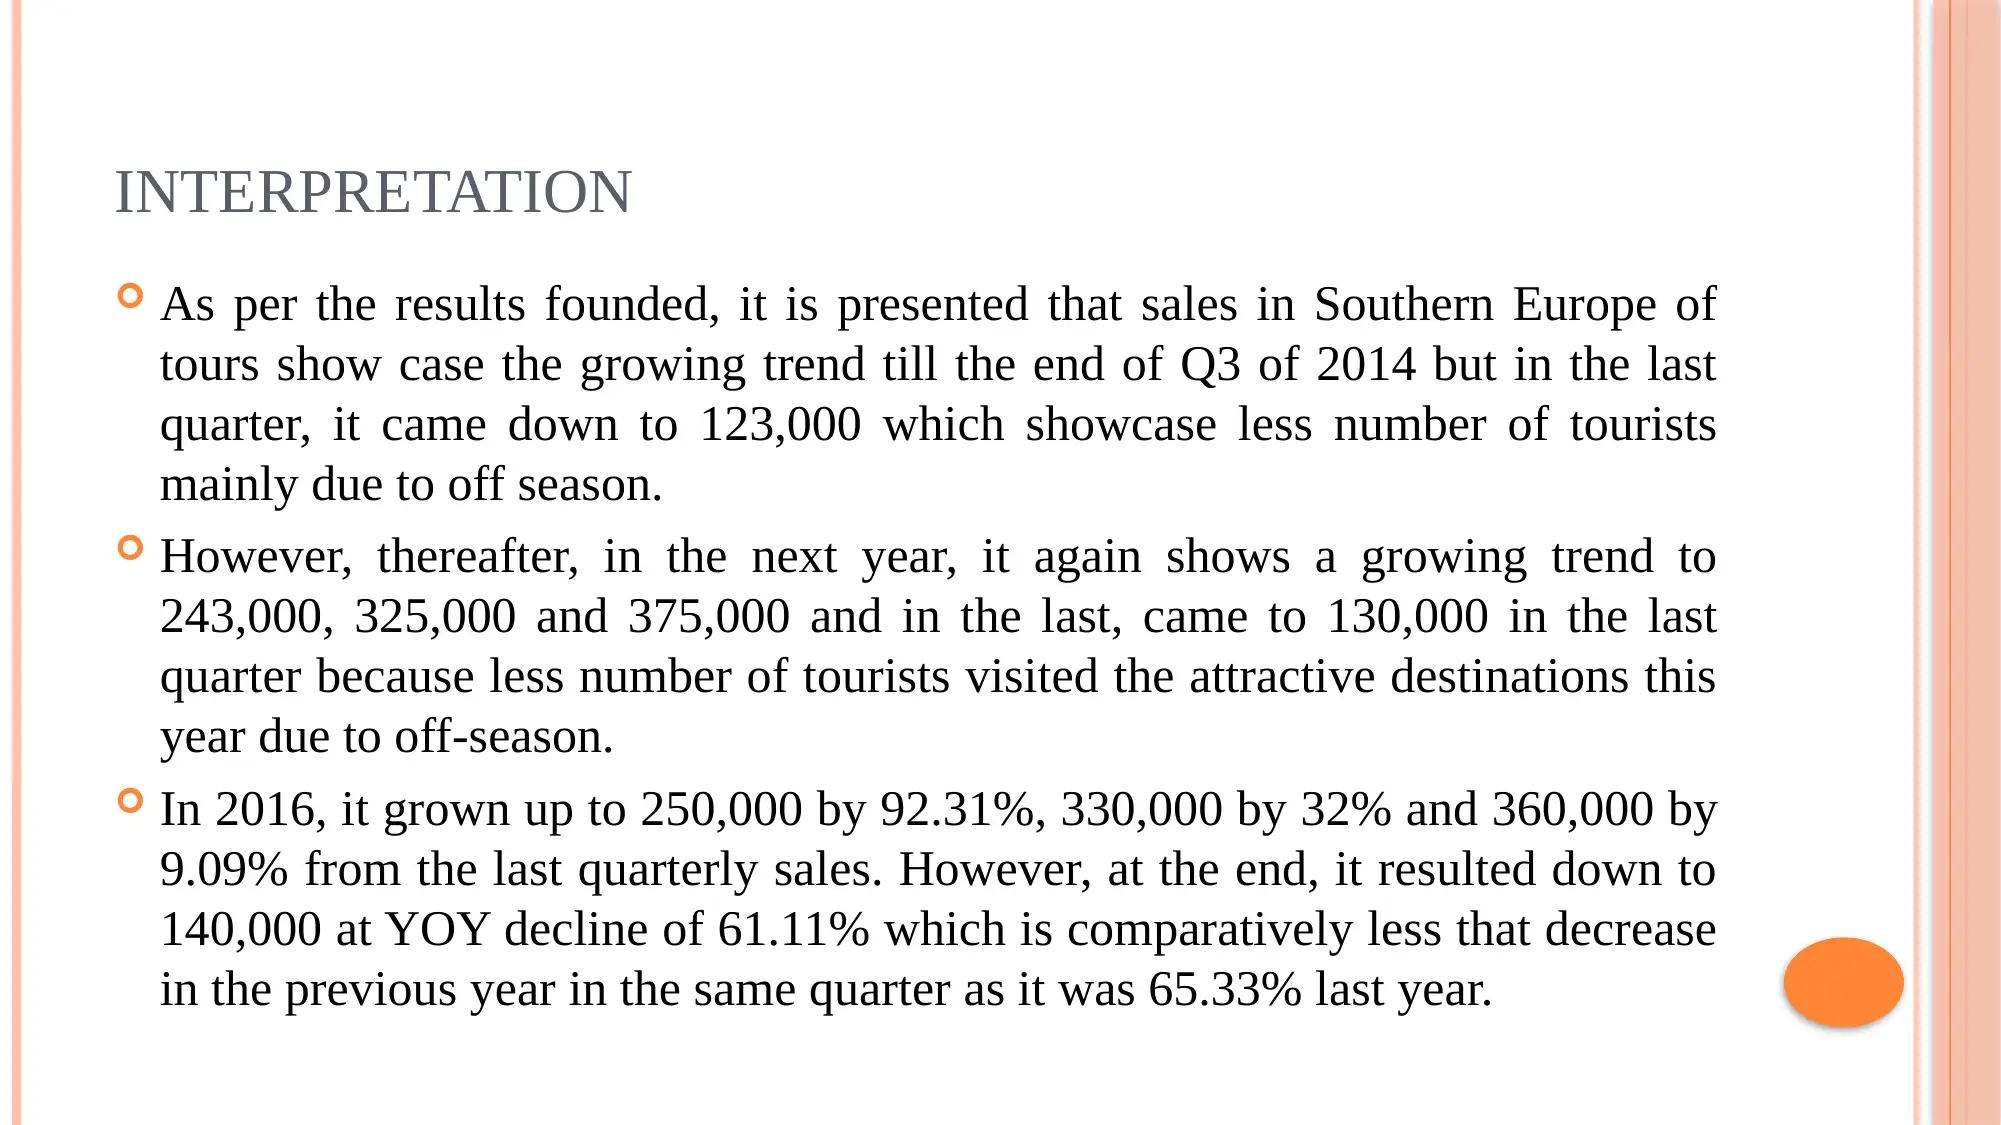
This report provides an analysis of TUI Travel Group's business decision-making process, focusing on data collection methods and interpretation of sales trends in Southern Europe. It outlines the use of primary and secondary data collection tools, including surveys and financial reports, to gather relevant information. A survey methodology using simple random selection is described to understand customer preferences for new tour products. The report includes histograms and line graphs illustrating price sensitivity in Morocco and sales trends in Southern Europe from 2014 to 2016. The interpretation of these graphs highlights seasonal sales variations and growth patterns, with a forecast for future sales in 2017 and 2018. The analysis suggests strategies such as promotional offers and new tour destinations to enhance revenue. The document concludes with a list of references and is available for students on Desklib, a platform offering a wide range of study tools and solved assignments.
Document Page
BUSINESS DECISION-MAKING
tabler-icon-diamond-filled.svg

Paraphrase This Document

Need a fresh take? Get an instant paraphrase of this document with our AI Paraphraser
Document Page
TUI TRAVEL GROUP
TUI Travel & Group is a leading
British tour operator who renders
best quality travelling services to
provide excellent travelling
experiences to the people.
Document Page
DATA COLLECTION PLAN
Primary sources: This sources are new in origin and investigator need to carry
out a new research for the same. It provides firsthand information which helps to
resolve researcher’s specific issue and problem.
Secondary sources: This sources are not new in nature because such information
already has been gathered earlier by someone else for different objective.
Document Page
DATA COLLECTION TOOLS
Tools for primary data collection
Survey (field, telephonic or web)
Questionnaire
Structured and unstructured
interviews
Experiments
Observation
Tools for secondary data collection
Journal articles
Case studies
Newspaper
Books
Internet
TUI’s annual financial reports
tabler-icon-diamond-filled.svg

Paraphrase This Document

Need a fresh take? Get an instant paraphrase of this document with our AI Paraphraser
Document Page
SURVEY METHODOLOGY
It is a technique of primary data collection that gather data from the sample units
by using different instruments like questionnaire and evaluate the same for the
purpose of concluding the entire population.
In the current plan, it has been decided to conduct an online survey by creating e-
questionnaire which will design a set of questions keeping into account TUI’s
information need to introduce a new tour product in the market.
Document Page
SAMPLING FRAME
Simple random selection is considered unbiased and appropriate, in which,
randomly a number of 50 customers will be selected from whom questions will
asked as per their voluntary consent.
Biasfree selection helps to find out the right information about target audience and
enable TUI to successfully introduce the new goods.
Document Page
HISTOGRAM FOR THE PRICE AND TOURIST FREQUENCY IN MOROCCO
0-625 625-1250 1250-
1875
1875-
2500
2500-
3125
0
5
10
15
20
25
30
35
Histogram
Frequency
Price
Frequency
As per the results founded that
majority of the visitors are likely to
pay reasonable or average prices of
1250-1875 at a frequency of 31
(34.44%).
tabler-icon-diamond-filled.svg

Paraphrase This Document

Need a fresh take? Get an instant paraphrase of this document with our AI Paraphraser
Document Page
LINE GRAPH
Q1 Q2 Q3 Q4 Q1 Q2 Q3 Q4 Q1 Q2 Q3 Q4
2014 2015 2016
0
50
100
150
200
250
300
350
400
Sales in Southern Europe
Document Page
COLUMN GRAPH
Q1 Q2 Q3 Q4 Q1 Q2 Q3 Q4 Q1 Q2 Q3 Q4
2014 2015 2016
0
50
100
150
200
250
300
350
400
Sales of tours in Southern Europe
Sales (jn 000s)
Document Page
INTERPRETATION
As per the results founded, it is presented that sales in Southern Europe of
tours show case the growing trend till the end of Q3 of 2014 but in the last
quarter, it came down to 123,000 which showcase less number of tourists
mainly due to off season.
However, thereafter, in the next year, it again shows a growing trend to
243,000, 325,000 and 375,000 and in the last, came to 130,000 in the last
quarter because less number of tourists visited the attractive destinations this
year due to off-season.
In 2016, it grown up to 250,000 by 92.31%, 330,000 by 32% and 360,000 by
9.09% from the last quarterly sales. However, at the end, it resulted down to
140,000 at YOY decline of 61.11% which is comparatively less that decrease
in the previous year in the same quarter as it was 65.33% last year.
tabler-icon-diamond-filled.svg

Paraphrase This Document

Need a fresh take? Get an instant paraphrase of this document with our AI Paraphraser
Document Page
TREND LINE
Q1 Q2 Q3 Q4 Q1 Q2 Q3 Q4 Q1 Q2 Q3 Q4 Q1 Q2 Q3 Q4 Q1 Q2 Q3 Q4
2014 2015 2016 2017 2018
0
50
100
150
200
250
300
350
400
Sales of Tour in Southern Europe
Actual
Forecast Past
Forecast Future
Axis Title
Document Page
INTERPRETATION
Finding the results, it can be said that in the future years, 2017, quarterly
sales for the first three quarter is expected to grow to 254, 252.27, 250.54
whereas as in the last quarter, it is expected to decrease to 248.81.
In the next year, 2018, the projected sales were founded to 247.08, 245.35,
and 243.62 and in last, it will turned downward to 241.88. High sales will
drive larger revenues to the TUI Group, in addition, it can be suggested to
utilize effective promotional strategies, discounting and offers and launch a
new tour at other tourist destinations as well to drive exceeding consumer
base.
chevron_up_icon
1 out of 14
circle_padding
hide_on_mobile
zoom_out_icon
[object Object]