Financial Analysis of Turkish Airlines and Lufthansa: A Report
VerifiedAdded on 2020/07/22
|15
|3882
|59
Report
AI Summary
This report conducts a thorough financial analysis, comparing the financial performance and position of Turkish Airlines and Lufthansa. It examines profitability ratios (gross profit and net profit), liquidity ratios (current and quick), solvency ratios (debt-equity), and efficiency ratios (inventory turnover and total assets turnover) using financial data from 2012 to 2016. The analysis reveals trends in each airline's financial health, highlighting their strengths and weaknesses. Furthermore, the report includes a critical analysis of Emirates Airlines' cash flow statements over a five-year period, providing a comprehensive financial overview. The findings are presented from the perspective of a financial analyst at a small investment bank, offering valuable insights into the aviation industry's financial landscape.

Financial analysis
management and enterprise
management and enterprise
Paraphrase This Document
Need a fresh take? Get an instant paraphrase of this document with our AI Paraphraser
TABLE OF CONTENTS
INTRODUCTION...........................................................................................................................1
1. Comparison of financial performance and financial position ...........................................1
2. Cash flow ratios of Emirates from the period of 2012 to 2016 are enumerated below:.....8
CONCLUSION..............................................................................................................................10
REFERENCES..............................................................................................................................11
INTRODUCTION
Financial analysis is considered as the analysis of company's financial statements in order
assess the viability, stability and profitability of their business operations, sub business or
project. It is performed by the professional who tends to develop the reports using the ratios that
will make use of information taken from the financial statements and other important reports
(Higgins, 2012). These important reports are usually presented to the top management by the
finance department as one of their basis for in making business decisions. Present reports is
based on comparison between financial performance and financial position two international
Airlines i.e. Turkish Airlines and Lufthansa on the basis of last four financial information.
Moreover, critical analysis of cash flow statements of Emirates Airlines is done on the basis of
last five years financial information. At last, conclusion will be drawn on the basis of findings of
research as a financial analyst of small investment bank.
1. Comparison of financial performance and financial position
Financial performance of enterprise is termed as measuring the outcomes of company's
business policies and operations in the monetary terms. These outcomes have been reflected or
shown in the organization's return on investments, assets return and values added etc. It is also
considered as subjective measure of how well the organization will be able to use its assets from
its primary code of business and generate revenues (Titman, Keown and Martin, 2017).
Financial position is analysed as the status of the assets, liabilities, and employers equity and
their interrelationship of business enterprise as determined in the financial statements also
refereed as financial condition. In present context, Turkish and Lufthansa are two international
Airline having their business operations in Aviation industry at global scale. They are providing
services to the people in different countries. In this,, some important ratios have been calculated
which is used to measure the financial performance and analysis of financial position of both the
enterprise in order to make comparison in their growth and profitability.
Profitability Ratios
1
⊘ This is a preview!⊘
Do you want full access?
Subscribe today to unlock all pages.
Trusted by 1+ million students worldwide
These are mainly considered as class financial metrics which are utilized in order to
access ability of Turkish and Lufthansa airlines of generating incomes as compared to expenses
and other important relevant costs which is incurred during a specific period. This context there
are different type of ratios are calculated onFinancial Analysis Management and Enterprise the
basis four financial statements of Turkish and Lufthansa airlines.
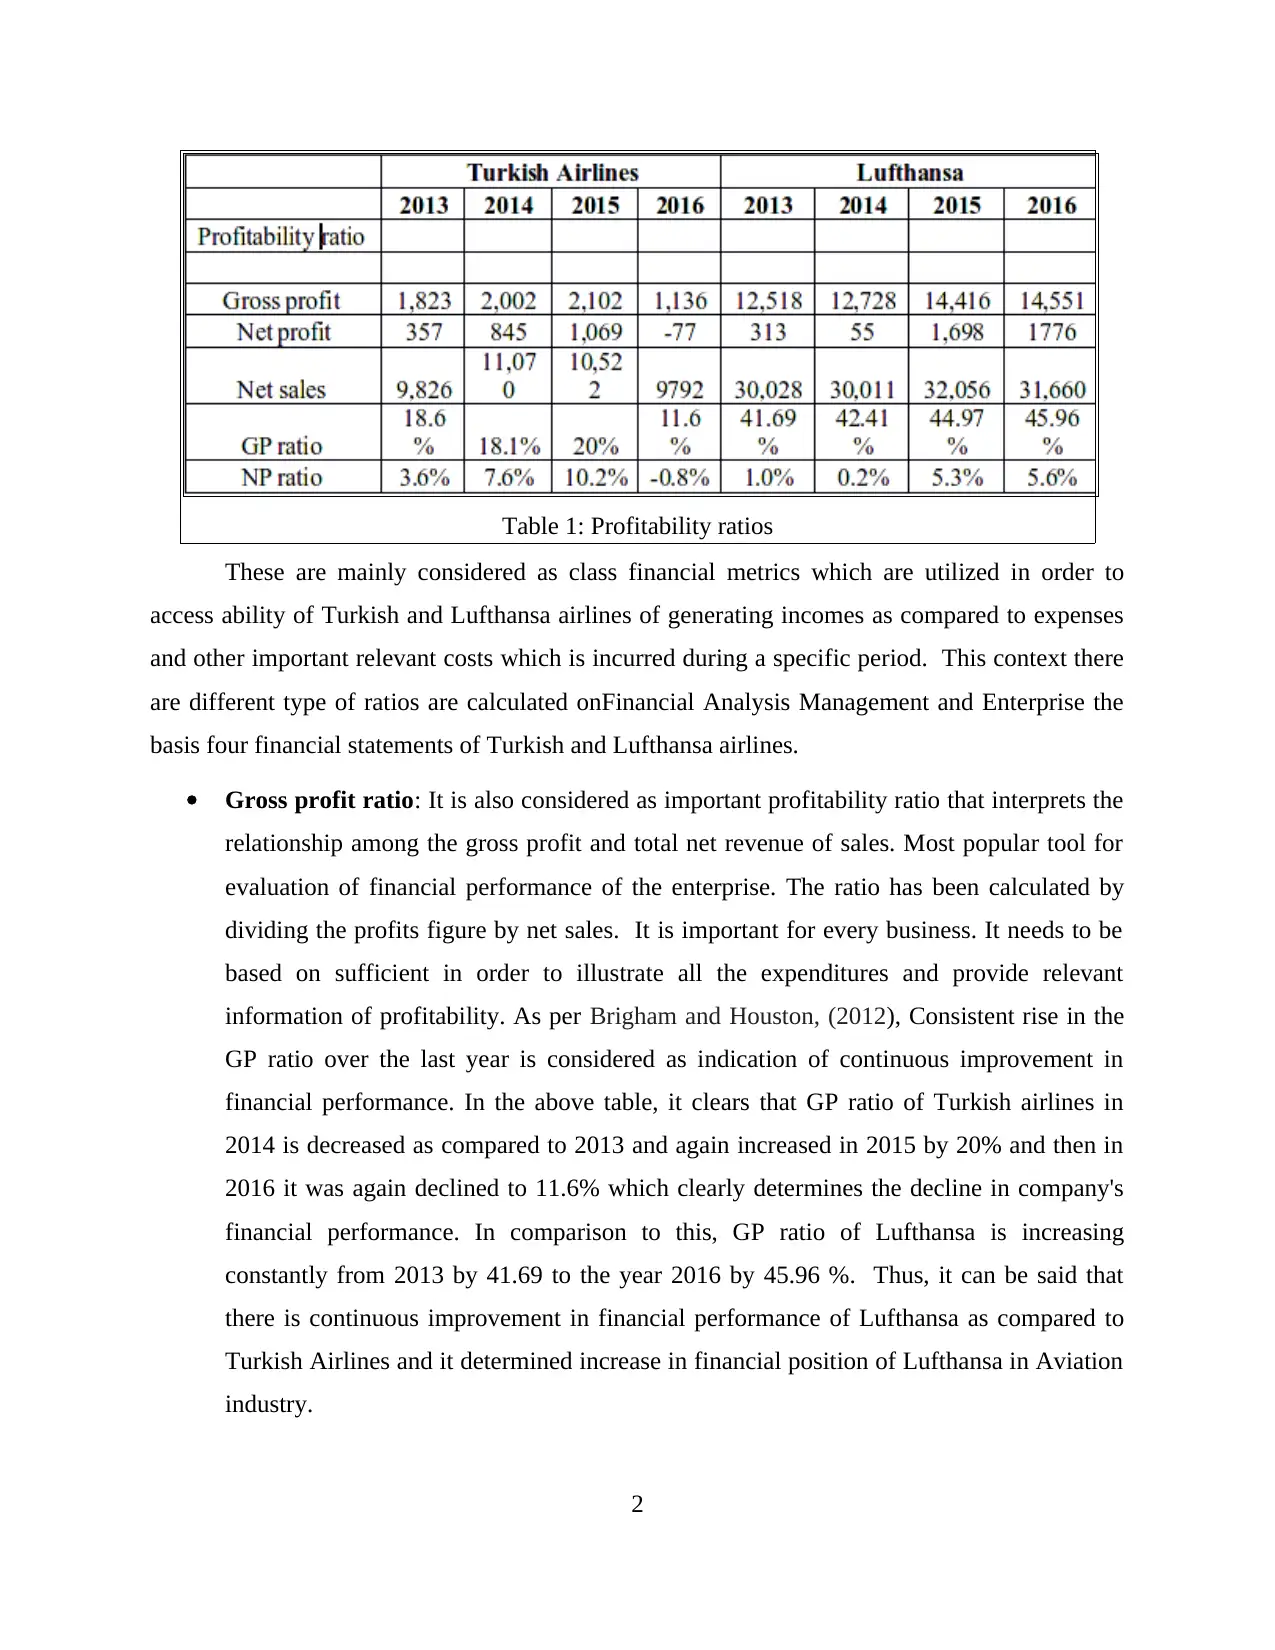
Gross profit ratio: It is also considered as important profitability ratio that interprets the
relationship among the gross profit and total net revenue of sales. Most popular tool for
evaluation of financial performance of the enterprise. The ratio has been calculated by
dividing the profits figure by net sales. It is important for every business. It needs to be
based on sufficient in order to illustrate all the expenditures and provide relevant
information of profitability. As per Brigham and Houston, (2012), Consistent rise in the
GP ratio over the last year is considered as indication of continuous improvement in
financial performance. In the above table, it clears that GP ratio of Turkish airlines in
2014 is decreased as compared to 2013 and again increased in 2015 by 20% and then in
2016 it was again declined to 11.6% which clearly determines the decline in company's
financial performance. In comparison to this, GP ratio of Lufthansa is increasing
constantly from 2013 by 41.69 to the year 2016 by 45.96 %. Thus, it can be said that
there is continuous improvement in financial performance of Lufthansa as compared to
Turkish Airlines and it determined increase in financial position of Lufthansa in Aviation
industry.
2
Table 1: Profitability ratios
access ability of Turkish and Lufthansa airlines of generating incomes as compared to expenses
and other important relevant costs which is incurred during a specific period. This context there
are different type of ratios are calculated onFinancial Analysis Management and Enterprise the
basis four financial statements of Turkish and Lufthansa airlines.
Gross profit ratio: It is also considered as important profitability ratio that interprets the
relationship among the gross profit and total net revenue of sales. Most popular tool for
evaluation of financial performance of the enterprise. The ratio has been calculated by
dividing the profits figure by net sales. It is important for every business. It needs to be
based on sufficient in order to illustrate all the expenditures and provide relevant
information of profitability. As per Brigham and Houston, (2012), Consistent rise in the
GP ratio over the last year is considered as indication of continuous improvement in
financial performance. In the above table, it clears that GP ratio of Turkish airlines in
2014 is decreased as compared to 2013 and again increased in 2015 by 20% and then in
2016 it was again declined to 11.6% which clearly determines the decline in company's
financial performance. In comparison to this, GP ratio of Lufthansa is increasing
constantly from 2013 by 41.69 to the year 2016 by 45.96 %. Thus, it can be said that
there is continuous improvement in financial performance of Lufthansa as compared to
Turkish Airlines and it determined increase in financial position of Lufthansa in Aviation
industry.
2
Table 1: Profitability ratios
Paraphrase This Document
Need a fresh take? Get an instant paraphrase of this document with our AI Paraphraser
Net profit ratio: Most effective and useful tool in order to measure the overall
profitability of the business enterprise. A high ratio points out the efficient management
of the affairs of the business. No norms and rules are their to interpret this ratio. In order
to consider whether the organisation is continuously achieving rise in profitability or not
the analyst needs to compare the ratio with the ratios of previous year , the industry
average and budgeted net profit ratio (Grant, 2016). The major use of this ration helps
in ascertaining the ways through which the profitability on assets have been used by
company during the period. From the above table, it is analysed that NP ratio of Turkish
Airline has increased from 2013 by 3.6% to 2015 by 10.2 % is a positive sign but in 2016
the ratio has declined to -0.8% which indicated that there is inefficient management of
business affairs by company. In comparison to this, NP ratio of Lufthansa was declined
from 2013 by 1.0 to 2015 by 0.2% but from 2014 it has increased to 5.6% in the 2016.
Therefore, it is clearly determined that financial performance of Lufthansa is better than
compared to Turkish Airlines. It is also stated that financial position of Lufthansa is
excellent in aviation industry because it has achieved more profitability in comparison
with expenses.
Liquidity ratio analysis
This ratio have been calculated in order to determined the ability of enterprise to settle its
overall debts or borrowings and its margin of safety through the calculation of important metrics
which includes the current ratio, quick ratio and operating or cash flow ratio.
3
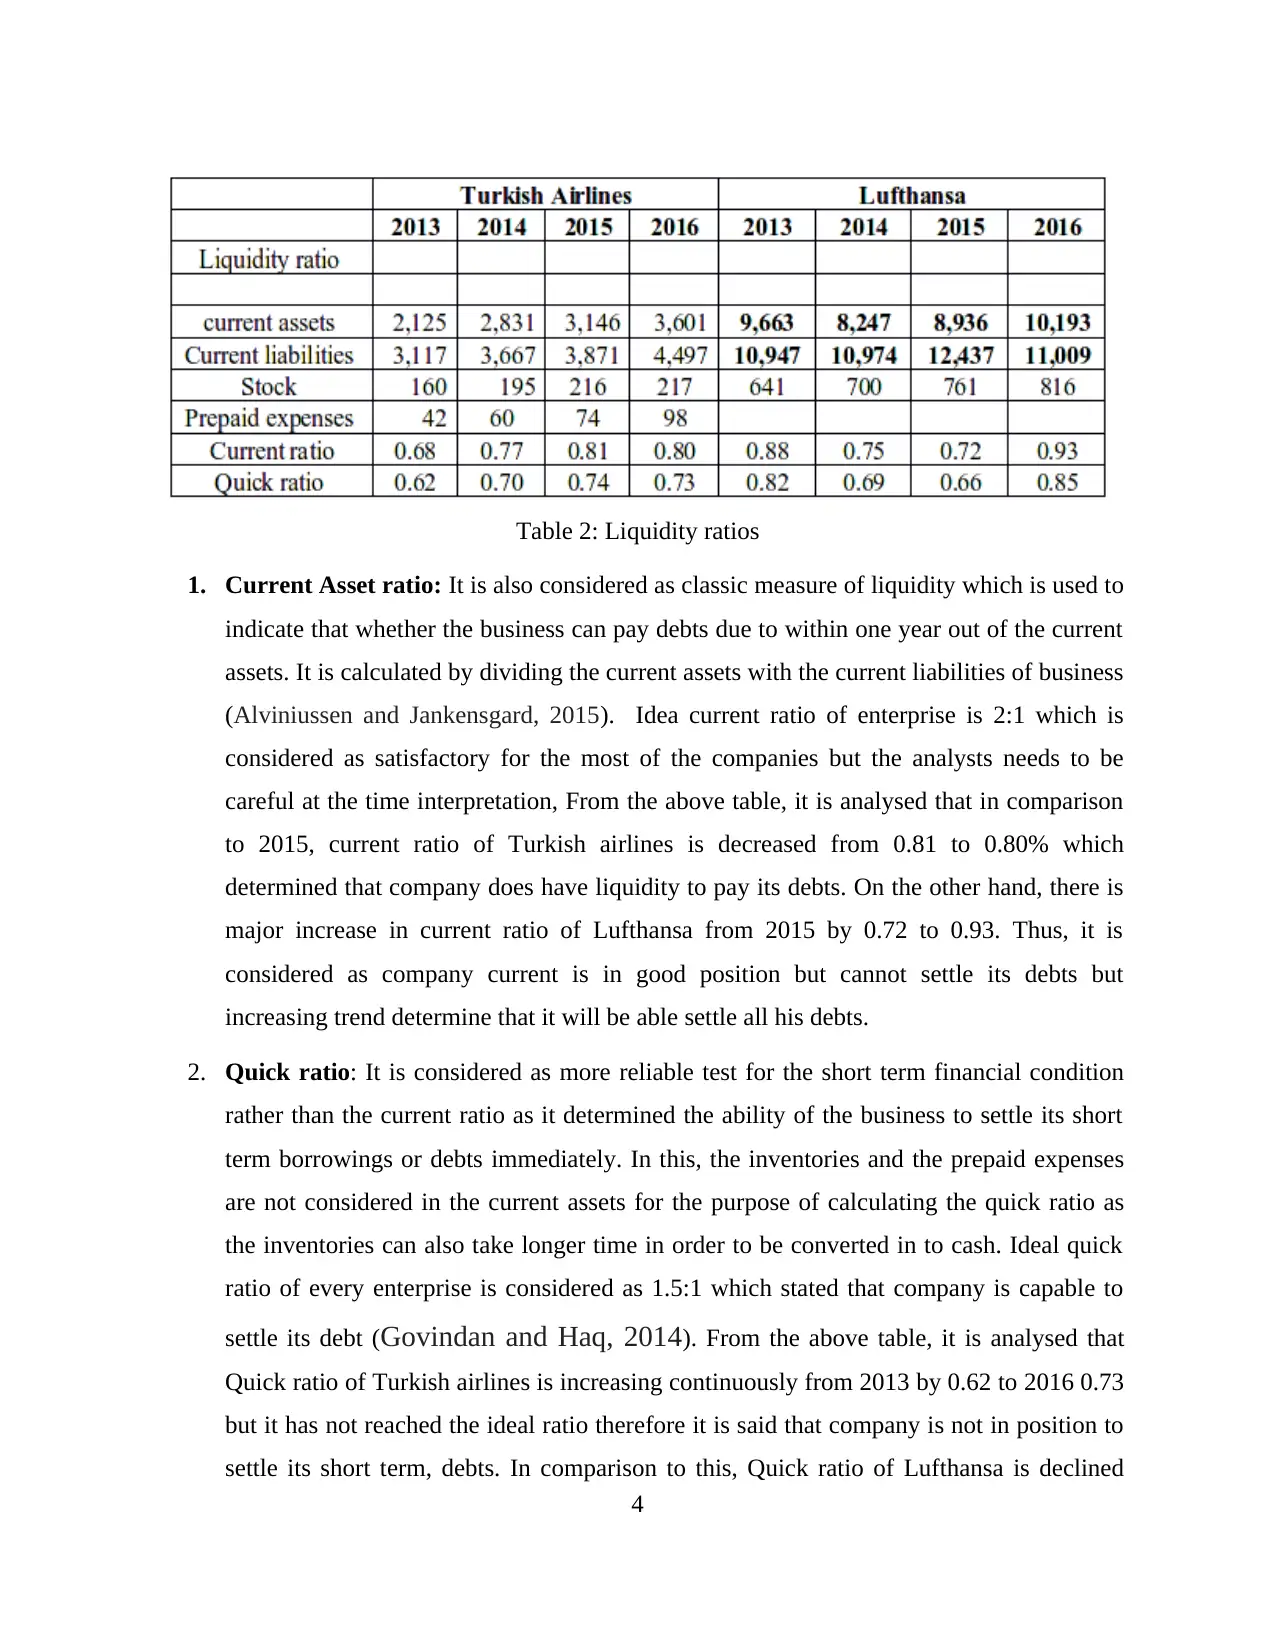
1. Current Asset ratio: It is also considered as classic measure of liquidity which is used to
indicate that whether the business can pay debts due to within one year out of the current
assets. It is calculated by dividing the current assets with the current liabilities of business
(Alviniussen and Jankensgard, 2015). Idea current ratio of enterprise is 2:1 which is
considered as satisfactory for the most of the companies but the analysts needs to be
careful at the time interpretation, From the above table, it is analysed that in comparison
to 2015, current ratio of Turkish airlines is decreased from 0.81 to 0.80% which
determined that company does have liquidity to pay its debts. On the other hand, there is
major increase in current ratio of Lufthansa from 2015 by 0.72 to 0.93. Thus, it is
considered as company current is in good position but cannot settle its debts but
increasing trend determine that it will be able settle all his debts.
2. Quick ratio: It is considered as more reliable test for the short term financial condition
rather than the current ratio as it determined the ability of the business to settle its short
term borrowings or debts immediately. In this, the inventories and the prepaid expenses
are not considered in the current assets for the purpose of calculating the quick ratio as
the inventories can also take longer time in order to be converted in to cash. Ideal quick
ratio of every enterprise is considered as 1.5:1 which stated that company is capable to
settle its debt (Govindan and Haq, 2014). From the above table, it is analysed that
Quick ratio of Turkish airlines is increasing continuously from 2013 by 0.62 to 2016 0.73
but it has not reached the ideal ratio therefore it is said that company is not in position to
settle its short term, debts. In comparison to this, Quick ratio of Lufthansa is declined
4
Table 2: Liquidity ratios
⊘ This is a preview!⊘
Do you want full access?
Subscribe today to unlock all pages.
Trusted by 1+ million students worldwide
from 2013 by 0.82 to 2015 by 0.66 but after that it was directly increased to 0.85 in the
year 2016 which states that the company is good position and near the ideal ratio.
However, it is expected that it will be able to settle its debts in the future.
Thus, it can be said that the financial performance of Lufthansa is better than Turkish
Airlines because it achieved growth in current and liquidity ratio. Increasing trend of both ratios
states that it will be able to settle its debts in the future.
Solvency ratio analysis
This ratio is also an important measure that is used to measure the ability of company to
meet its borrowings or debts and other important obligations. Solvency ration helps in analysing
financial performance of enterprise in market and also helps in getting financial resources from
investors. It involves the calculation of debt equity ratio which determined that company must
have enough equity to meet the debts.
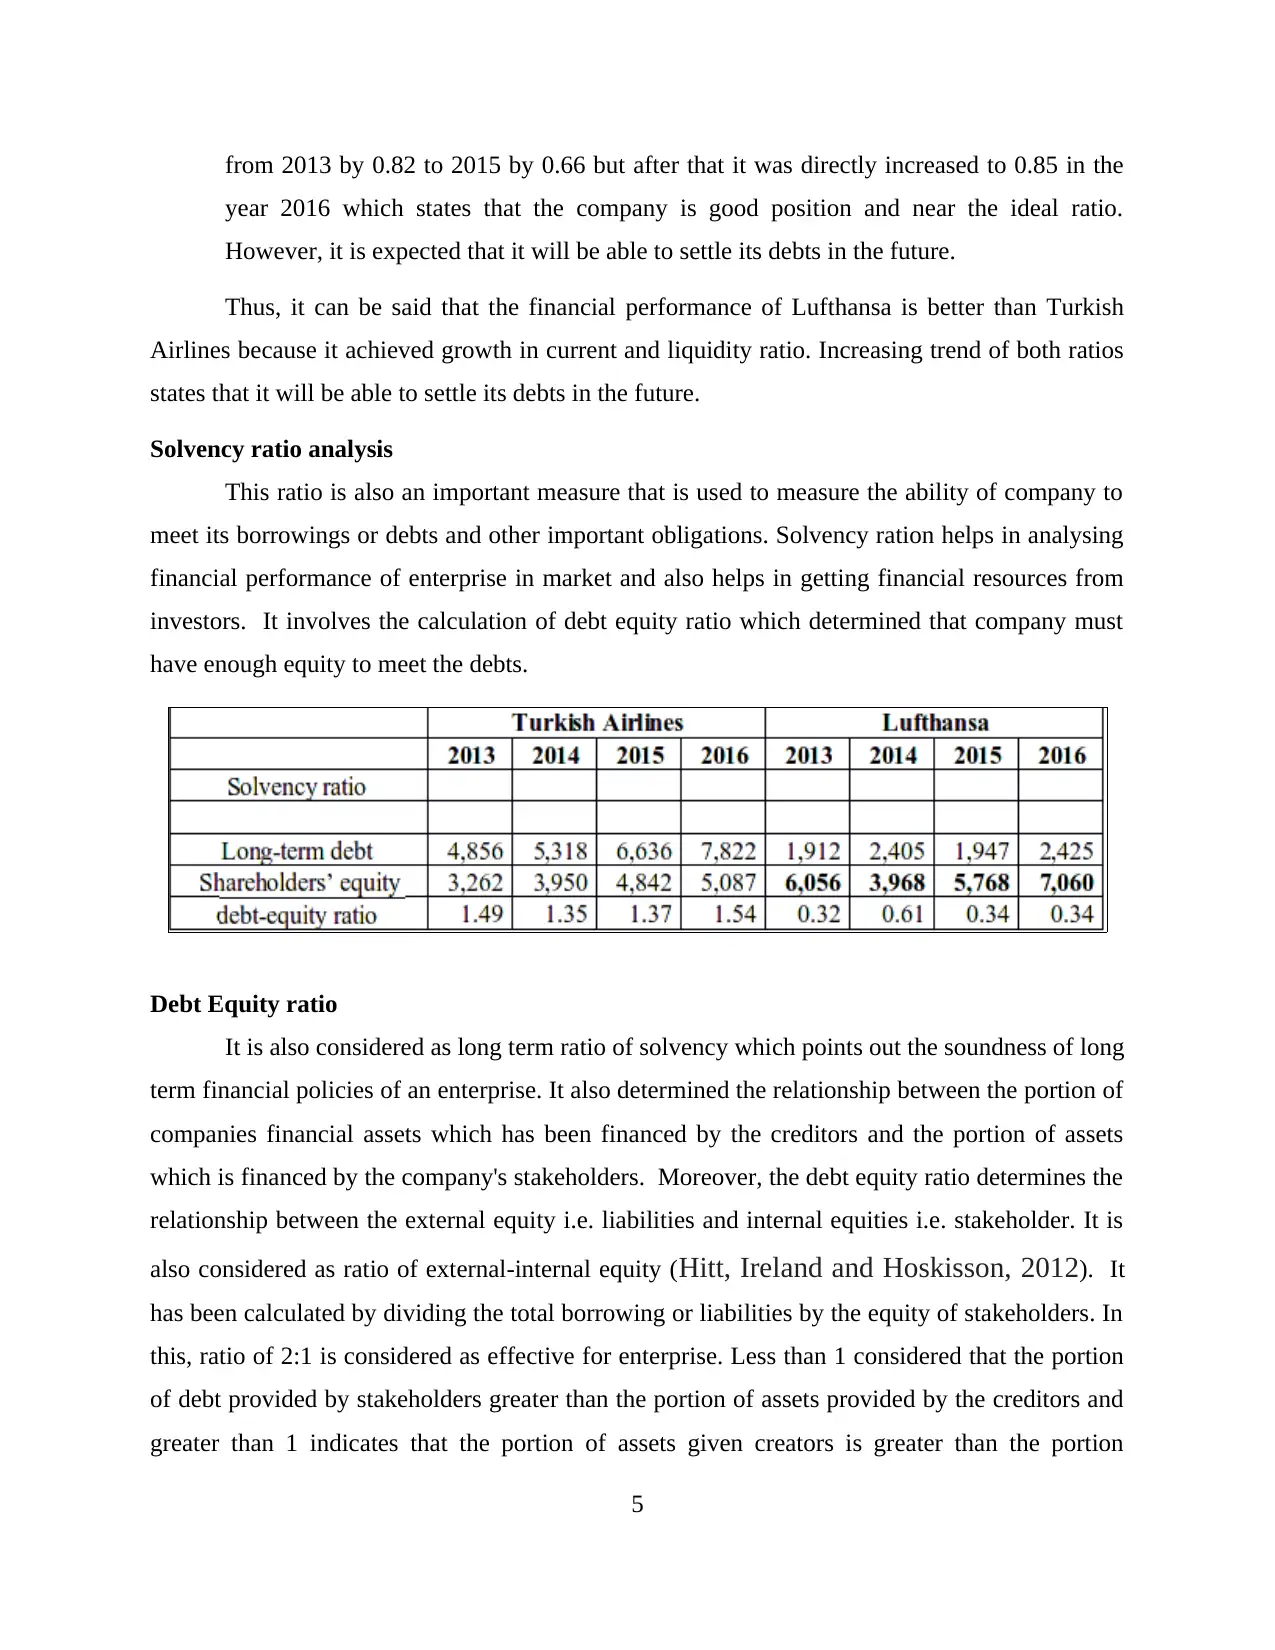
Debt Equity ratio
It is also considered as long term ratio of solvency which points out the soundness of long
term financial policies of an enterprise. It also determined the relationship between the portion of
companies financial assets which has been financed by the creditors and the portion of assets
which is financed by the company's stakeholders. Moreover, the debt equity ratio determines the
relationship between the external equity i.e. liabilities and internal equities i.e. stakeholder. It is
also considered as ratio of external-internal equity (Hitt, Ireland and Hoskisson, 2012). It
has been calculated by dividing the total borrowing or liabilities by the equity of stakeholders. In
this, ratio of 2:1 is considered as effective for enterprise. Less than 1 considered that the portion
of debt provided by stakeholders greater than the portion of assets provided by the creditors and
greater than 1 indicates that the portion of assets given creators is greater than the portion
5
year 2016 which states that the company is good position and near the ideal ratio.
However, it is expected that it will be able to settle its debts in the future.
Thus, it can be said that the financial performance of Lufthansa is better than Turkish
Airlines because it achieved growth in current and liquidity ratio. Increasing trend of both ratios
states that it will be able to settle its debts in the future.
Solvency ratio analysis
This ratio is also an important measure that is used to measure the ability of company to
meet its borrowings or debts and other important obligations. Solvency ration helps in analysing
financial performance of enterprise in market and also helps in getting financial resources from
investors. It involves the calculation of debt equity ratio which determined that company must
have enough equity to meet the debts.
Debt Equity ratio
It is also considered as long term ratio of solvency which points out the soundness of long
term financial policies of an enterprise. It also determined the relationship between the portion of
companies financial assets which has been financed by the creditors and the portion of assets
which is financed by the company's stakeholders. Moreover, the debt equity ratio determines the
relationship between the external equity i.e. liabilities and internal equities i.e. stakeholder. It is
also considered as ratio of external-internal equity (Hitt, Ireland and Hoskisson, 2012). It
has been calculated by dividing the total borrowing or liabilities by the equity of stakeholders. In
this, ratio of 2:1 is considered as effective for enterprise. Less than 1 considered that the portion
of debt provided by stakeholders greater than the portion of assets provided by the creditors and
greater than 1 indicates that the portion of assets given creators is greater than the portion
5
Paraphrase This Document
Need a fresh take? Get an instant paraphrase of this document with our AI Paraphraser
provided by the stockholders. Above table, clearly states that Debt equity ratio of Turkish
Airlines is increased from 2013 by 1.49 to 2016 by 1.54 which is considered as effective but is
required for to take its investments from equity also in order to reach the ideal ratio of 2:1. On
the other hand, Lufthansa DE ratio is constant from 2015 to 2016 by 0.34 which stated that
company has taken all its assets from equity shareholders. Therefore, company is not able to
meet its debts and needs to increase its investments from longer term debts in order to reach the
ideal ratio of 2:1. Thus, it can be said that Turkish airlines has more ability as compared
Lufthansa.
6
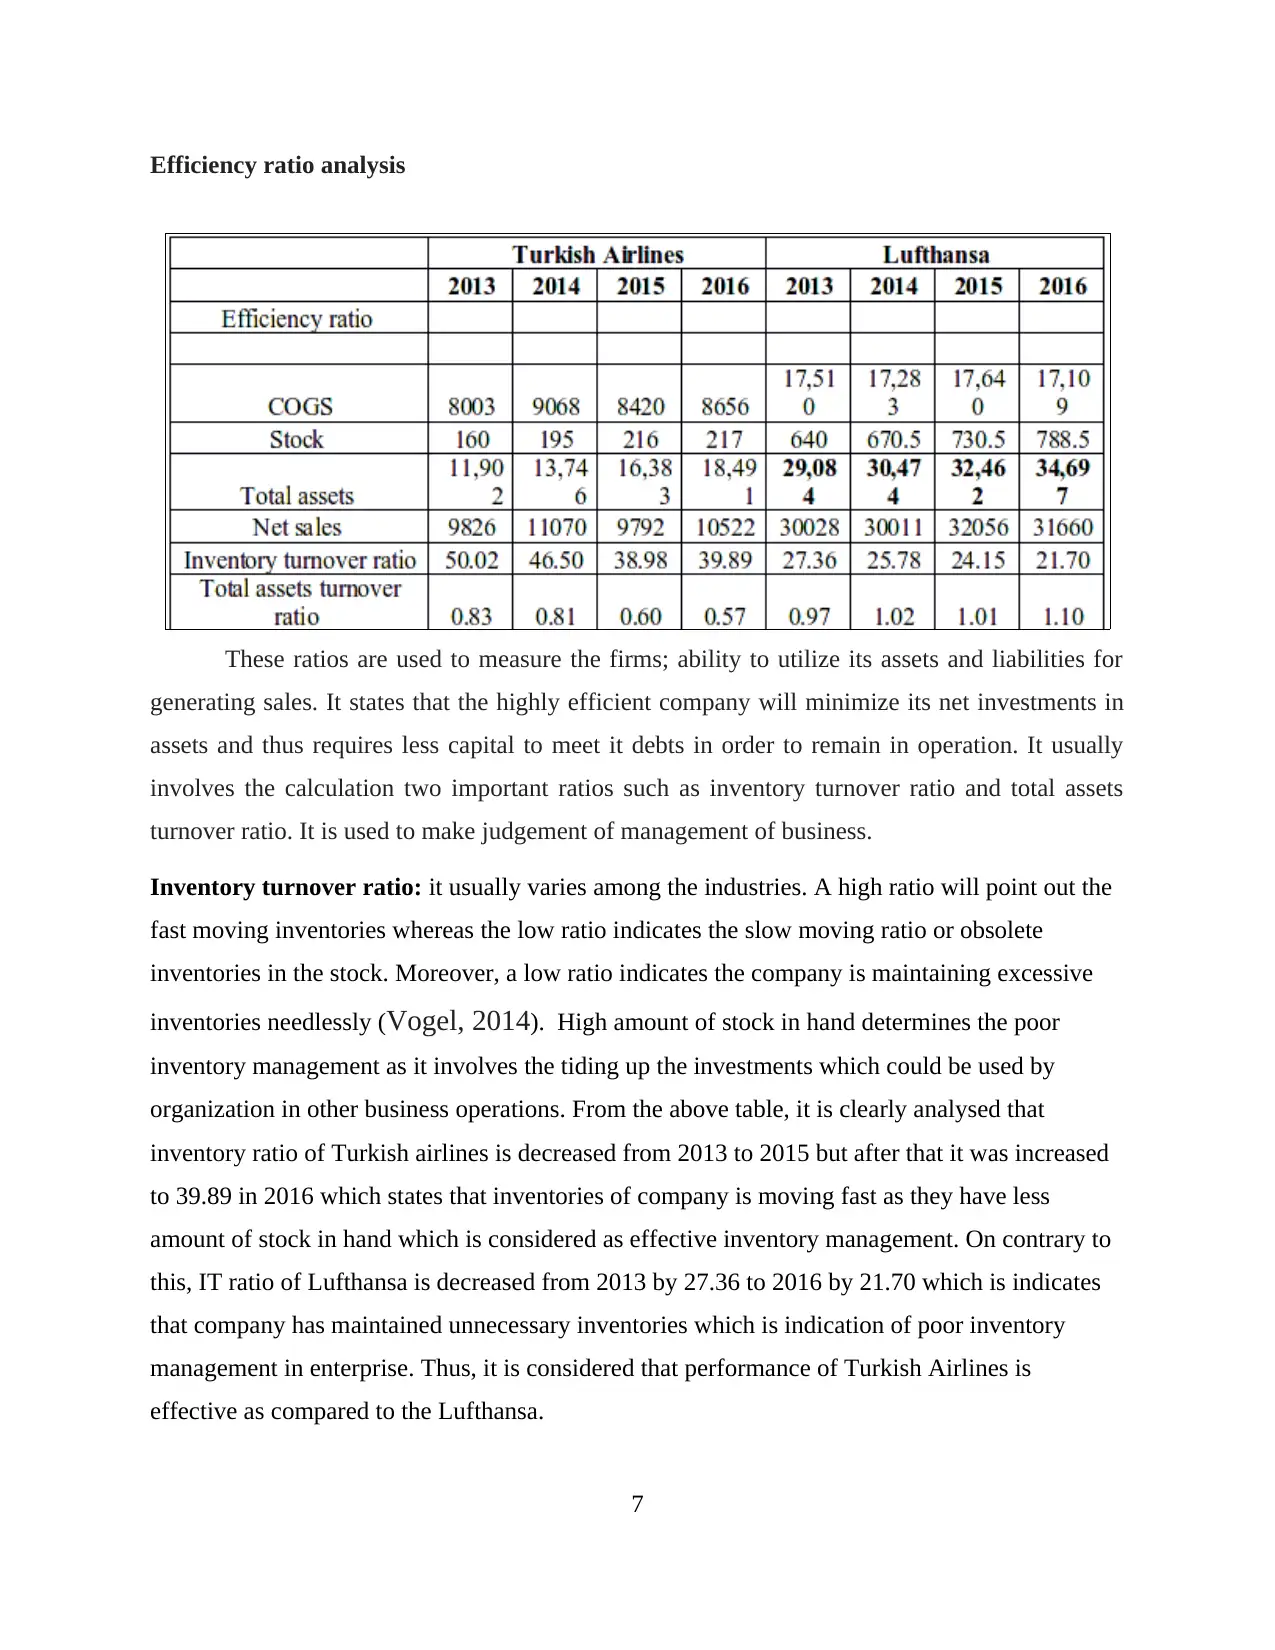
Efficiency ratio analysis
These ratios are used to measure the firms; ability to utilize its assets and liabilities for
generating sales. It states that the highly efficient company will minimize its net investments in
assets and thus requires less capital to meet it debts in order to remain in operation. It usually
involves the calculation two important ratios such as inventory turnover ratio and total assets
turnover ratio. It is used to make judgement of management of business.
Inventory turnover ratio: it usually varies among the industries. A high ratio will point out the
fast moving inventories whereas the low ratio indicates the slow moving ratio or obsolete
inventories in the stock. Moreover, a low ratio indicates the company is maintaining excessive
inventories needlessly (Vogel, 2014). High amount of stock in hand determines the poor
inventory management as it involves the tiding up the investments which could be used by
organization in other business operations. From the above table, it is clearly analysed that
inventory ratio of Turkish airlines is decreased from 2013 to 2015 but after that it was increased
to 39.89 in 2016 which states that inventories of company is moving fast as they have less
amount of stock in hand which is considered as effective inventory management. On contrary to
this, IT ratio of Lufthansa is decreased from 2013 by 27.36 to 2016 by 21.70 which is indicates
that company has maintained unnecessary inventories which is indication of poor inventory
management in enterprise. Thus, it is considered that performance of Turkish Airlines is
effective as compared to the Lufthansa.
7
⊘ This is a preview!⊘
Do you want full access?
Subscribe today to unlock all pages.
Trusted by 1+ million students worldwide
Total assets turnover ratio: It clearly determines the relationship between the values of assets
which are help by company to the amount of annual sales. Total assets turnover ratio will appear
to be unnatural ratio, yet it is considered as helpful in assessing how well the assets of the
business are utilized (Li, 2012). It stated that an efficient company will high profitability by
making fewer investments in assets whereas an inefficient company will perhaps unnecessarily
make a greater investments in assets in order to achieve the same values of the business. From
the above table, it is clear that Asset turnover ratio of Turkish Airlines is decreased from 2015 by
.60 to 2016 by 0.57 which indicates that company is not using its assets efficiently and most
likely have management of the production problems. On the other hand, the total equity turnover
ratio of Lufthansa is increased and reached to the satisfactory position which states the company
is using its assets more efficiently to generate sales.
Investment ratio
This ratio is used by the investors to measure the capability of the business to generate an
adequate amount of return for the business (Motiwalla and Thompson, 2012). The
employers of enterprise have tied up their investments in the business and required a return
commensurate with the risk involved. It also involves calculation of earning per share by
enterprise which reflect the efficiency of enterprise to pay dividends.
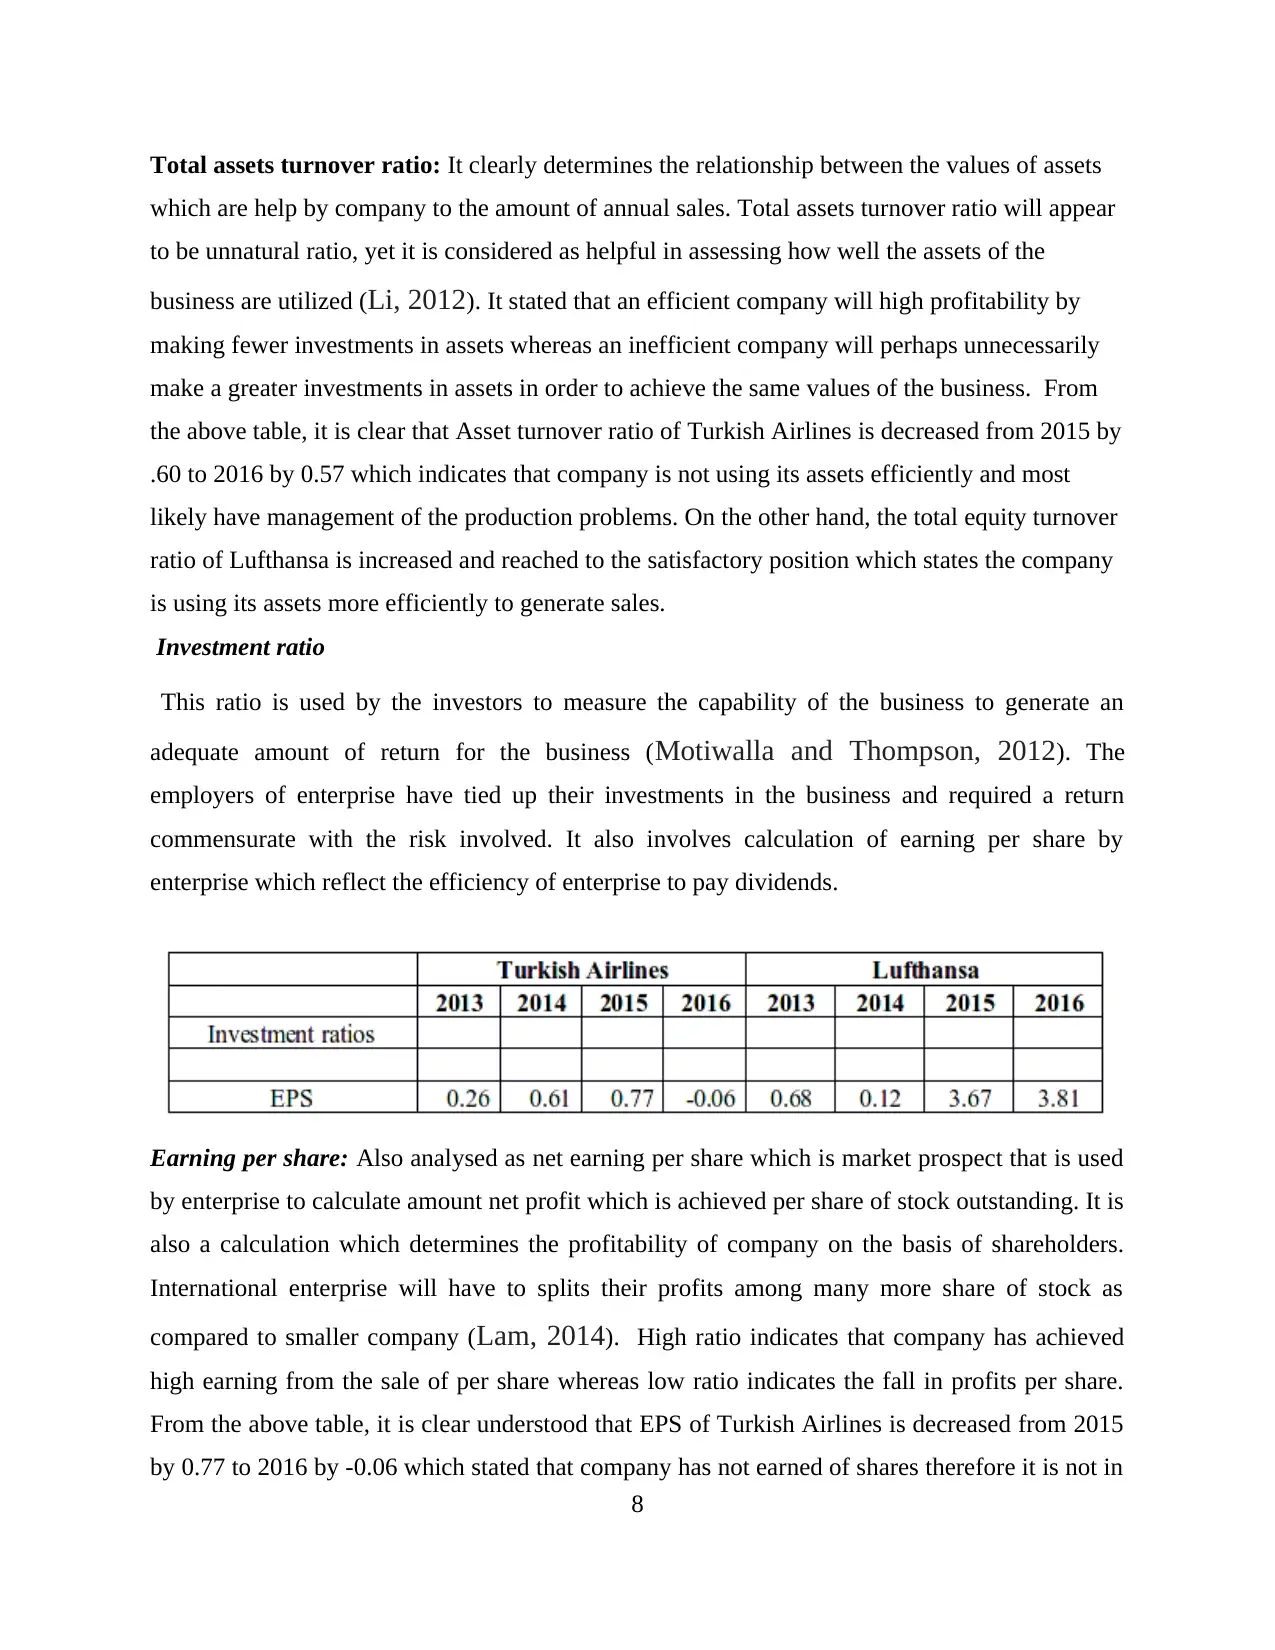
Earning per share: Also analysed as net earning per share which is market prospect that is used
by enterprise to calculate amount net profit which is achieved per share of stock outstanding. It is
also a calculation which determines the profitability of company on the basis of shareholders.
International enterprise will have to splits their profits among many more share of stock as
compared to smaller company (Lam, 2014). High ratio indicates that company has achieved
high earning from the sale of per share whereas low ratio indicates the fall in profits per share.
From the above table, it is clear understood that EPS of Turkish Airlines is decreased from 2015
by 0.77 to 2016 by -0.06 which stated that company has not earned of shares therefore it is not in
8
which are help by company to the amount of annual sales. Total assets turnover ratio will appear
to be unnatural ratio, yet it is considered as helpful in assessing how well the assets of the
business are utilized (Li, 2012). It stated that an efficient company will high profitability by
making fewer investments in assets whereas an inefficient company will perhaps unnecessarily
make a greater investments in assets in order to achieve the same values of the business. From
the above table, it is clear that Asset turnover ratio of Turkish Airlines is decreased from 2015 by
.60 to 2016 by 0.57 which indicates that company is not using its assets efficiently and most
likely have management of the production problems. On the other hand, the total equity turnover
ratio of Lufthansa is increased and reached to the satisfactory position which states the company
is using its assets more efficiently to generate sales.
Investment ratio
This ratio is used by the investors to measure the capability of the business to generate an
adequate amount of return for the business (Motiwalla and Thompson, 2012). The
employers of enterprise have tied up their investments in the business and required a return
commensurate with the risk involved. It also involves calculation of earning per share by
enterprise which reflect the efficiency of enterprise to pay dividends.
Earning per share: Also analysed as net earning per share which is market prospect that is used
by enterprise to calculate amount net profit which is achieved per share of stock outstanding. It is
also a calculation which determines the profitability of company on the basis of shareholders.
International enterprise will have to splits their profits among many more share of stock as
compared to smaller company (Lam, 2014). High ratio indicates that company has achieved
high earning from the sale of per share whereas low ratio indicates the fall in profits per share.
From the above table, it is clear understood that EPS of Turkish Airlines is decreased from 2015
by 0.77 to 2016 by -0.06 which stated that company has not earned of shares therefore it is not in
8
Paraphrase This Document
Need a fresh take? Get an instant paraphrase of this document with our AI Paraphraser
good position. In comparison to this, EPS of Lufthansa is increasing continuously from 2015 by
3.67 to 2016 by 3.81 which is stated that company has achieved adequate amount of earning per
share. Therefore its is able provided dividends to his shareholders.
Thus, from the above analysis of ratio is it clearly understood that the financial position of
Lufthansa is better than Turkish Airlines. Moreover, it has also achieved an excellent high
financial position in Aviation industry which is positive sign of growth and development in
business operations.
2. Cash flow ratios of Emirates from the period of 2012 to 2016 are enumerated below:
Cash flow statements is typically breaks out the companies sources of generating the cash
and utilizes for the period in to three important categories i.e. cash flows from the operating
activities and cash flows from the investing activities (Aebi, Sabato and Schmid, 2012). It
is also significant to considered that the amount of cash flows is not similar as the net incomes
which involves the transaction which did not involves the actual money transfers. In present
context, cash flow ratios of Emirates is also calculated in order to determined its current financial
performance and position in aviation industry.
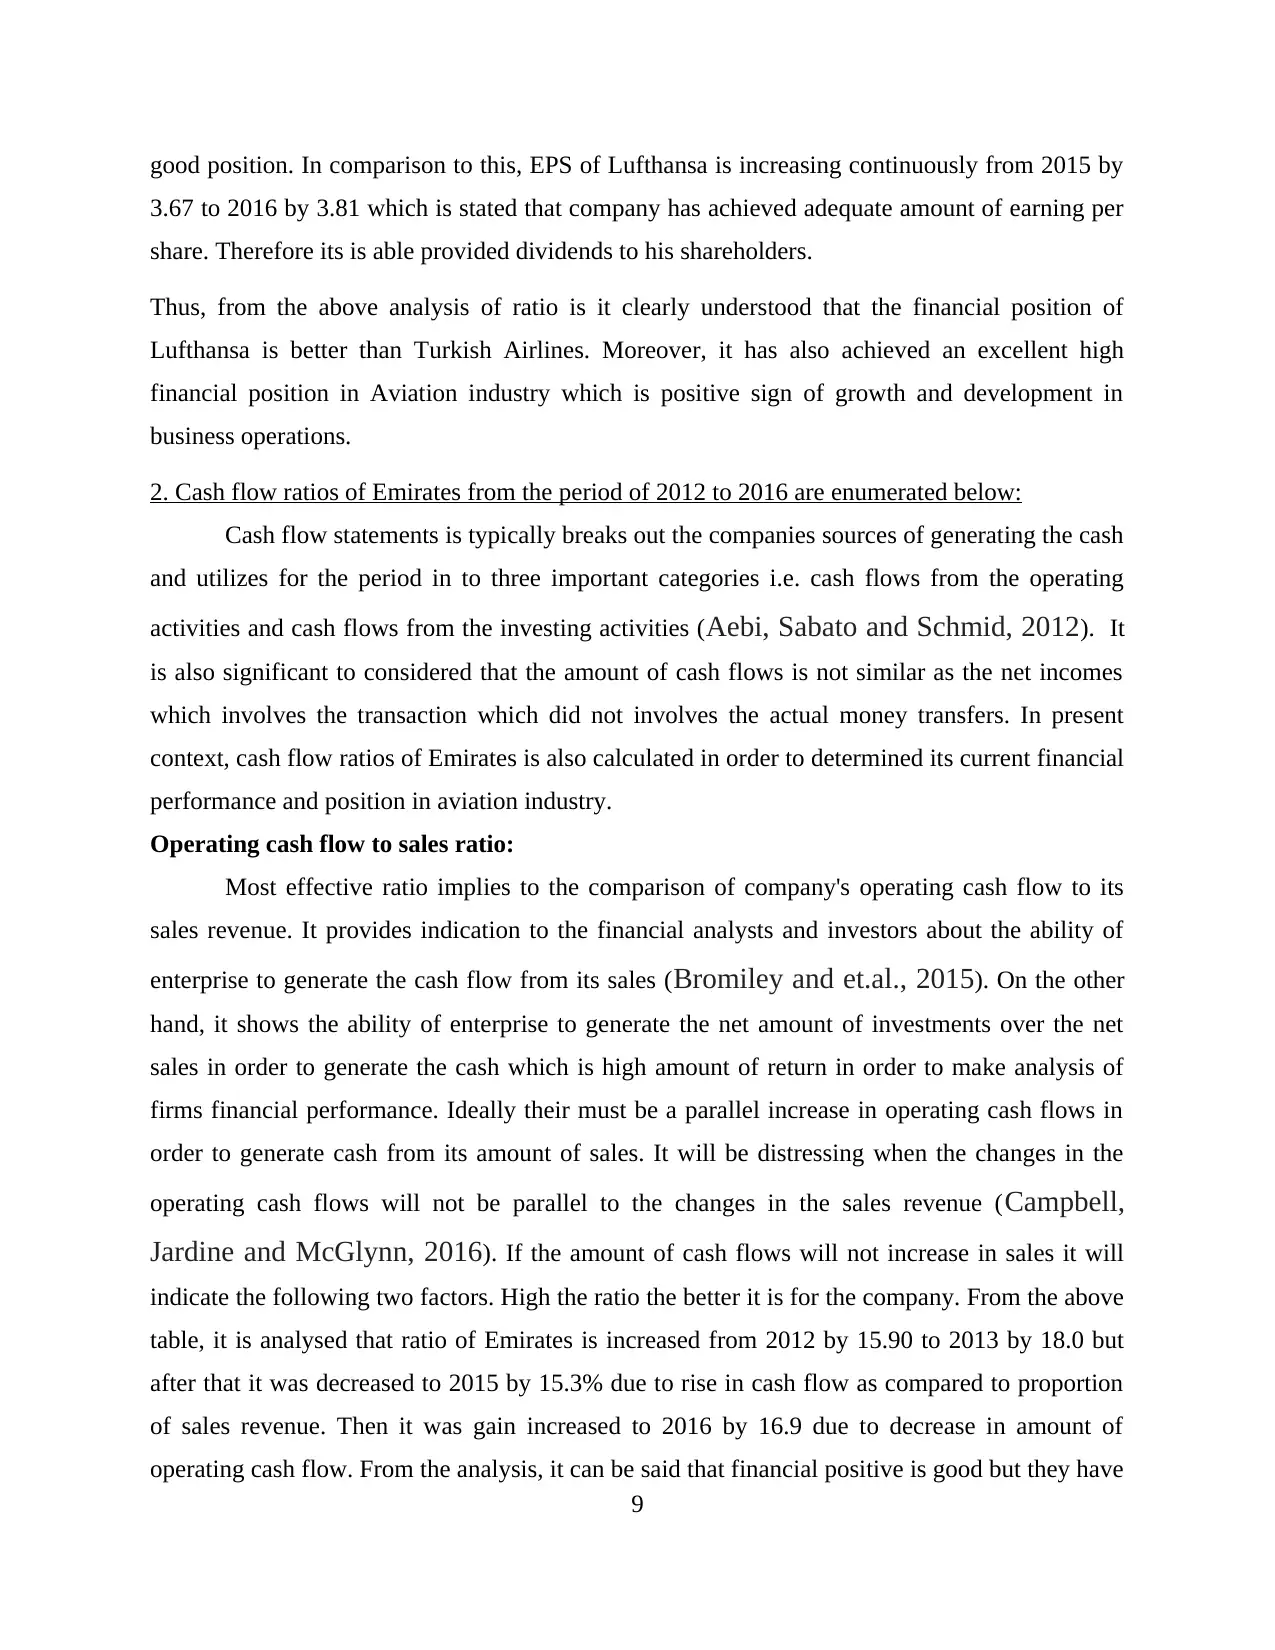
Operating cash flow to sales ratio:
Most effective ratio implies to the comparison of company's operating cash flow to its
sales revenue. It provides indication to the financial analysts and investors about the ability of
enterprise to generate the cash flow from its sales (Bromiley and et.al., 2015). On the other
hand, it shows the ability of enterprise to generate the net amount of investments over the net
sales in order to generate the cash which is high amount of return in order to make analysis of
firms financial performance. Ideally their must be a parallel increase in operating cash flows in
order to generate cash from its amount of sales. It will be distressing when the changes in the
operating cash flows will not be parallel to the changes in the sales revenue (Campbell,
Jardine and McGlynn, 2016). If the amount of cash flows will not increase in sales it will
indicate the following two factors. High the ratio the better it is for the company. From the above
table, it is analysed that ratio of Emirates is increased from 2012 by 15.90 to 2013 by 18.0 but
after that it was decreased to 2015 by 15.3% due to rise in cash flow as compared to proportion
of sales revenue. Then it was gain increased to 2016 by 16.9 due to decrease in amount of
operating cash flow. From the analysis, it can be said that financial positive is good but they have
9
3.67 to 2016 by 3.81 which is stated that company has achieved adequate amount of earning per
share. Therefore its is able provided dividends to his shareholders.
Thus, from the above analysis of ratio is it clearly understood that the financial position of
Lufthansa is better than Turkish Airlines. Moreover, it has also achieved an excellent high
financial position in Aviation industry which is positive sign of growth and development in
business operations.
2. Cash flow ratios of Emirates from the period of 2012 to 2016 are enumerated below:
Cash flow statements is typically breaks out the companies sources of generating the cash
and utilizes for the period in to three important categories i.e. cash flows from the operating
activities and cash flows from the investing activities (Aebi, Sabato and Schmid, 2012). It
is also significant to considered that the amount of cash flows is not similar as the net incomes
which involves the transaction which did not involves the actual money transfers. In present
context, cash flow ratios of Emirates is also calculated in order to determined its current financial
performance and position in aviation industry.
Operating cash flow to sales ratio:
Most effective ratio implies to the comparison of company's operating cash flow to its
sales revenue. It provides indication to the financial analysts and investors about the ability of
enterprise to generate the cash flow from its sales (Bromiley and et.al., 2015). On the other
hand, it shows the ability of enterprise to generate the net amount of investments over the net
sales in order to generate the cash which is high amount of return in order to make analysis of
firms financial performance. Ideally their must be a parallel increase in operating cash flows in
order to generate cash from its amount of sales. It will be distressing when the changes in the
operating cash flows will not be parallel to the changes in the sales revenue (Campbell,
Jardine and McGlynn, 2016). If the amount of cash flows will not increase in sales it will
indicate the following two factors. High the ratio the better it is for the company. From the above
table, it is analysed that ratio of Emirates is increased from 2012 by 15.90 to 2013 by 18.0 but
after that it was decreased to 2015 by 15.3% due to rise in cash flow as compared to proportion
of sales revenue. Then it was gain increased to 2016 by 16.9 due to decrease in amount of
operating cash flow. From the analysis, it can be said that financial positive is good but they have
9
concentrate more on generating the sales revenue and reduction of cash flow in order to raise the
profitability.
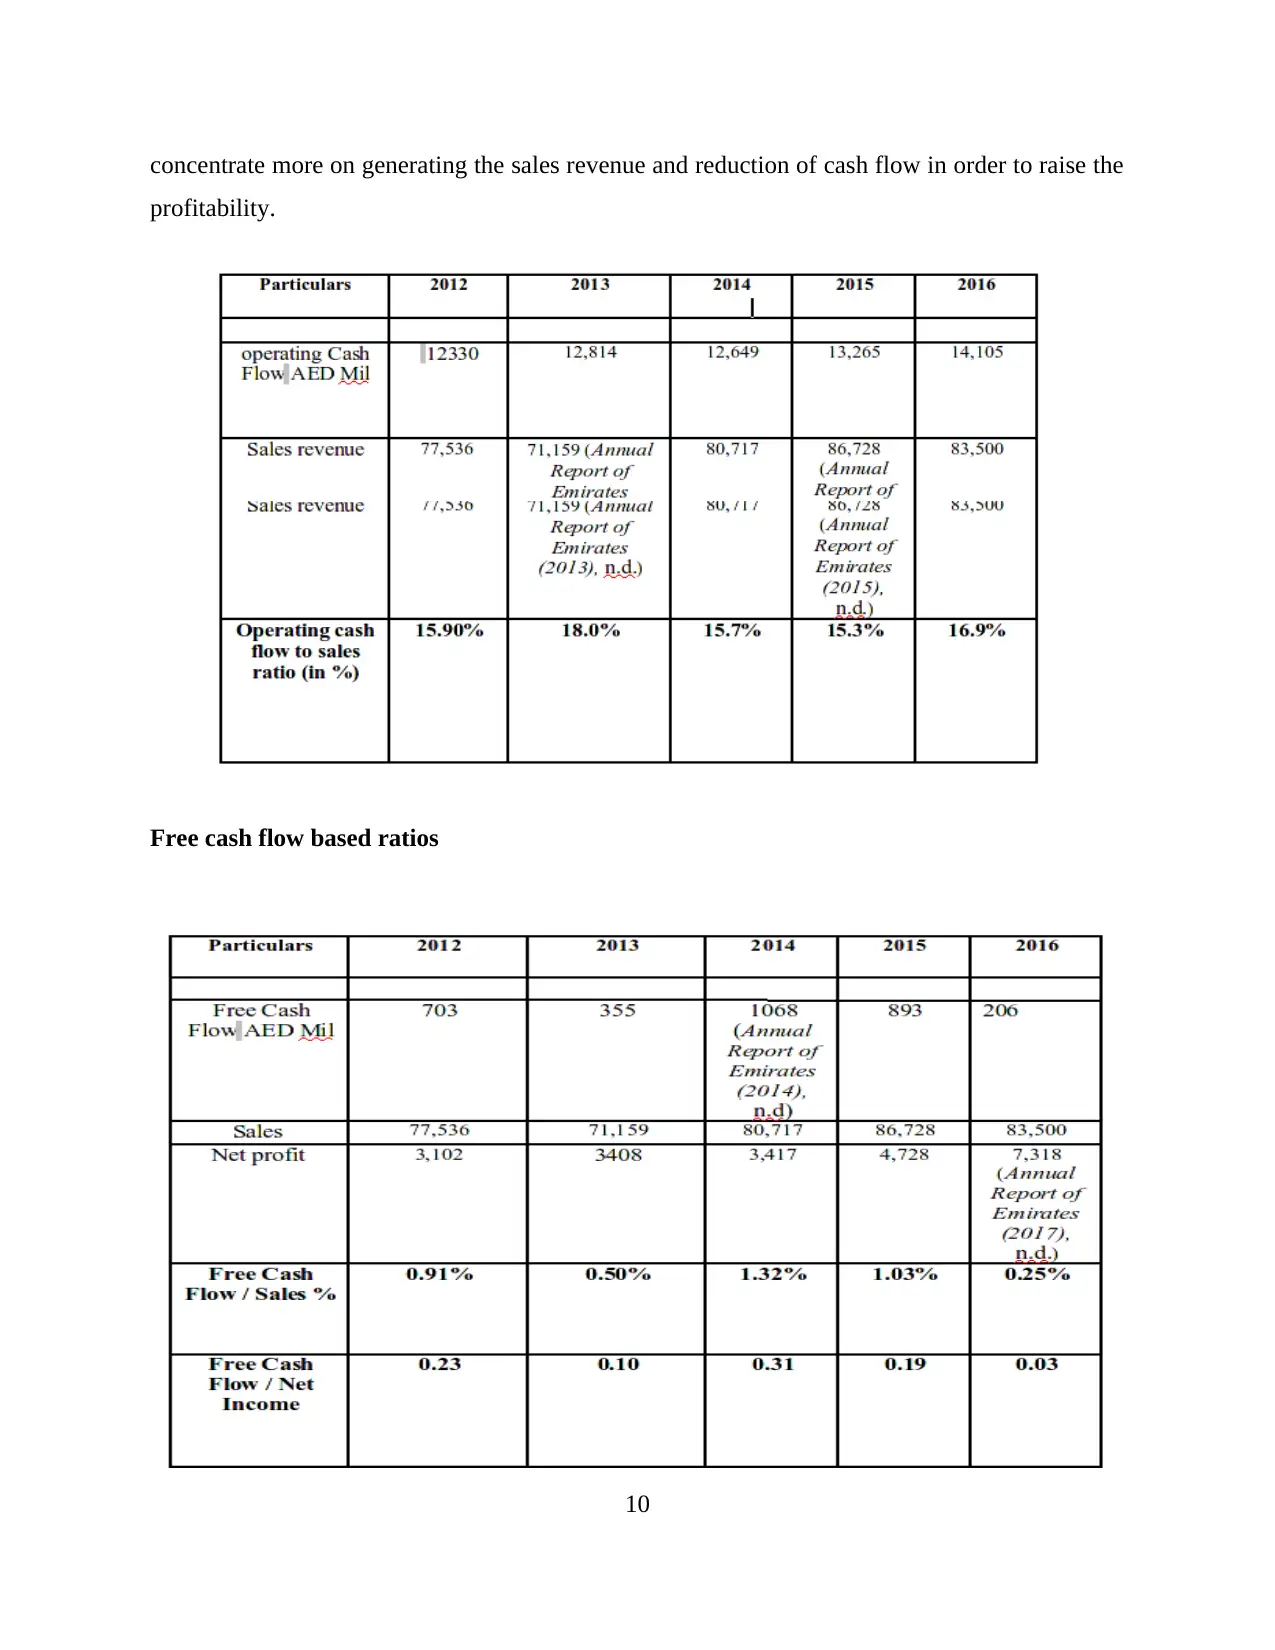
Free cash flow based ratios
10
profitability.
Free cash flow based ratios
10
⊘ This is a preview!⊘
Do you want full access?
Subscribe today to unlock all pages.
Trusted by 1+ million students worldwide
1 out of 15
Related Documents


Your All-in-One AI-Powered Toolkit for Academic Success.
+13062052269
info@desklib.com
Available 24*7 on WhatsApp / Email
![[object Object]](/_next/static/media/star-bottom.7253800d.svg)
Unlock your academic potential
Copyright © 2020–2026 A2Z Services. All Rights Reserved. Developed and managed by ZUCOL.