Optimizing Advertising Spend: TV and Radio Marketing Project Analysis

Verified

Added on  2019/09/18

|3
|420
|264
Project
AI Summary
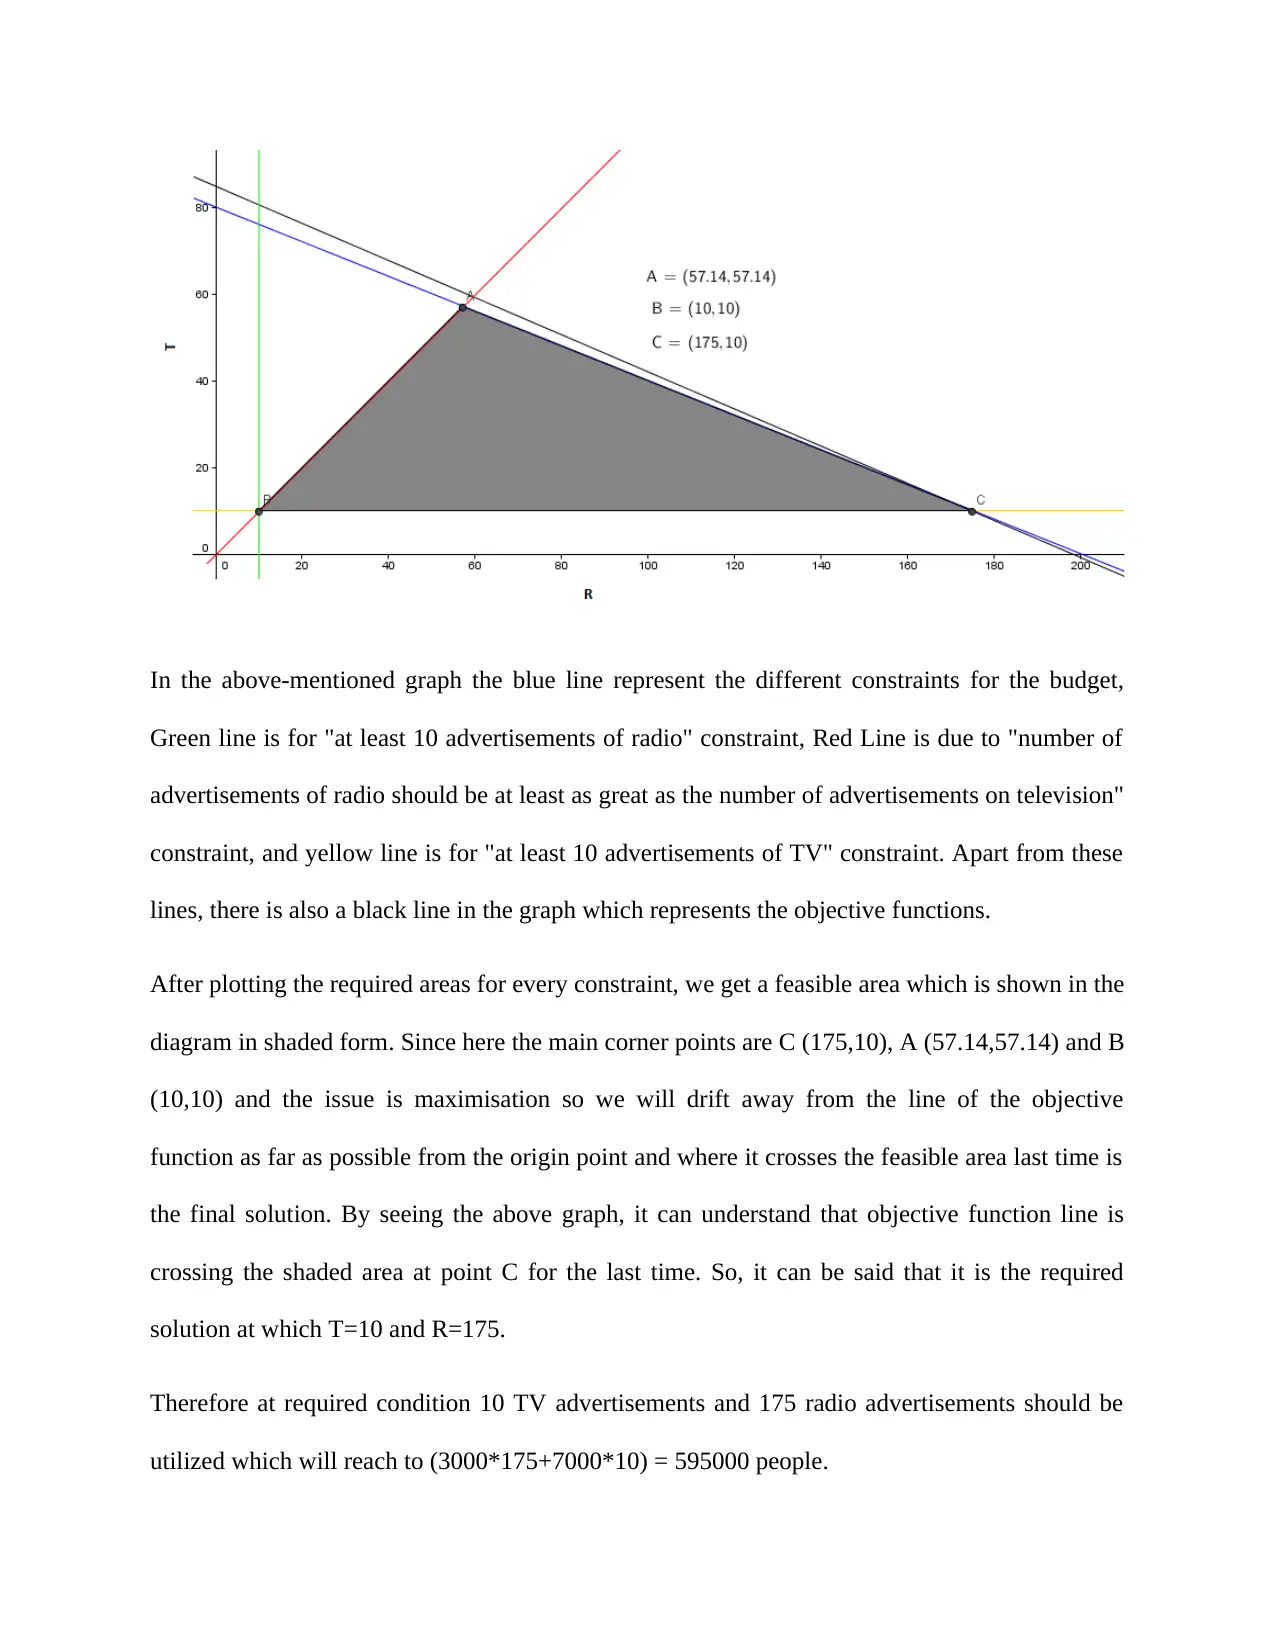
This project analyzes the optimal allocation of a $40,000 advertising budget between television and radio advertisements to maximize audience reach. The solution involves formulating a linear programming problem with constraints on budget, minimum advertisement numbers, and the relationship between TV and radio ad quantities. The assignment utilizes a graphical method to determine the optimal solution, identifying the corner points of the feasible region and evaluating the objective function (total reach) at each point. The analysis concludes that 10 TV advertisements and 175 radio advertisements will maximize the reach, reaching an estimated 595,000 people. The document illustrates the graphical representation of the constraints and the objective function, providing a clear visual understanding of the solution.
Document Page
In the document, the total amount is $40,000 which must be distributed within advertisements of
Televisions and Radio. It should be in such a way that they can reach as many people as possible.
Let T consider as the number of televisions and R considered as the number of different
advertisement of radios required to maximize the reach.
Since every advertisement of the television covers an estimated number of approximate 7,000
people and every advertisement of radio covers approximates 3,000 people. Due to this, our
prime aim function is,
Maximize p=3,000*R+7,000*T
It mainly subject to,
500 T+ 200 T ≤ 40,000 (Constraint of Budget)
R-T ≥ 0 (It means that the number of advertisements of radio must be at least as great as the
number of advertisements of televisions)
R ≥ 10 (At least 10 advertisements of radio)
T ≥ 10 (At least 10 advertisements of televisions)
With the help of these equations we obtained the below-mentioned graph:
tabler-icon-diamond-filled.svg

Paraphrase This Document

Need a fresh take? Get an instant paraphrase of this document with our AI Paraphraser
Document Page
In the above-mentioned graph the blue line represent the different constraints for the budget,
Green line is for "at least 10 advertisements of radio" constraint, Red Line is due to "number of
advertisements of radio should be at least as great as the number of advertisements on television"
constraint, and yellow line is for "at least 10 advertisements of TV" constraint. Apart from these
lines, there is also a black line in the graph which represents the objective functions.
After plotting the required areas for every constraint, we get a feasible area which is shown in the
diagram in shaded form. Since here the main corner points are C (175,10), A (57.14,57.14) and B
(10,10) and the issue is maximisation so we will drift away from the line of the objective
function as far as possible from the origin point and where it crosses the feasible area last time is
the final solution. By seeing the above graph, it can understand that objective function line is
crossing the shaded area at point C for the last time. So, it can be said that it is the required
solution at which T=10 and R=175.
Therefore at required condition 10 TV advertisements and 175 radio advertisements should be
utilized which will reach to (3000*175+7000*10) = 595000 people.
Document Page
chevron_up_icon
1 out of 3
circle_padding
hide_on_mobile
zoom_out_icon
[object Object]