TV Time Data Analysis Report
VerifiedAdded on 2019/09/23
|3
|463
|211
Report
AI Summary
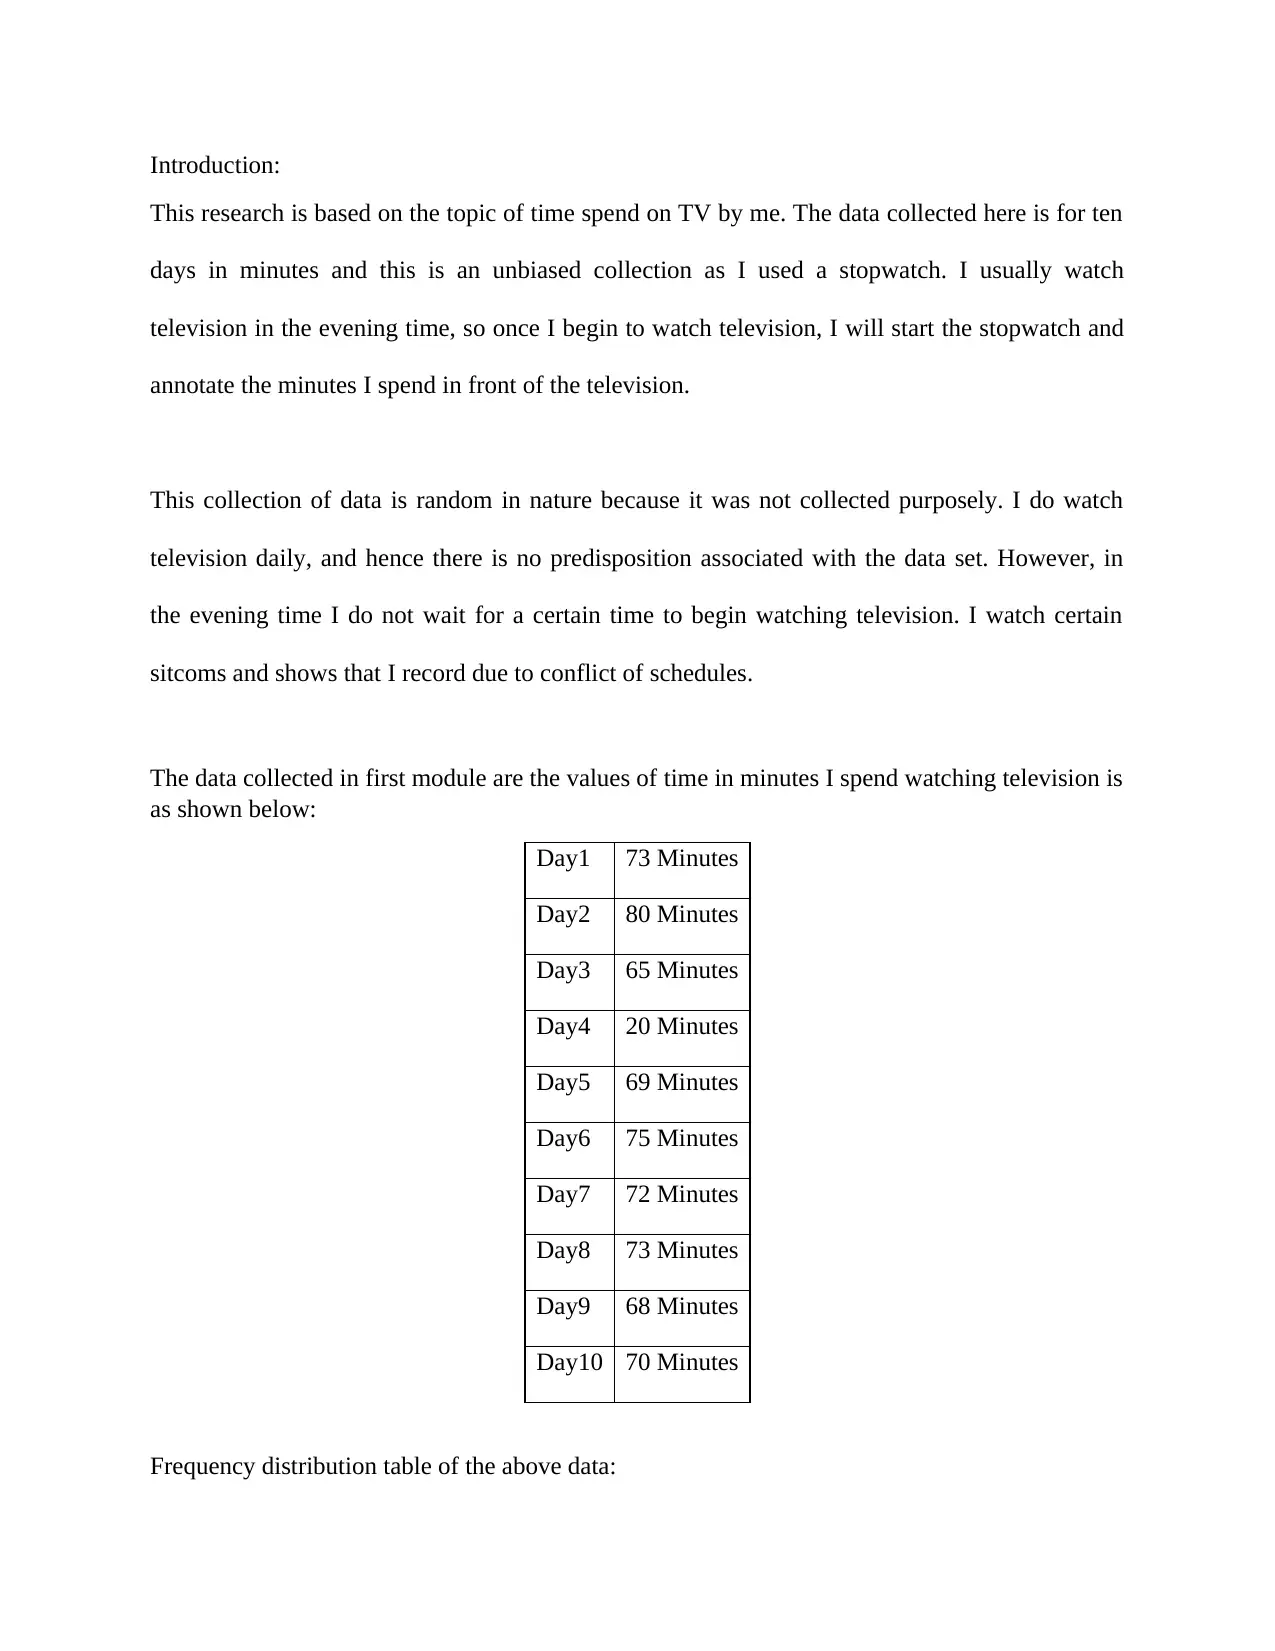
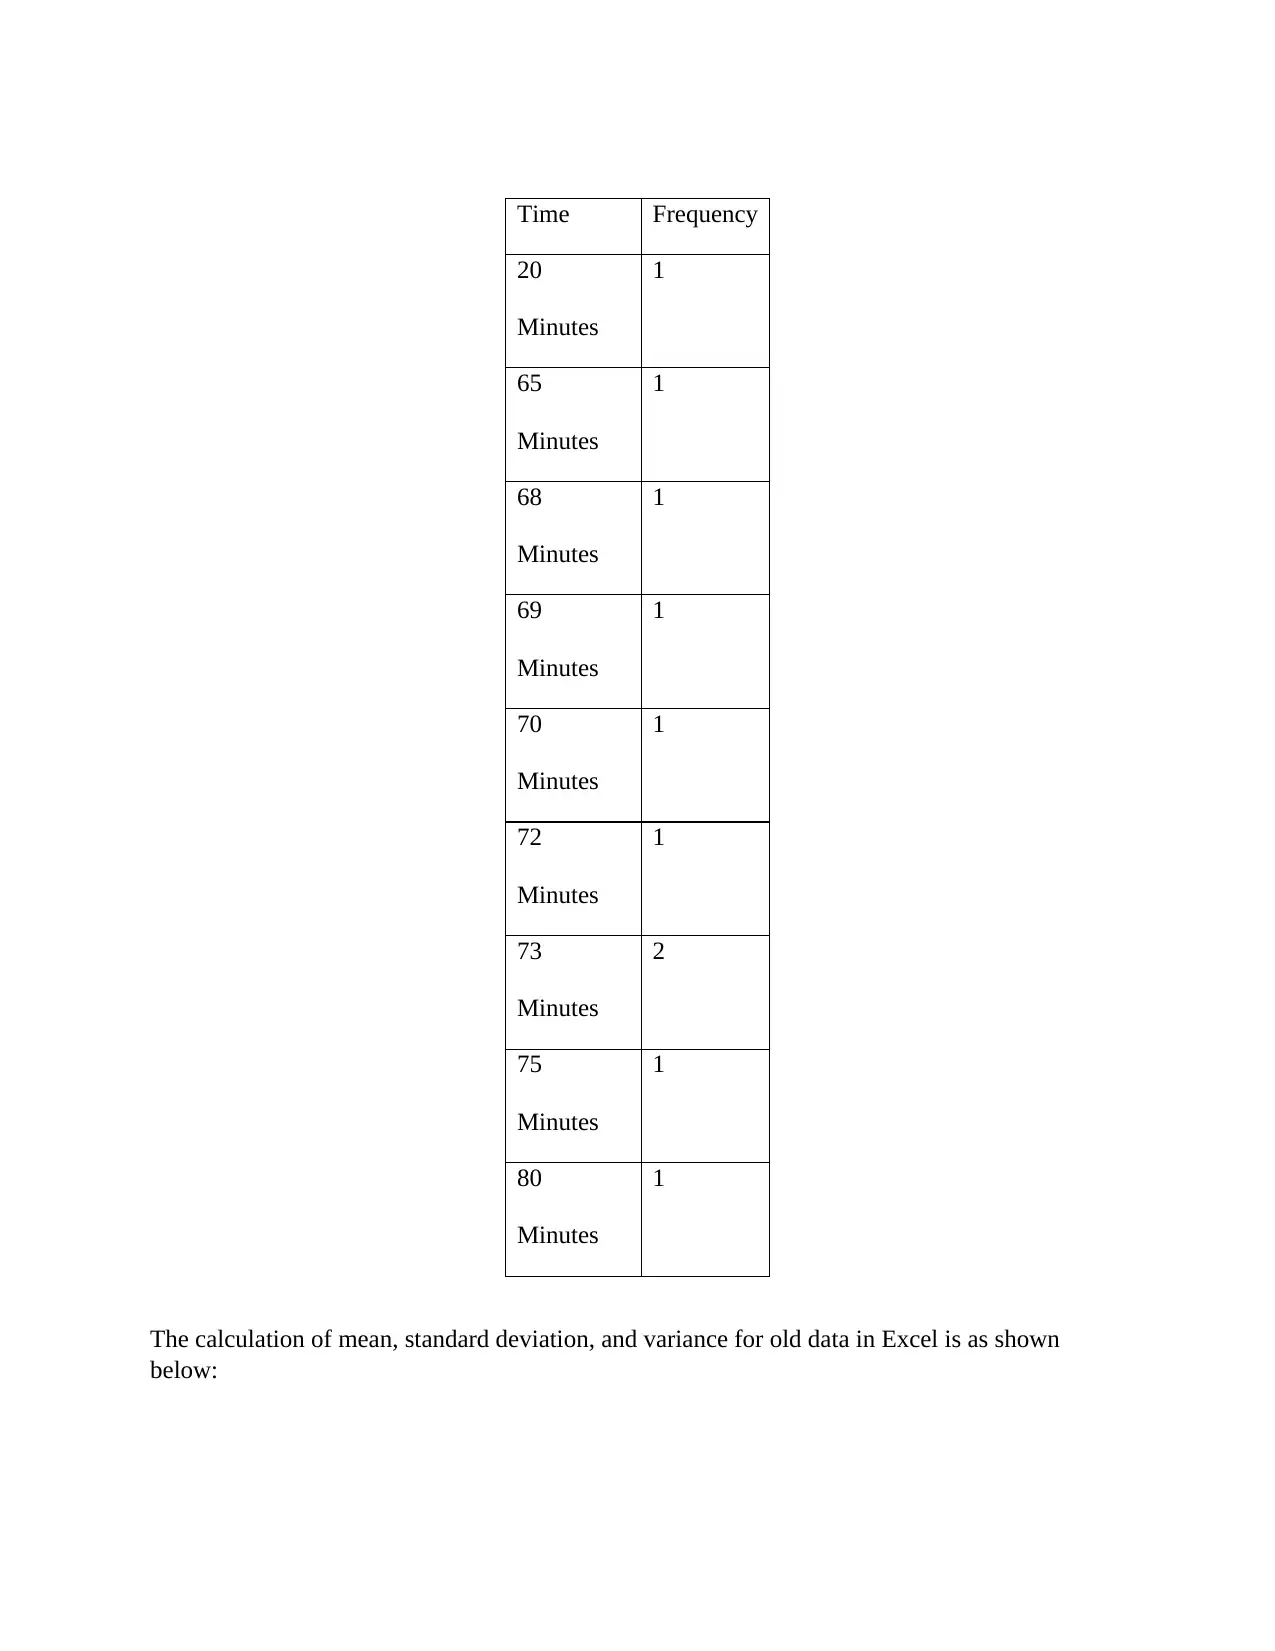
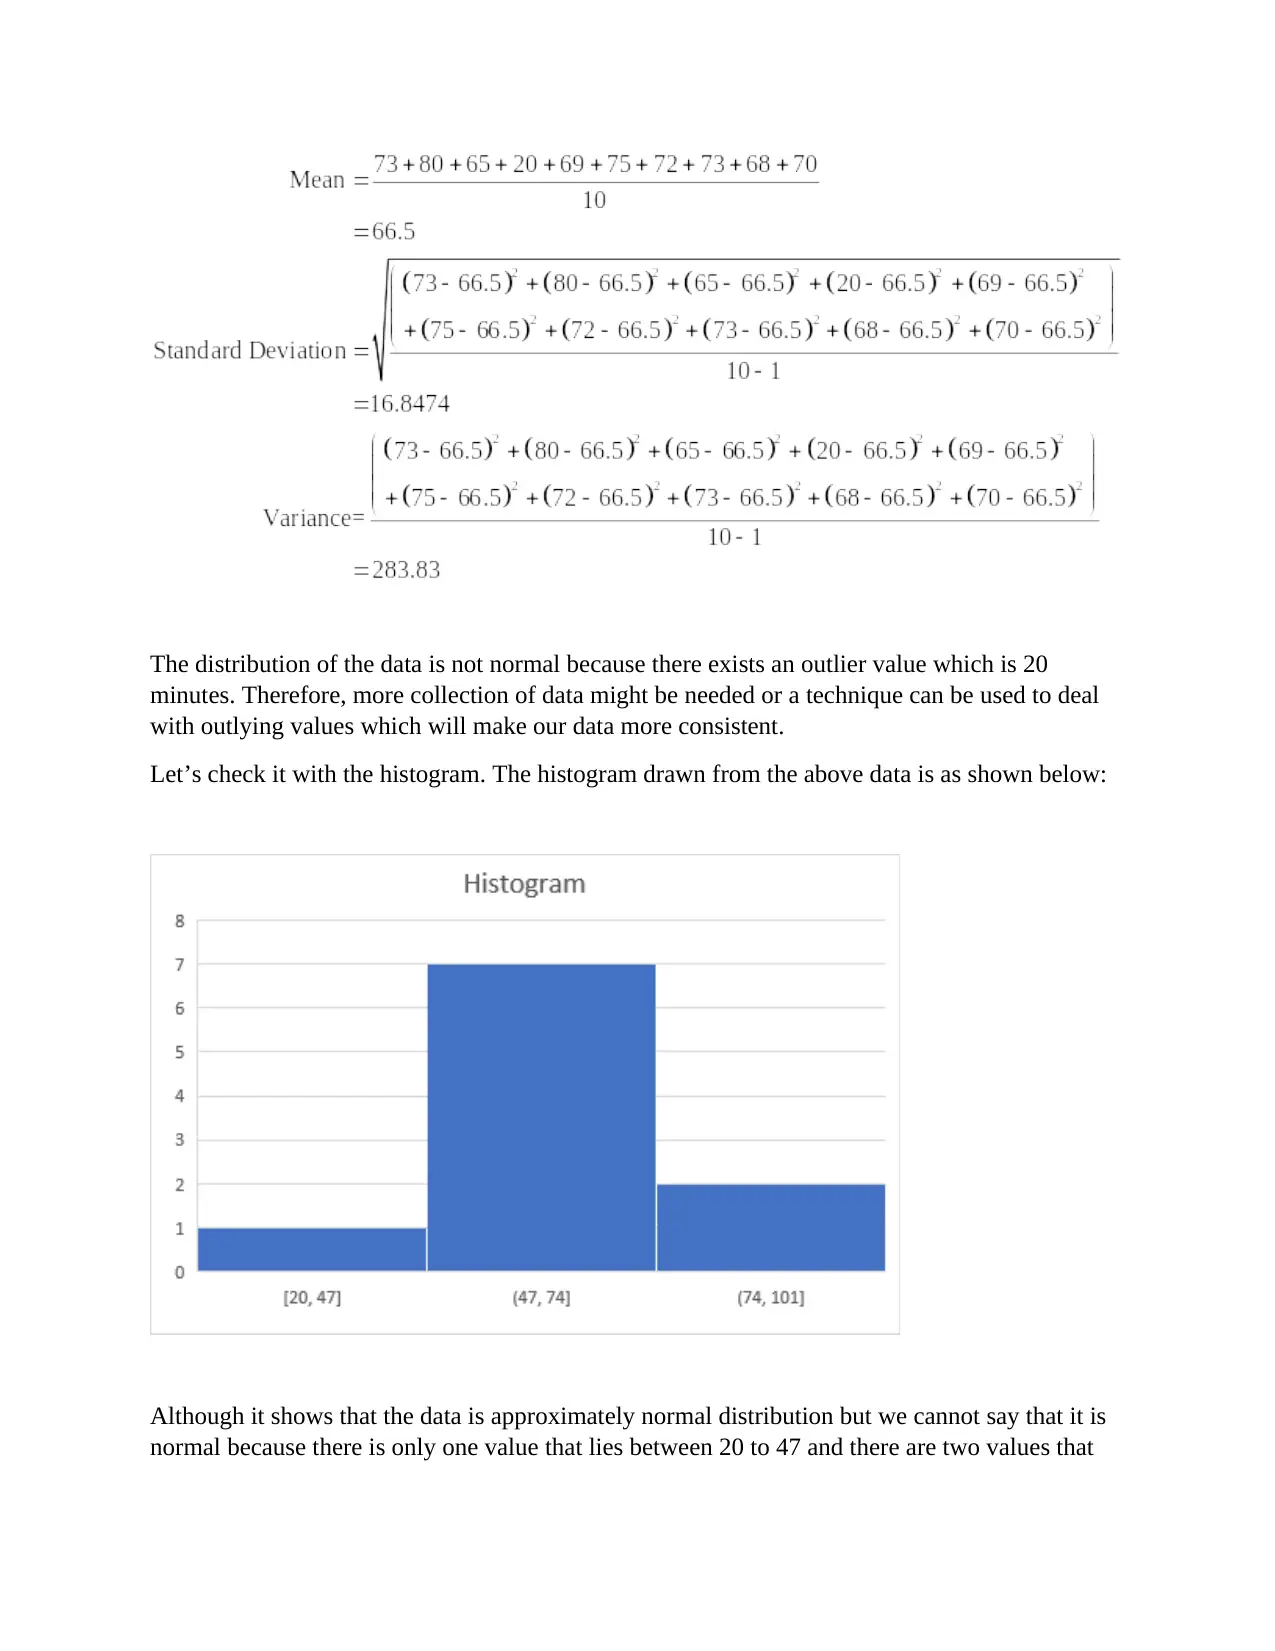
This report presents a statistical analysis of the author's daily TV viewing time over ten days. The data, collected using a stopwatch, shows varying viewing times ranging from 20 to 80 minutes. A frequency distribution table is created, and descriptive statistics (mean, standard deviation, and variance) are calculated using Excel. The report discusses the normality of the data distribution, noting the presence of an outlier (20 minutes) which affects the normality assumption. A histogram is included to visualize the data distribution. The report concludes that further data collection or outlier treatment might be necessary to improve the consistency and normality of the data. References to relevant statistics textbooks are provided.
1 out of 3
Related Documents


Your All-in-One AI-Powered Toolkit for Academic Success.
+13062052269
info@desklib.com
Available 24*7 on WhatsApp / Email
![[object Object]](/_next/static/media/star-bottom.7253800d.svg)
Copyright © 2020–2026 A2Z Services. All Rights Reserved. Developed and managed by ZUCOL.