Analyzing TV Watching Time: A Statistical Probability Approach

Verified

Added on  2019/09/23

|4
|784
|357
Homework Assignment
AI Summary
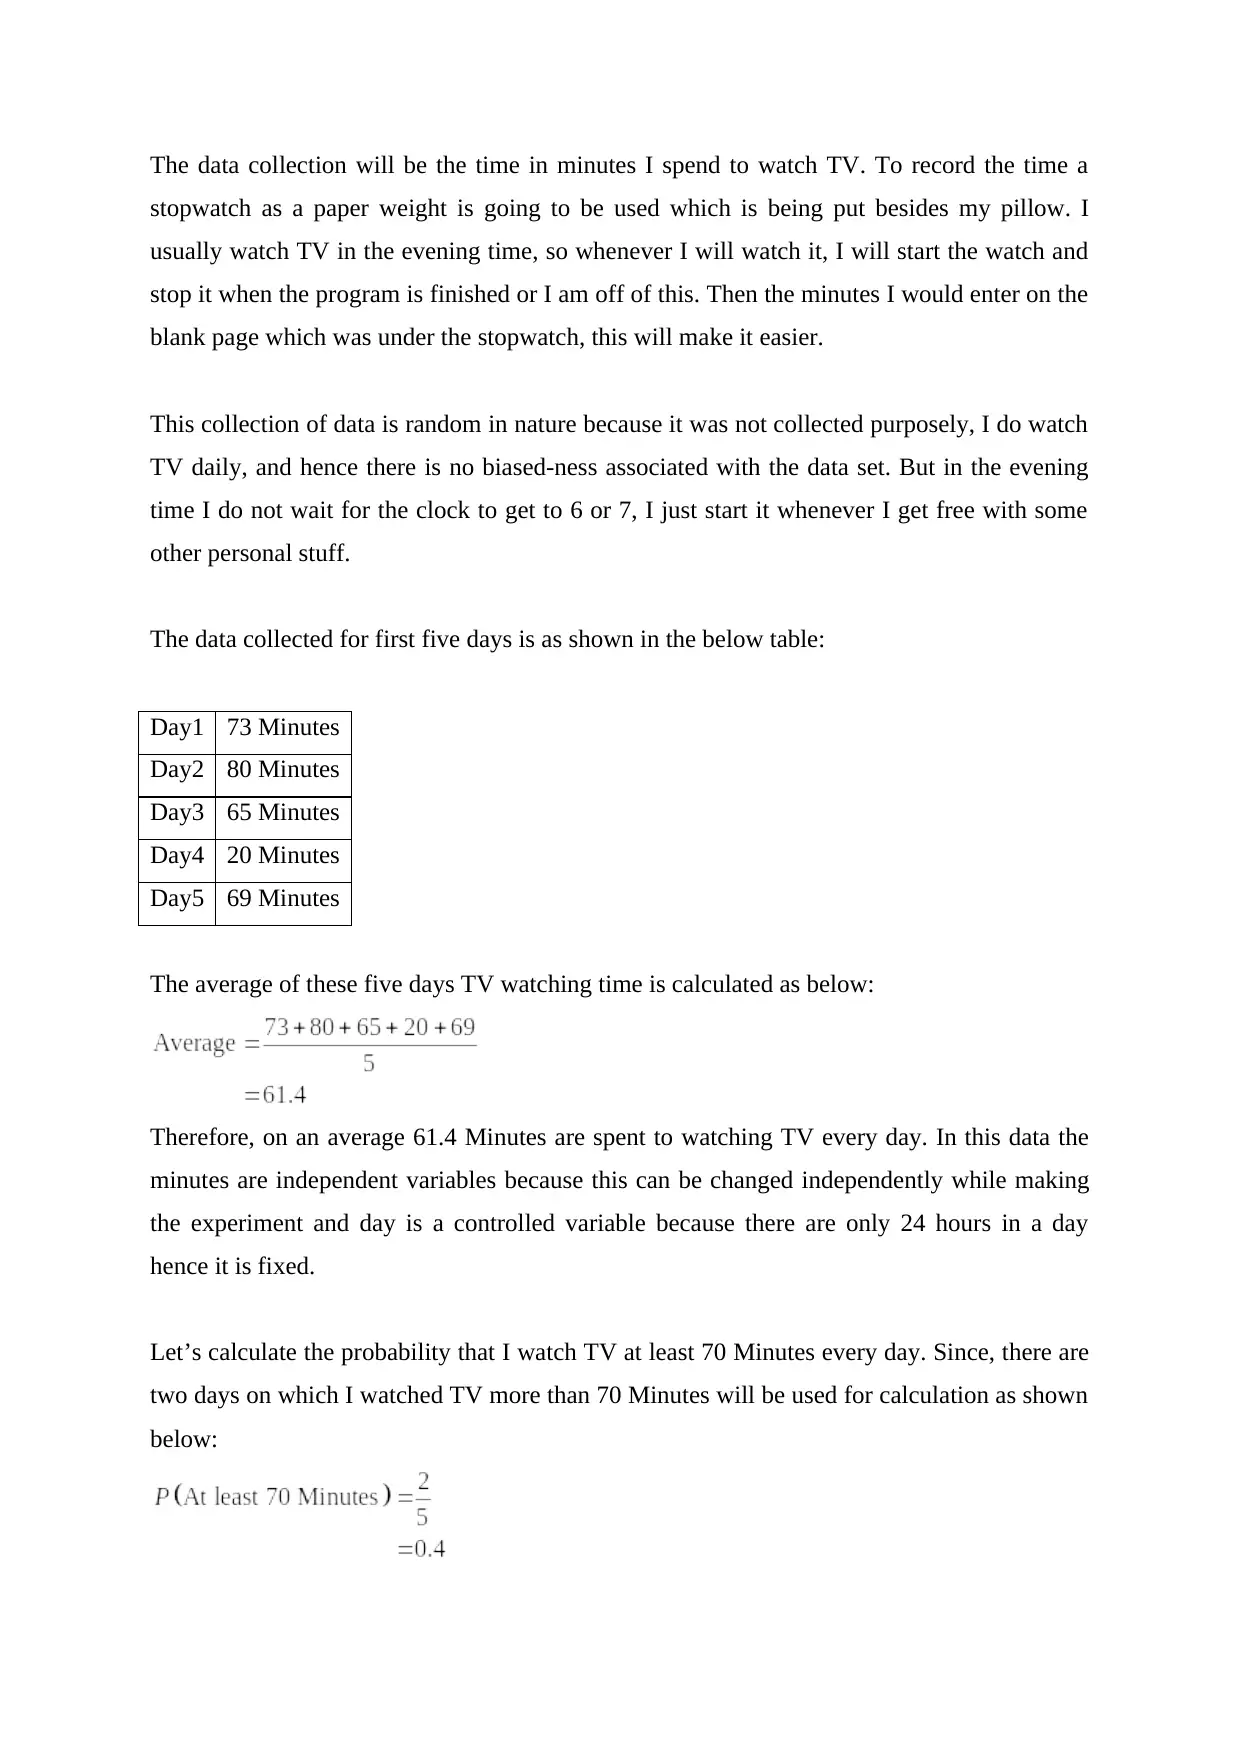
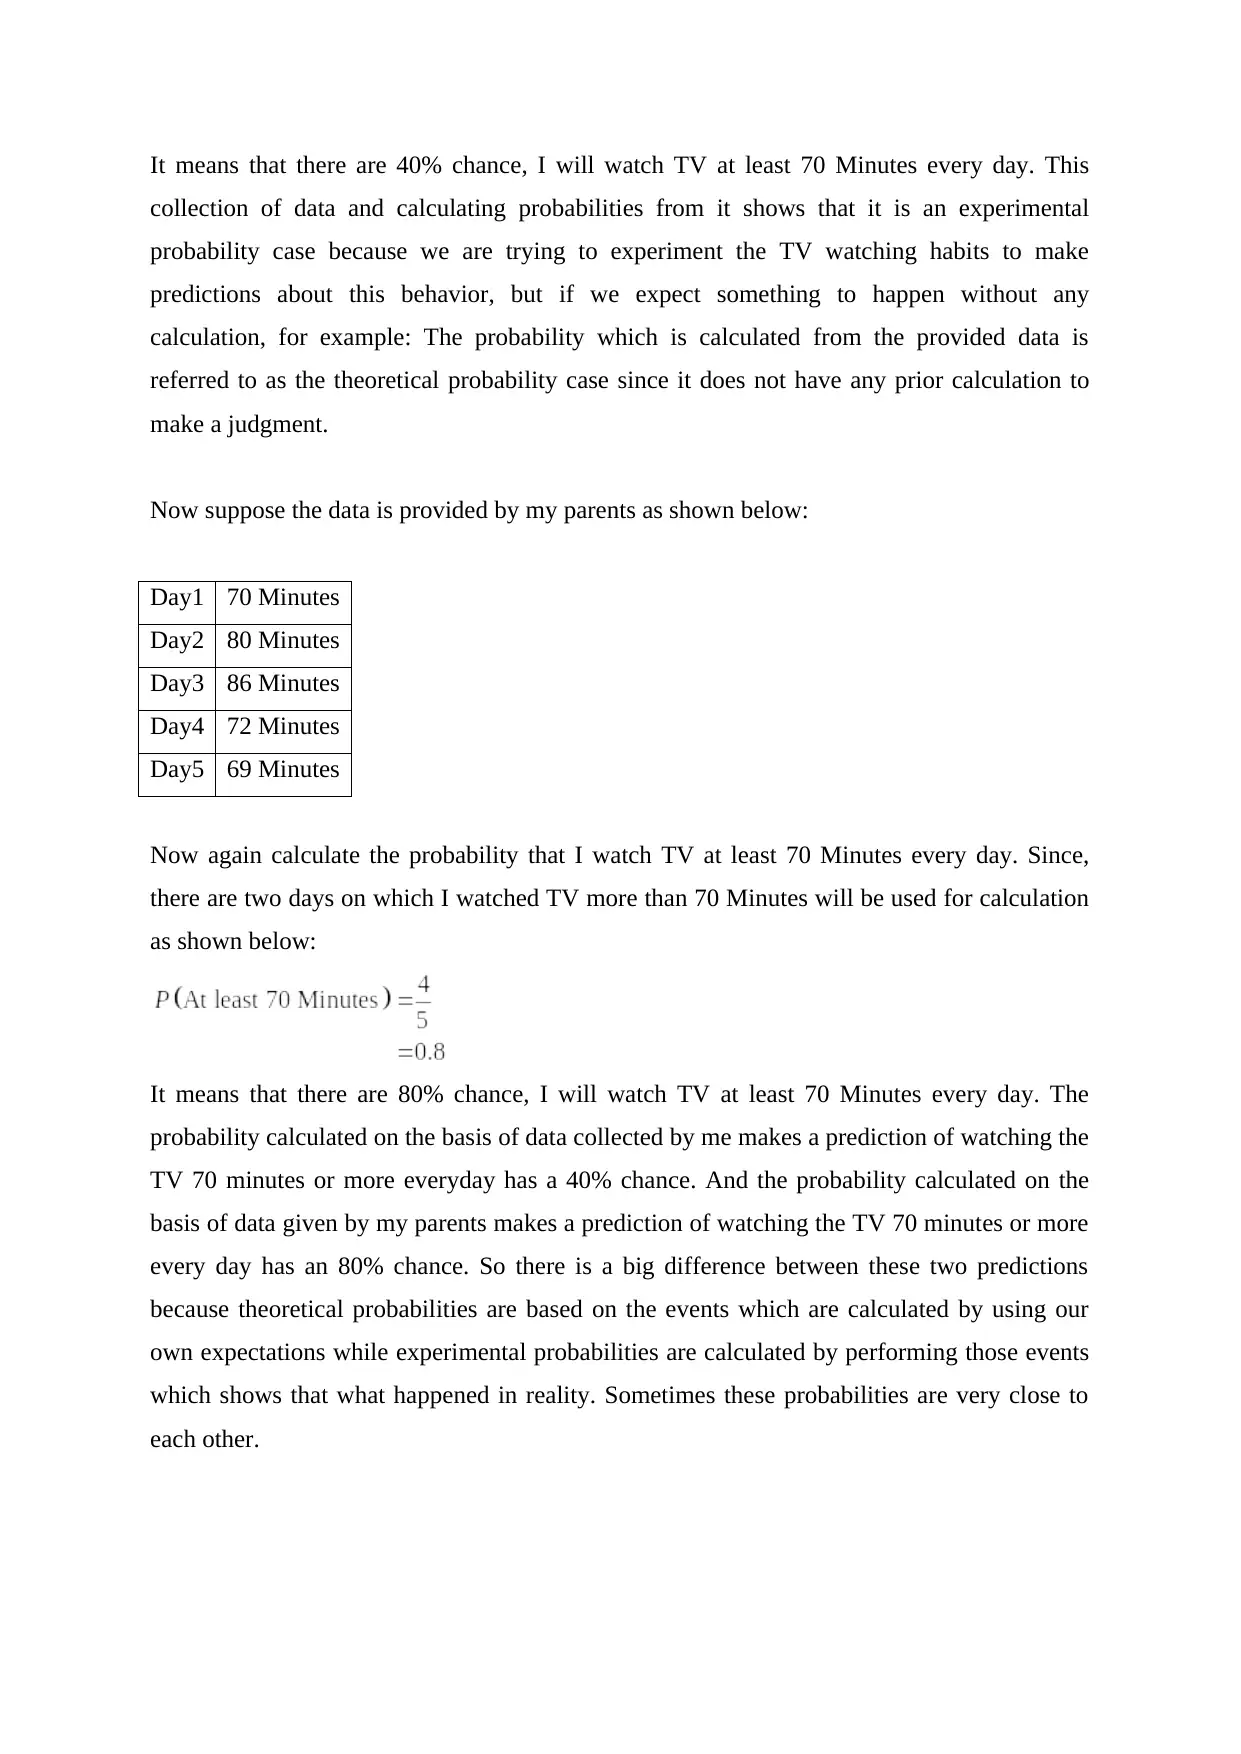
This assignment presents a statistical analysis of a student's TV watching habits. The student collected data on the time spent watching TV over five days, calculating the average time and determining the probability of watching TV for at least 70 minutes daily. The assignment contrasts experimental and theoretical probability, using both the student's data and hypothetical data from their parents to illustrate the differences in predicted outcomes. It also discusses the concept of outliers within the dataset, identifying a day with significantly less TV viewing time as a potential outlier and exploring scenarios that could skew the data. The analysis emphasizes the validity of the data despite potential influencing factors and includes references to statistical resources.
Document Page
The data collection will be the time in minutes I spend to watch TV. To record the time a
stopwatch as a paper weight is going to be used which is being put besides my pillow. I
usually watch TV in the evening time, so whenever I will watch it, I will start the watch and
stop it when the program is finished or I am off of this. Then the minutes I would enter on the
blank page which was under the stopwatch, this will make it easier.
This collection of data is random in nature because it was not collected purposely, I do watch
TV daily, and hence there is no biased-ness associated with the data set. But in the evening
time I do not wait for the clock to get to 6 or 7, I just start it whenever I get free with some
other personal stuff.
The data collected for first five days is as shown in the below table:
Day1 73 Minutes
Day2 80 Minutes
Day3 65 Minutes
Day4 20 Minutes
Day5 69 Minutes
The average of these five days TV watching time is calculated as below:
Therefore, on an average 61.4 Minutes are spent to watching TV every day. In this data the
minutes are independent variables because this can be changed independently while making
the experiment and day is a controlled variable because there are only 24 hours in a day
hence it is fixed.
Let’s calculate the probability that I watch TV at least 70 Minutes every day. Since, there are
two days on which I watched TV more than 70 Minutes will be used for calculation as shown
below:
tabler-icon-diamond-filled.svg

Paraphrase This Document

Need a fresh take? Get an instant paraphrase of this document with our AI Paraphraser
Document Page
It means that there are 40% chance, I will watch TV at least 70 Minutes every day. This
collection of data and calculating probabilities from it shows that it is an experimental
probability case because we are trying to experiment the TV watching habits to make
predictions about this behavior, but if we expect something to happen without any
calculation, for example: The probability which is calculated from the provided data is
referred to as the theoretical probability case since it does not have any prior calculation to
make a judgment.
Now suppose the data is provided by my parents as shown below:
Day1 70 Minutes
Day2 80 Minutes
Day3 86 Minutes
Day4 72 Minutes
Day5 69 Minutes
Now again calculate the probability that I watch TV at least 70 Minutes every day. Since,
there are two days on which I watched TV more than 70 Minutes will be used for calculation
as shown below:
It means that there are 80% chance, I will watch TV at least 70 Minutes every day. The
probability calculated on the basis of data collected by me makes a prediction of watching the
TV 70 minutes or more everyday has a 40% chance. And the probability calculated on the
basis of data given by my parents makes a prediction of watching the TV 70 minutes or more
every day has an 80% chance. So there is a big difference between these two predictions
because theoretical probabilities are based on the events which are calculated by using our
own expectations while experimental probabilities are calculated by performing those events
which shows that what happened in reality. Sometimes these probabilities are very close to
each other.
Document Page
The data collected by me for five days have one day with 20 minutes that is an outlier and it
happened because a guest came to my home in the evening, so I couldn’t get time to watch
TV. This even made the data skewed.
There might be some other scenarios as well, which can skew this data like I went for a party
on a particular day, I could have travelled to somewhere, some natural disaster happened,
problem with TV functionality, etc.
Since, there is no biased-ness in the data, therefore it provides a valid representation of time
consumed in watching TV every day.
Document Page
References
Bluman, Allan. G.(2009), Elementary Statistics. New York, NY: McGraw-Hill
Mann, Prem S.(2012), Introductory Statistics. New Jersey, NJ: John Wiley & Sons, Inc.
Rumsey, Deborah(2010), Statistics Essentials for Dummies. New Jersey, NJ: John Wiley & Sons, Inc.
chevron_up_icon
1 out of 4
circle_padding
hide_on_mobile
zoom_out_icon
[object Object]