Knowledge Engineering Report: Analyzing Twitter Data with RapidMiner

Verified

Added on  2023/03/17

|20
|3897
|53
Report
AI Summary
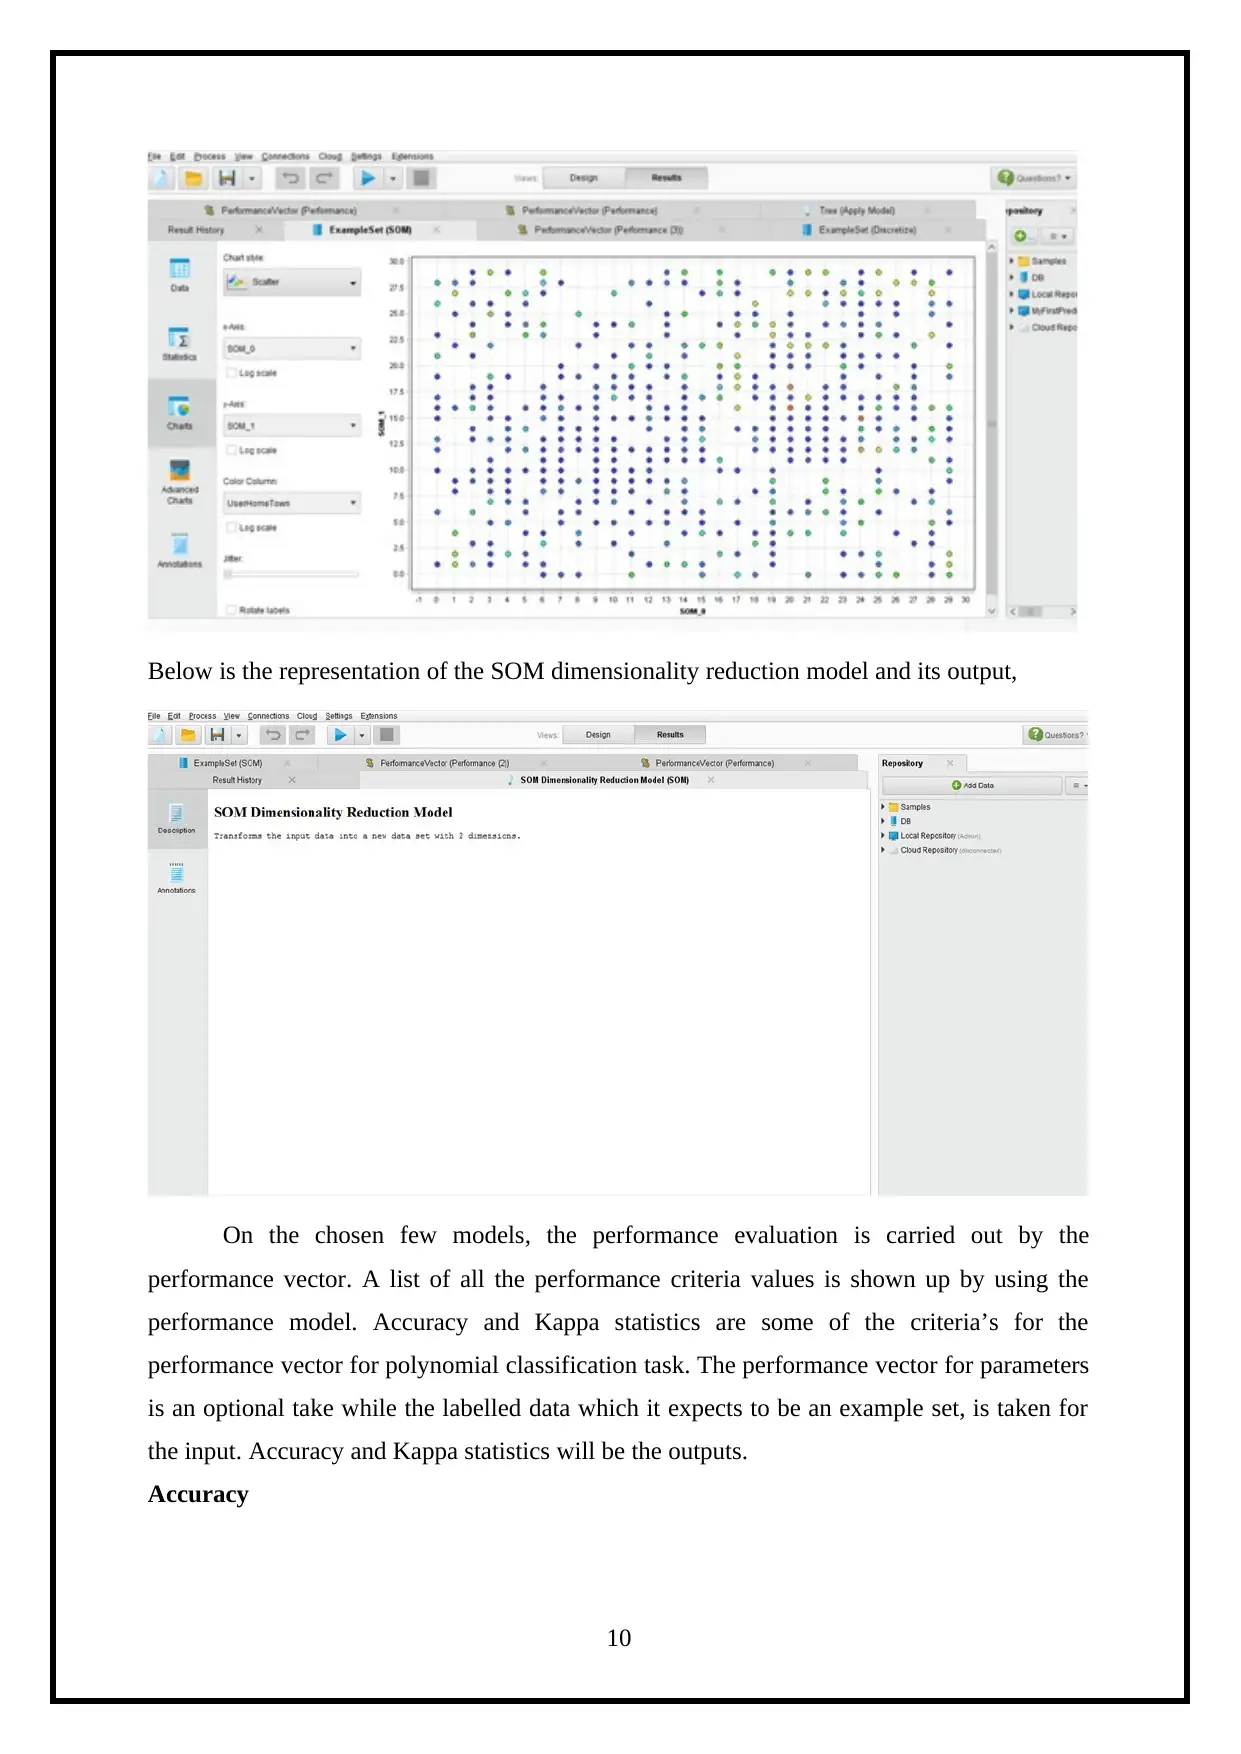
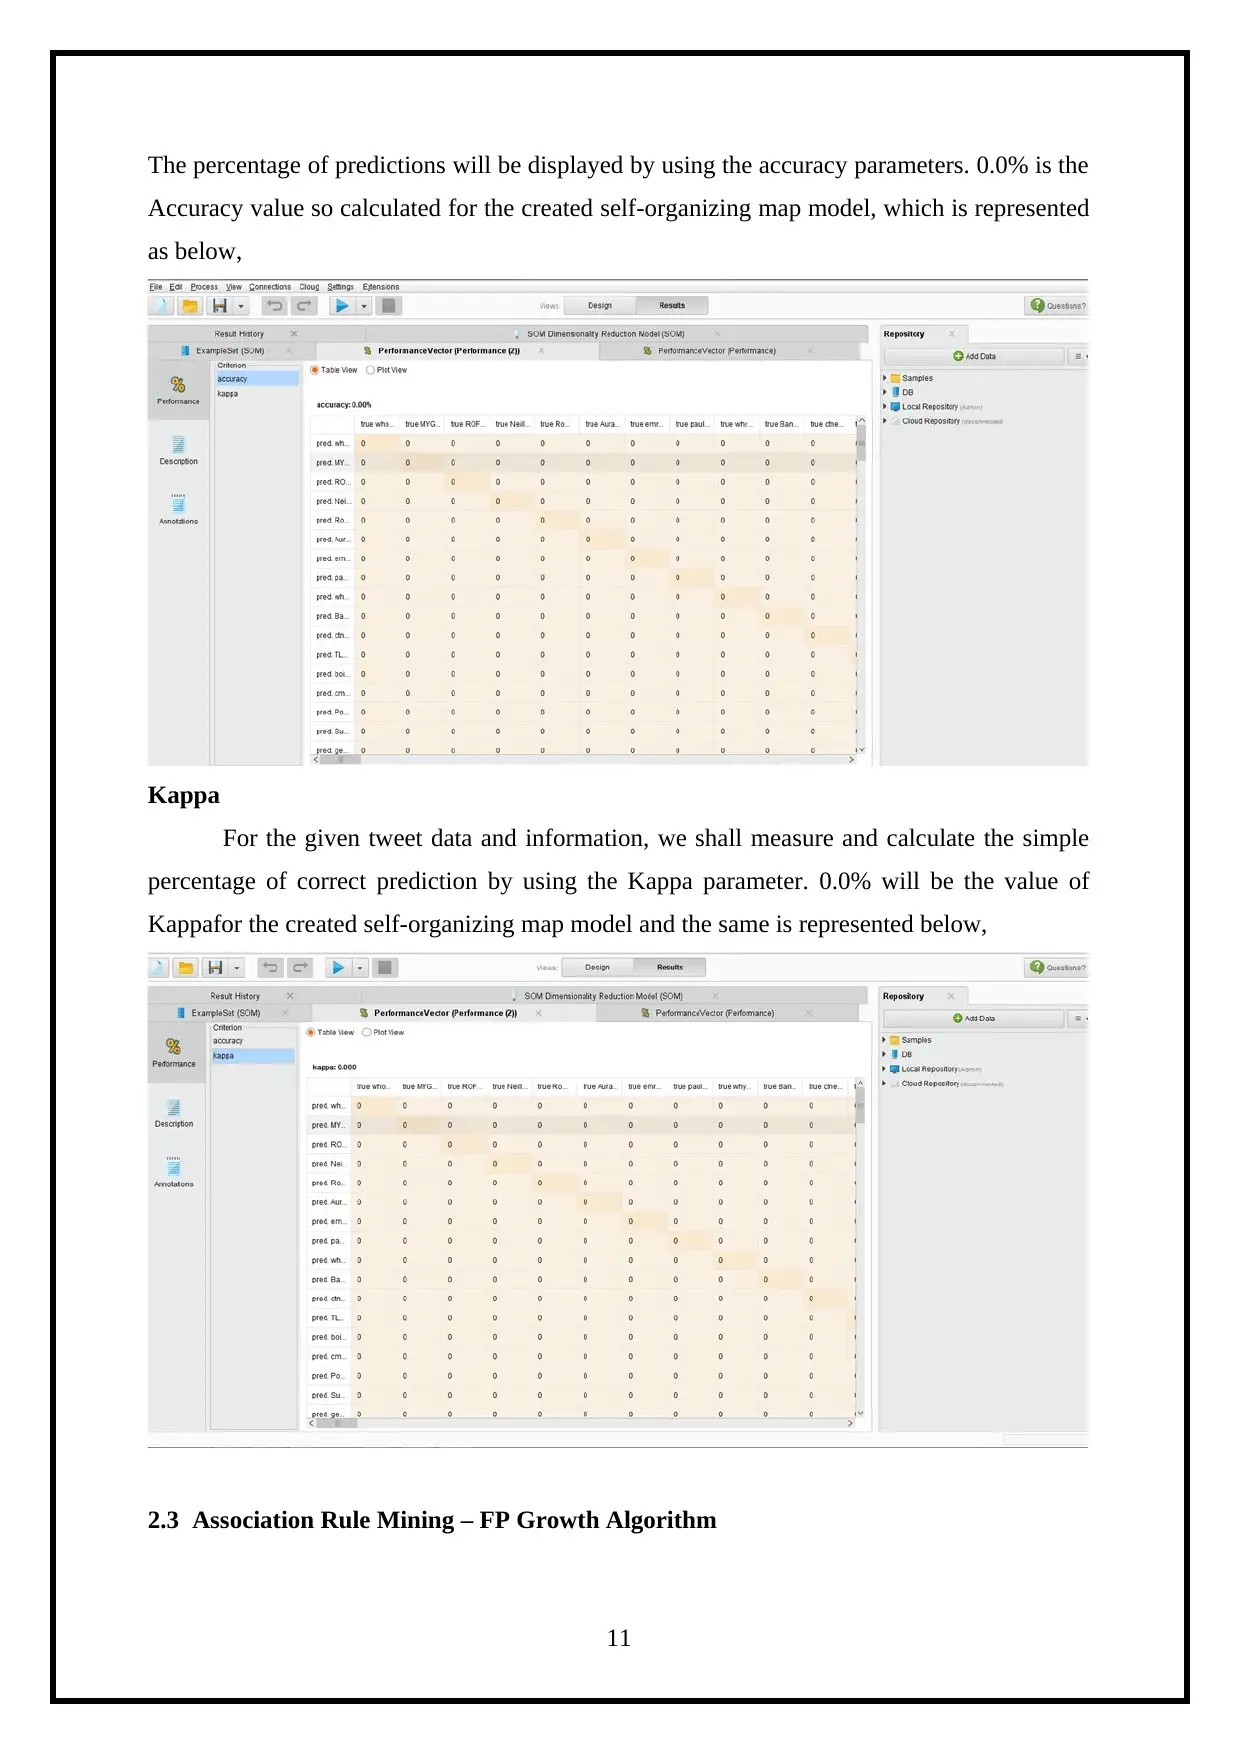
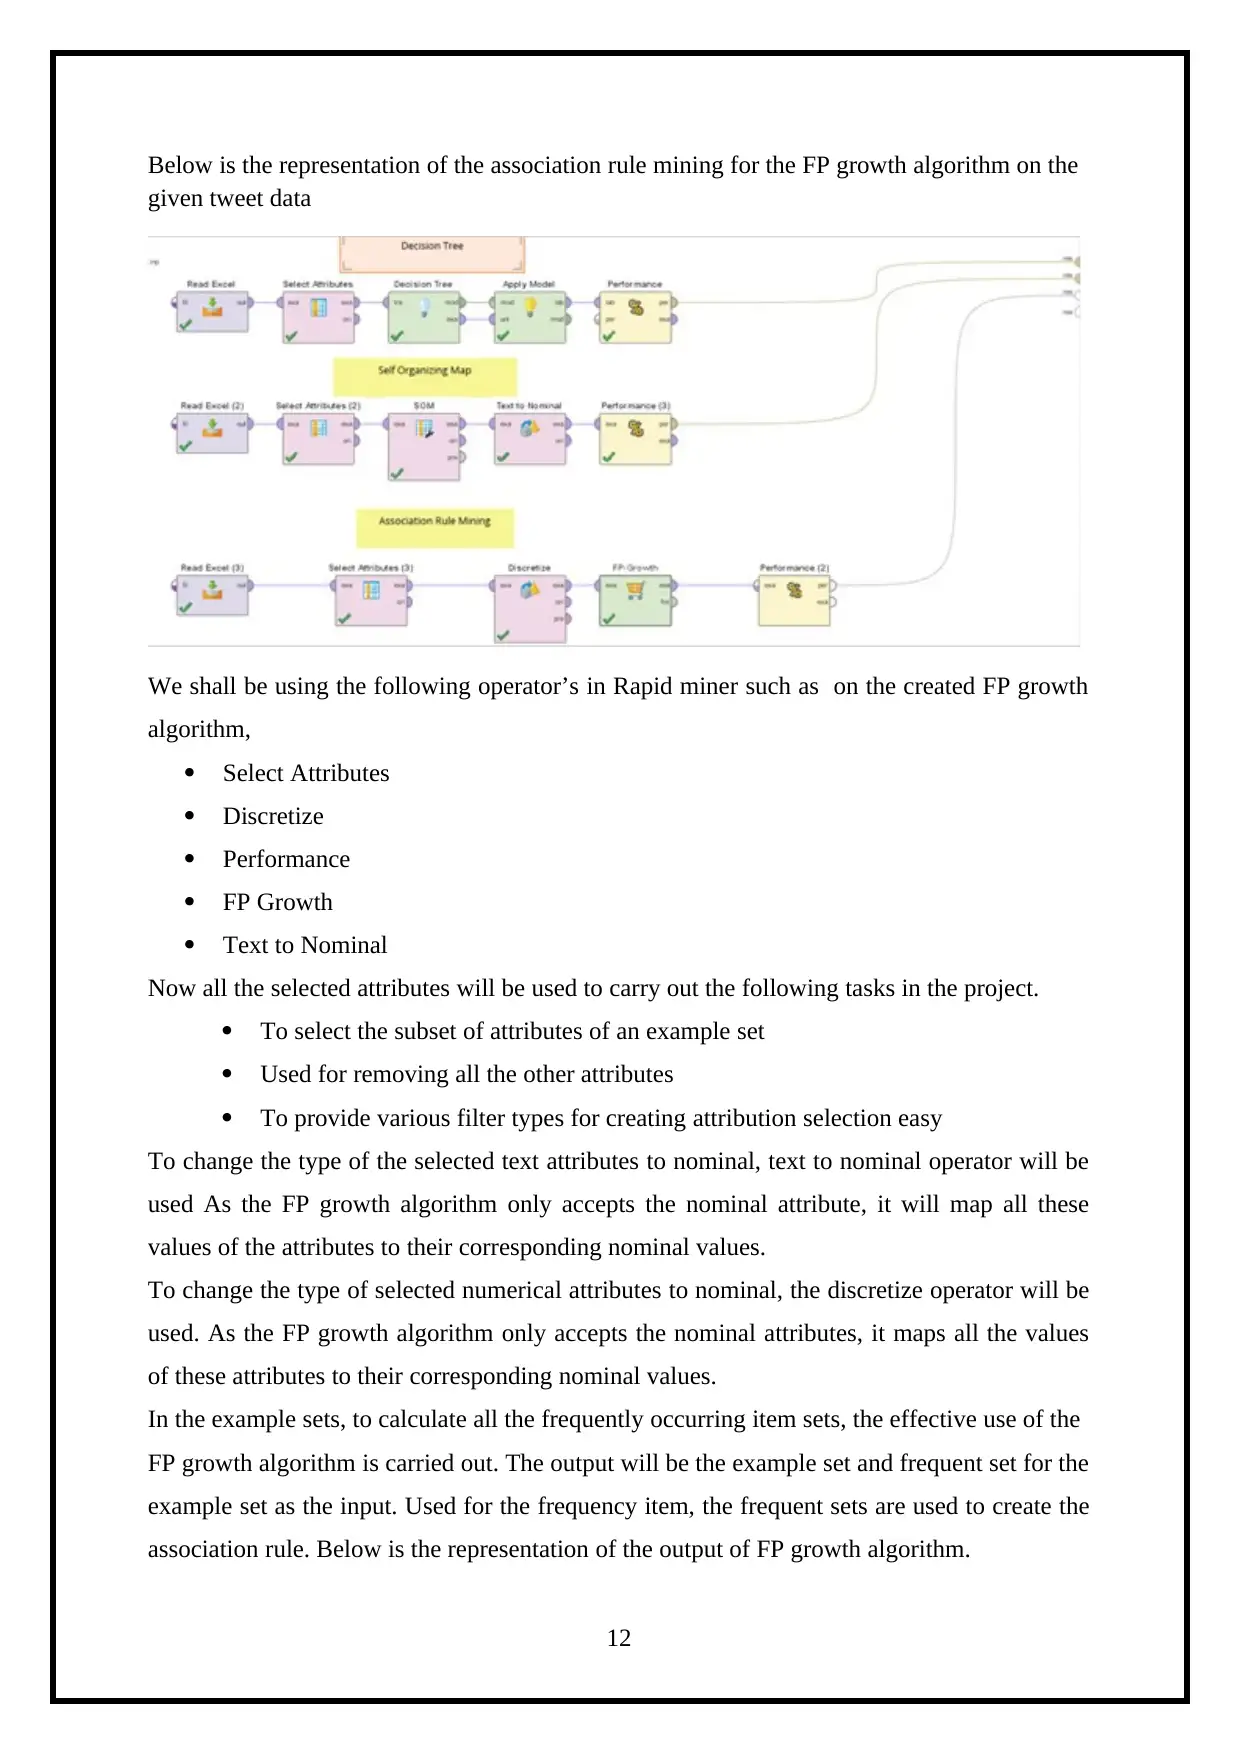
This report details a knowledge engineering assignment focused on analyzing Twitter data using the RapidMiner tool. The project aims to understand user online activity through their tweets. The report begins with an introduction to the context of social media and Twitter's role as a dynamic data source. It then outlines the business case, describing the tweet data attributes. The core of the report covers knowledge creation techniques, including classification using Decision Trees, clustering with Self-Organizing Maps (SOM), and association rule mining employing the FP Growth algorithm. Each technique is explained with relevant RapidMiner operators and visual representations of the results, such as accuracy and Kappa statistics. The report also discusses external source knowledge creations and concludes with an overview of the findings and references. The assignment showcases the application of data mining and machine learning techniques to extract meaningful insights from social media data. The report includes all the details of the assignment brief.
Document Page
University
Semester
KNOWLEDGE ENGINEERING –
RAPID MINOR
Student ID
Student Name
Submission Date
1
tabler-icon-diamond-filled.svg

Paraphrase This Document

Need a fresh take? Get an instant paraphrase of this document with our AI Paraphraser
Document Page
Table of Contents
Introduction................................................................................................................................4
Part A - Business Case...............................................................................................................4
1. Tweet Data Description...................................................................................................4
2. Knowledge Creation Techniques....................................................................................5
2.1 Classification – Decision Tree.................................................................................5
2.2 Clustering – SOM (Self Organizing Map)...............................................................7
2.3 Association Rule Mining – FP Growth Algorithm................................................11
3. External Source Knowledge Creations.........................................................................16
Part – B Knowledge Creations.................................................................................................18
Conclusion................................................................................................................................19
References................................................................................................................................20
2
Document Page
3
Document Page
Introduction
In today’s world of Internet and social media awareness, people feel a sense of
connected to the world and their loved ones by being on social platforms like Facebook,
Twitter, Instagram, WhatsApp etc. By using the Rapid Miner tool, we shall evaluate the
activity of users online on the basis of their tweet data. That will be the intention of this whole
project. As Twitter, Flicker, and Facebook and other social media platforms cover more and
more applications, tools and websites, people have started using these platforms to share their
feelings, experiences, gather information, news and convey their opinions with their family,
friends and peers. We shall focus on of the most popular social media platforms and
information acquiring media used in today’s world, Twitter. It is an online news, information,
and social networking platform. The account holders and the users post “tweets” which is
interactive and can also attach photos, links, services etc. It saves all the activities of the user
as and what he/she posts (tweets) on the platform and it is a real-time social media service. A
“Dynamic Data Streaming” system is what Twitter has become with the daily updates from
all its users and the posts that they keep on “tweeting”.
To understand and procure the in-depth knowledge of the activity of online users who
tweet and regularly use Twitter, a Knowledge Engineer will make use of the creation
technique and the knowledge representation to analyse all these data and information. On the
online pages, Twitter API etc, all these different data sets and the information packets are
available. So our focus for this project will be to acquire an in-depth knowledge and
information of the user’s online activities by using the user’s tweets, Twitter data and
evaluating the same (Challenges with Big Data Analytics, 2015).
Part A - Business Case
1. Tweet Data Description
The Twitter websites and servers collect all the tweet data, information from a user by
his /her tweets. This same data will be used in this project. To understand and acquire in-
depth knowledge of the user’s online activity, we shall evaluate this data that is generated by
the user’s tweets. The below given attributes are part of this data,
ID
4
tabler-icon-diamond-filled.svg

Paraphrase This Document

Need a fresh take? Get an instant paraphrase of this document with our AI Paraphraser
Document Page
Time
Content
UserId
UserHomeTown
Location
2. Knowledge Creation Techniques
We shall now use the knowledge creation techniques and methods to evaluate and study
the user’s tweet data (C and Babu, 2016). Now the three “knowledge creation techniques”
used for this process are,
1. Classification as decision tree
2. Clustering as Self Organizing Map (SOM)
3. Association rule mining as FP growth by using the Rapid Miner tool.
We shall now discuss and study each of these in detail.
2.1 Classification – Decision Tree
Below is the image for the “Decision Tree” for the tweet data,
We shall now use the following operator in Rapid Miner given below, after we have created
the “Decision Tree”,
a) Select Attributes
b) Decision Tree
c) Performance
Using an example for selecting the subset of attributes, the selected attributes will be used
and same time they will also be used for removal of the other attributes. To make the process
of attribution selection easy, the operator will make the use of the various filter types. For the
classification and regression use, the above decision tree will be used (Comparative Study of
K-NN, Naive Bayes and Decision Tree Classification Techniques, 2016). Now to create an
5
Document Page
estimate of a numerical target value or for making the decision on the value affiliation to a
class, the tree like set of node will be utilized. To separate and for regression of the different
type of classes, the classification rules are generated for these values. Now these are linked
and they shall minimize the error in an optimal way for these chosen parameter criteria’s.
To find the value and the dependence on the common examples which it will reach for the
leaf during its generation, the decision tree model shall be made use to predict this class label
attributes. These shall also be used for averaging all the values of a leaf and then get the
numerical value. To generate the Decision Tree model, the input is taken from the training set
as selected and a Decision tree and example set will be the outcome of this. Form this output
port the decision tree model output will be used for delivering. There will be no changing of
the output through the port and same time the example set will be used for taking the input.
On the few selected models, the performance evaluation will be carried out by using
the performance vector and a list of the performance criteria values will be delivered by
utilising the performance model. In order to firthe learnig type, the order automatically will
be determined and also at the same time it will calculate the most common criteria for that
particulr category. The criterias like Accuracy and Kappa statistics, will be used for the
performance vector for polynominal classification task. The parameters for this will
optionally taken from theperformance vector and the labelled data will act as the inputs and
the expected example set. Accuracy and Kappa statistics will be the resultant outcome for
this. The models will be using the Accuracy and Kappa parameters for the finding out the
performance vector whch will be used to predict the output values.
Accuracy
To display the percentage of predictions, the accuracy parameters will be used. The
below image shows the accuracy value so created for the decision model,which is 0.0%.
6
Document Page
Kappa
For the given tweet data, to measure the simple percentage of the correct prediction
we shall be using the “Kappa” parameter. 0.0 is the value of the Kappa for the created
decision model and same is displayed below.
2.2 Clustering – SOM (Self Organizing Map)
Below is the image of the tweet data’s self-organizing map,
7
tabler-icon-diamond-filled.svg

Paraphrase This Document

Need a fresh take? Get an instant paraphrase of this document with our AI Paraphraser
Document Page
Following are the operators, based on the self-organizing map and used in the Rapid miner,
Select Attributes
Self Organizing Map
Performance
The subset of attributes which is used for an example set is created by the selected
attributes. This will also provide different filter types and for removal of all the other
attributes for easing out the selection process of the attribution (Repin et al., 2019).
By identifying and specifying the required number of dimensions, the self-organizing map
will be used for performing the dimensionality minimisation of the provided tweet data.
For the trained data to make a low dimensional and discretized representation of the input
space, one of the types of artificial neural network will be used on the provided data set. This
is known as a “map”. Also popularly called as Kohonen map, it provides useful visualizing of
the low dimensional views of high dimensional data. Mapping and Training are the two
models and the types of operation for the SOM. The main difference between these two
models is that the “Mapping model” will automatically classify the new input vector while
the “Training model” will be used for building the input examples. The “nodes” which are the
components of the SOM use the example set as the input and the output is provided as an
example set and the pre-processing model. Below is the image representation of the “Self-
organizing” map,
8
Document Page
Below is the representation of the output for the self-organizing map and its statistical
information,
Below is the statistics information which represents the chart visualization output for self-
organizing map,
9
Document Page
Below is the representation of the SOM dimensionality reduction model and its output,
On the chosen few models, the performance evaluation is carried out by the
performance vector. A list of all the performance criteria values is shown up by using the
performance model. Accuracy and Kappa statistics are some of the criteria’s for the
performance vector for polynomial classification task. The performance vector for parameters
is an optional take while the labelled data which it expects to be an example set, is taken for
the input. Accuracy and Kappa statistics will be the outputs.
Accuracy
10
tabler-icon-diamond-filled.svg

Paraphrase This Document

Need a fresh take? Get an instant paraphrase of this document with our AI Paraphraser
Document Page
The percentage of predictions will be displayed by using the accuracy parameters. 0.0% is the
Accuracy value so calculated for the created self-organizing map model, which is represented
as below,
Kappa
For the given tweet data and information, we shall measure and calculate the simple
percentage of correct prediction by using the Kappa parameter. 0.0% will be the value of
Kappafor the created self-organizing map model and the same is represented below,
2.3 Association Rule Mining – FP Growth Algorithm
11
Document Page
Below is the representation of the association rule mining for the FP growth algorithm on the
given tweet data
We shall be using the following operator’s in Rapid miner such as on the created FP growth
algorithm,
Select Attributes
Discretize
Performance
FP Growth
Text to Nominal
Now all the selected attributes will be used to carry out the following tasks in the project.
To select the subset of attributes of an example set
Used for removing all the other attributes
To provide various filter types for creating attribution selection easy
To change the type of the selected text attributes to nominal, text to nominal operator will be
used As the FP growth algorithm only accepts the nominal attribute, it will map all these
values of the attributes to their corresponding nominal values.
To change the type of selected numerical attributes to nominal, the discretize operator will be
used. As the FP growth algorithm only accepts the nominal attributes, it maps all the values
of these attributes to their corresponding nominal values.
In the example sets, to calculate all the frequently occurring item sets, the effective use of the
FP growth algorithm is carried out. The output will be the example set and frequent set for the
example set as the input. Used for the frequency item, the frequent sets are used to create the
association rule. Below is the representation of the output of FP growth algorithm.
12
chevron_up_icon
1 out of 20
circle_padding
hide_on_mobile
zoom_out_icon
[object Object]