Analysis of Tyre Lifespans Using Statistical Methods
VerifiedAdded on 2020/04/15
|6
|939
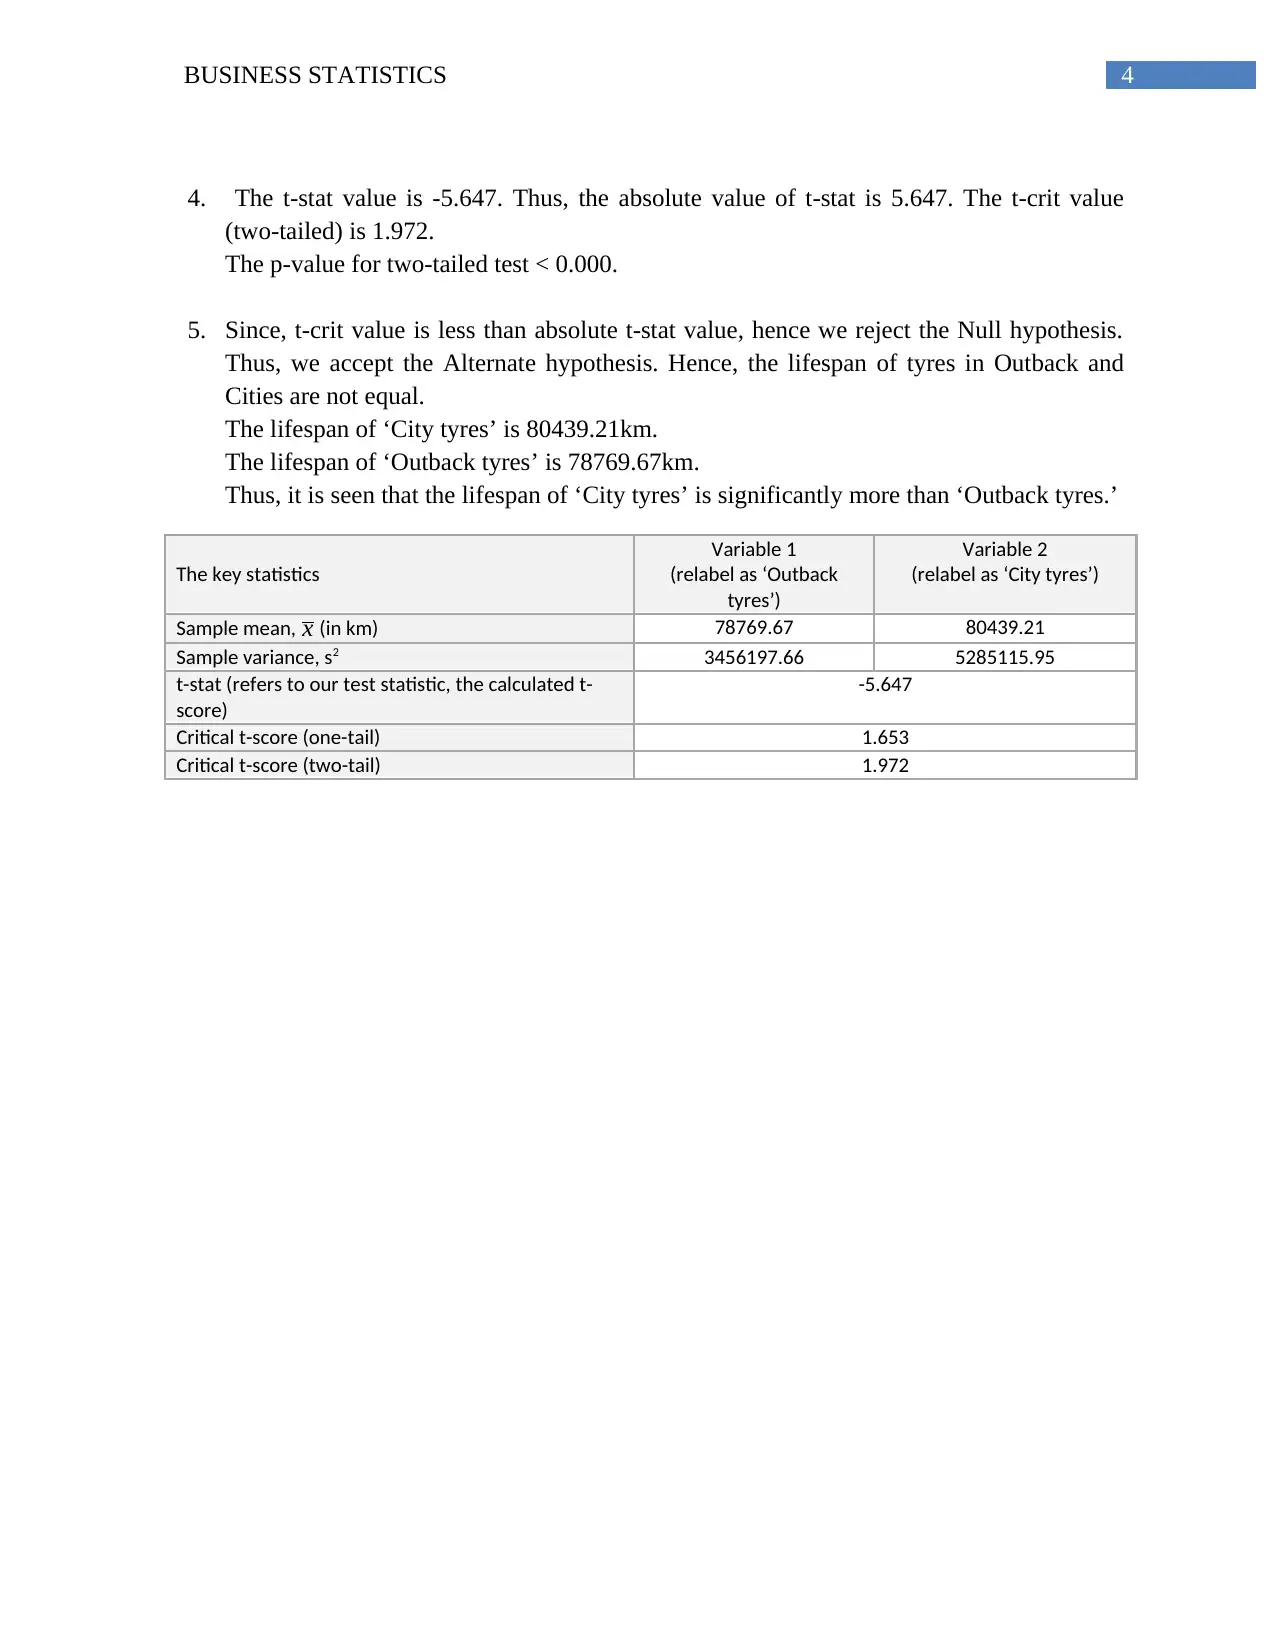
|337
AI Summary
This report provides a detailed examination of the lifespan of tyres manufactured by two companies: Wheels That Fly! Co. and Loops of Latex Co., using business statistics methods. The analysis involves hypothesis testing to determine if the average lifespan of tyres meets company expectations, comparing tyre lifespans in different environments, and calculating confidence intervals for more precise estimations. Statistical tests such as z-tests (for sample sizes greater than 30) and independent t-tests are employed to test hypotheses about mean differences with significance levels set at 0.05. The results offer insights into the actual lifespan of tyres compared to hypothesized values and investigate potential variations between different usage environments. Additionally, confidence intervals are calculated to provide a range within which the true mean lifespan is expected to lie with 95% certainty.
1 out of 6
Related Documents


Your All-in-One AI-Powered Toolkit for Academic Success.
+13062052269
info@desklib.com
Available 24*7 on WhatsApp / Email
![[object Object]](/_next/static/media/star-bottom.7253800d.svg)
Copyright © 2020–2026 A2Z Services. All Rights Reserved. Developed and managed by ZUCOL.