Financial Management Project Report: UAE Market Financial Analysis
VerifiedAdded on 2020/04/13
|17
|4371
|35
Project
AI Summary
This project report provides a detailed financial analysis of the UAE market, comparing the financial performance of National Takaful, a UAE-based company, with Marshall Motor Holdings plc, an international company. The report examines various aspects of financial management, including capital budgeting, capital structure, stock and bond decisions, and cost of capital. The analysis utilizes ratio analysis to evaluate liquidity, profitability, financial structure, and efficiency. The study reveals insights into the companies' capital structures, cost of capital, and corporate governance practices. The report concludes with a comparison of the Abu Dhabi and international markets, highlighting the need for improved financial strategies in the UAE market to enhance financial strength and market position. The report also includes financial statements and relevant data in the appendix.
Running Head: Financial Management
1
Project Report: Financial Management
1
Project Report: Financial Management
Paraphrase This Document
Need a fresh take? Get an instant paraphrase of this document with our AI Paraphraser
Financial Management
2
Contents
Introduction.......................................................................................................................3
National Takaful...............................................................................................................3
Marshall Motor holdings plc............................................................................................3
Capital budgeting..............................................................................................................3
Financial analysis and forecasting....................................................................................3
Stocks and bonds decision................................................................................................4
Capital structure................................................................................................................4
Cost of capital...................................................................................................................5
Corporate governance and agency problem decision.......................................................6
Conclusion........................................................................................................................6
References.........................................................................................................................7
Appendix...........................................................................................................................8
Financial Management
3
Introduction:
This report has been prepared to analyze the financial management of the UAE
market. For analyzing the financial performance of the UAE market, an international
company as well as a UAE company has been analyzed and the performance of the UAE
market has been analyzed through comparing both the companies. This report would focus
over various financial analyses such as capital budgeting, capital structure, stock and bond
decision and cost of capital.
National Takaful:
National Takaful is an UAE company which is operating its business into ABU
DHABI. This company is operating its business through 6 branches in ABU DHABI market;
the main business of this company is to offer the health insurance to its clients. This company
came into existence in 2011 and currently it is only providing its services into domestic
market (Home, 2017).
Marshall Motor holdings plc:
Marshall Motor Holdings plc is an England company which is operating its business
into international market. This company has registered its stock into London stock exchange;
the main business of this company is to offer new automobile products and services. This
company came into existence in 20th century and currently it has diversified its market into
25 countries to enhance the market share of the company (London Stock exchange, 2017).
Capital budgeting:
Capital budgeting is a process which is used by the companies to analyze various
investment opportunities on the basis of the company’s requirement. Capital budgeting
techniques of both the companies would be affected through various variables which are
NPV rate, inflows and size of the investment opportunity (Gurufocus, 2017). NPV rate of
both the companies could not be similar; the size of investment would be higher in case of
Marshall.
Financial analysis and forecasting:
Further, financial analysis and forecasting over both the companies have been done to
identify the financial strength and position. For this study, ratio analysis has been done over
⊘ This is a preview!⊘
Do you want full access?
Subscribe today to unlock all pages.
Trusted by 1+ million students worldwide
Financial Management
4
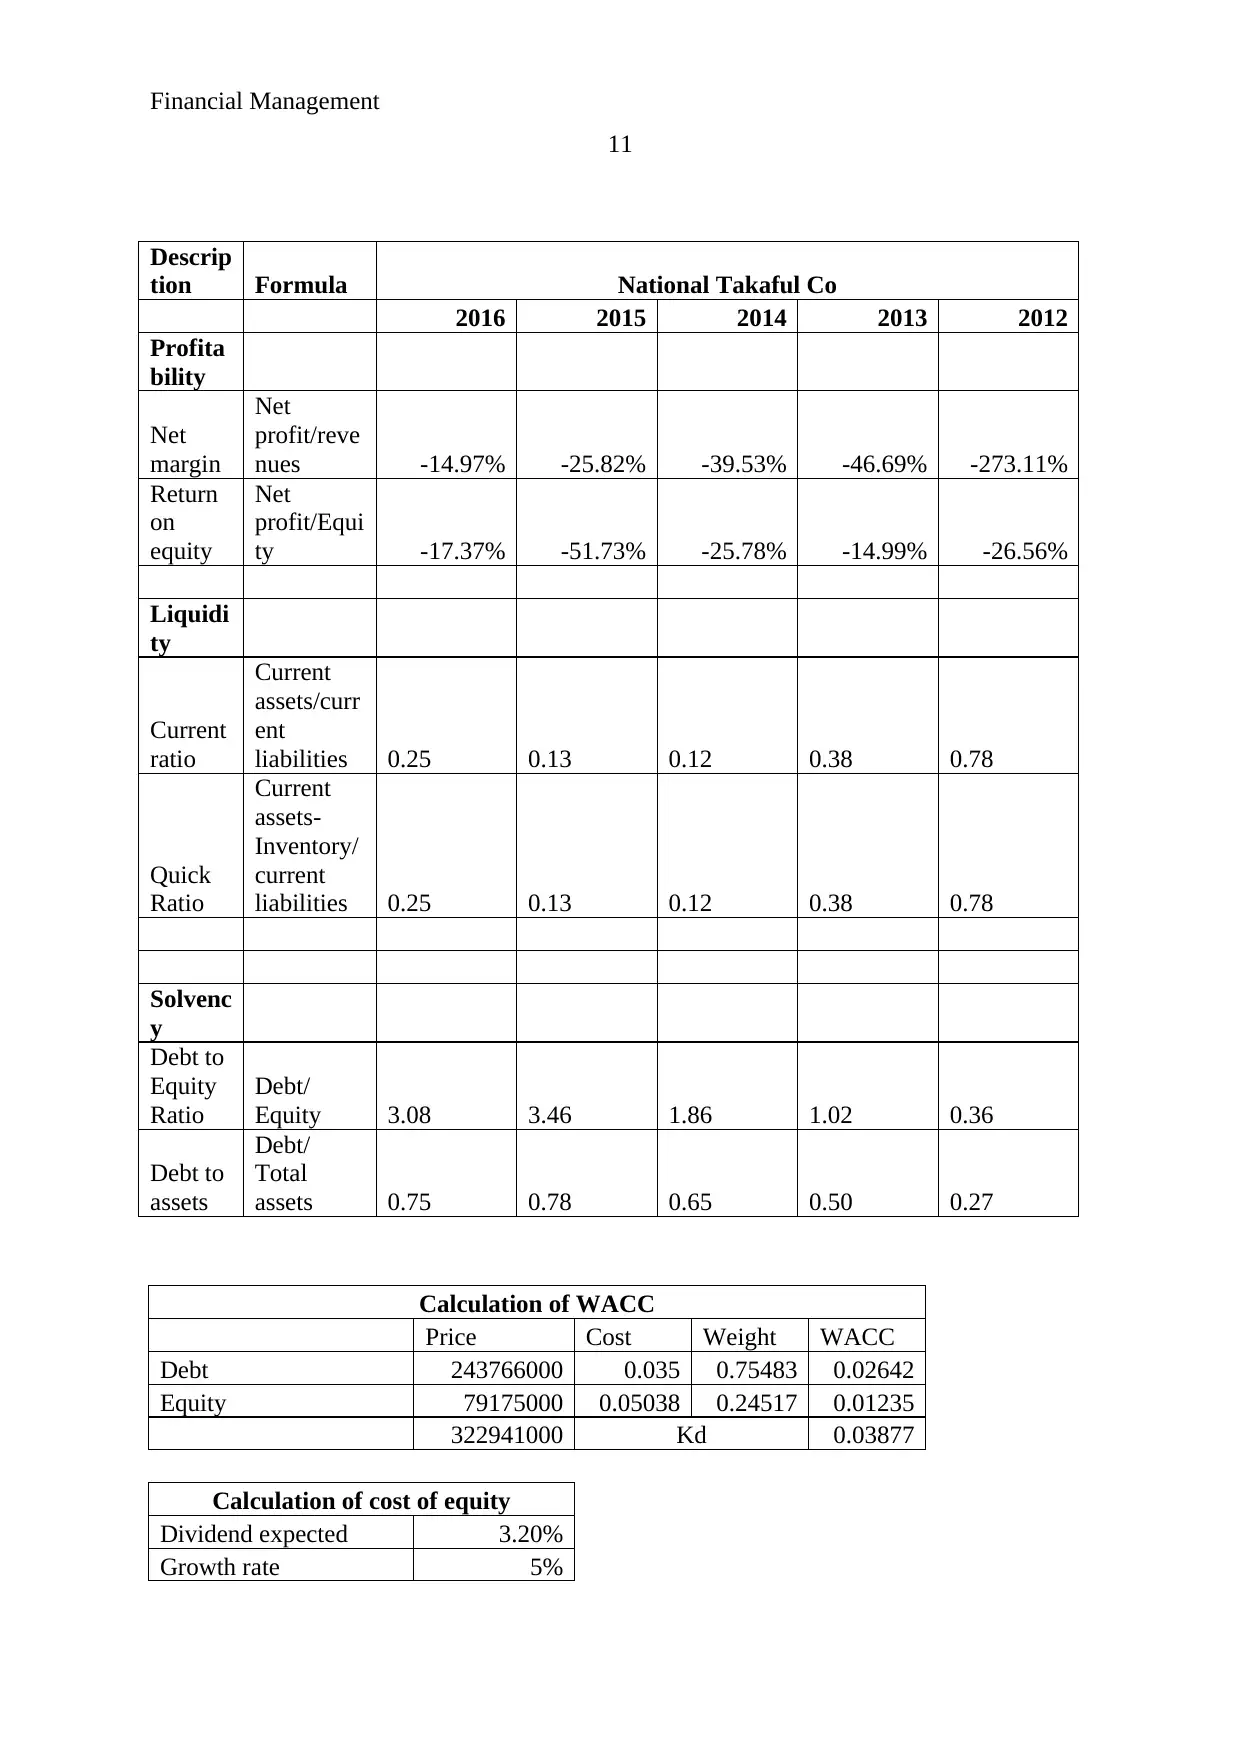
both the companies to evaluate the liquidity position, profitability position, financial structure
position and efficiency position. Through the 5 year analysis over both the companies, it has
been found that the profitability position of Marshall is much stronger than the NATIONAL
TAKAFUFL PLC (Morningstar, 2017). Through the further analysis, it has been found that
the NATIONAL TAKAFUL is required to manage the liquid position in the industry as well
as in the market. The liquid position of the company depict that company is not even able to
pay half of the current debts.
More, it has been investigated that the efficiency position of the company is nil which
depict that the company do not use the receivable and payable policies to manage the cash.
But it is required for every organization to manage the level so that the sales of the company
could be enhanced (Morningstar, 2017). More, the debt structure of the comapny depict that
the debt equity and debt asset structure of NATIONAL TAKAFUL is quite competitive.
Company has managed the debt and equity in such a manner that return and risk both the
factors of the company could be controlled.
Stocks and bonds decision:
More, the study has been done over the bond and stock decision of the company.
Through this analysis, it has been found that both the companies had not issued any bonds to
raise the funds. Still, the risk free rate off both the companies is quite different to each other.
The risk free rate of London stock exchange is 2.77% whereas the risk free arte of ABU
DHABI is 3%. This depict that the risk free rate of Abu Dhabi market is much better than
international market. More, it has also been found that the stock position of Marshall is better
than NATIONAL TAKAFUL due to various strategies and better position in the international
market (Guru focus, 2017).
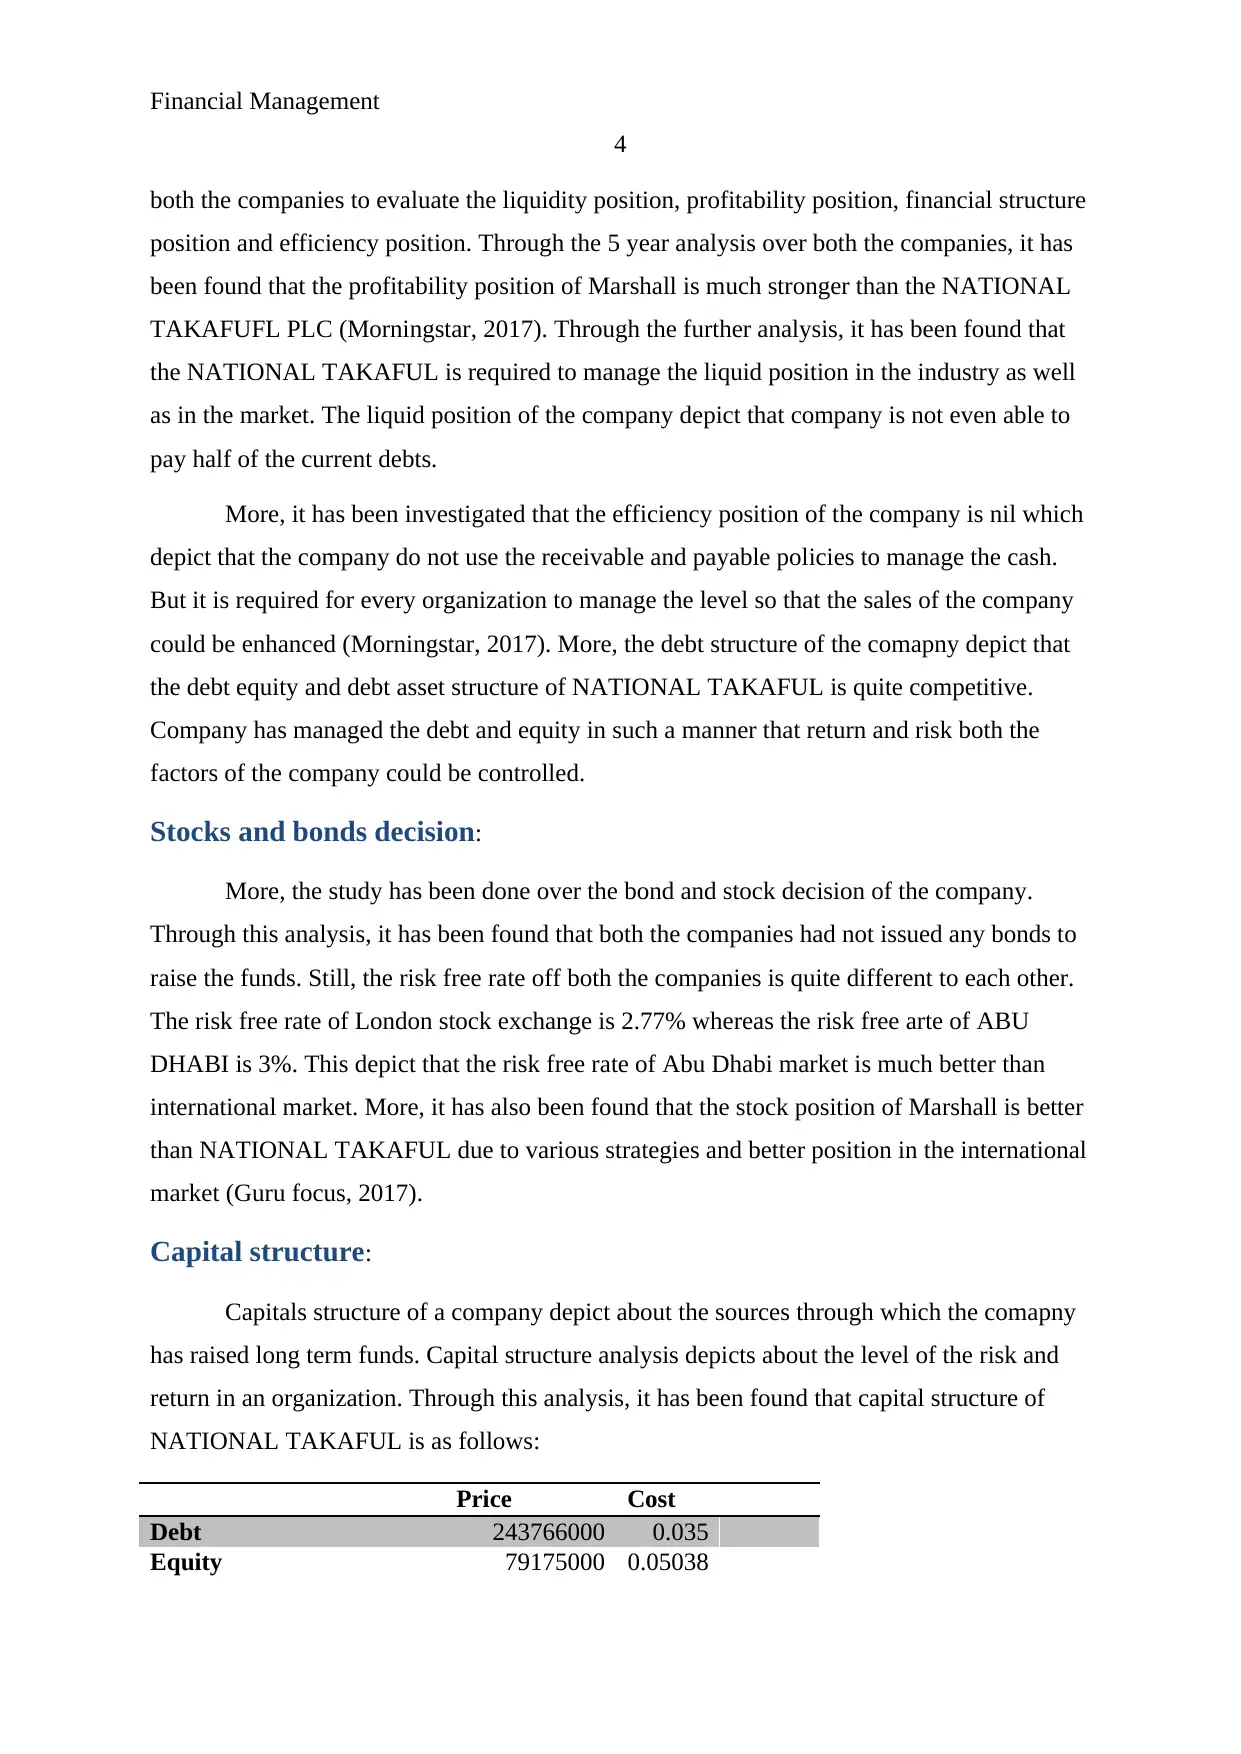
Capital structure:
Capitals structure of a company depict about the sources through which the comapny
has raised long term funds. Capital structure analysis depicts about the level of the risk and
return in an organization. Through this analysis, it has been found that capital structure of
NATIONAL TAKAFUL is as follows:
Price Cost
Debt 243766000 0.035
Equity 79175000 0.05038
4
both the companies to evaluate the liquidity position, profitability position, financial structure
position and efficiency position. Through the 5 year analysis over both the companies, it has
been found that the profitability position of Marshall is much stronger than the NATIONAL
TAKAFUFL PLC (Morningstar, 2017). Through the further analysis, it has been found that
the NATIONAL TAKAFUL is required to manage the liquid position in the industry as well
as in the market. The liquid position of the company depict that company is not even able to
pay half of the current debts.
More, it has been investigated that the efficiency position of the company is nil which
depict that the company do not use the receivable and payable policies to manage the cash.
But it is required for every organization to manage the level so that the sales of the company
could be enhanced (Morningstar, 2017). More, the debt structure of the comapny depict that
the debt equity and debt asset structure of NATIONAL TAKAFUL is quite competitive.
Company has managed the debt and equity in such a manner that return and risk both the
factors of the company could be controlled.
Stocks and bonds decision:
More, the study has been done over the bond and stock decision of the company.
Through this analysis, it has been found that both the companies had not issued any bonds to
raise the funds. Still, the risk free rate off both the companies is quite different to each other.
The risk free rate of London stock exchange is 2.77% whereas the risk free arte of ABU
DHABI is 3%. This depict that the risk free rate of Abu Dhabi market is much better than
international market. More, it has also been found that the stock position of Marshall is better
than NATIONAL TAKAFUL due to various strategies and better position in the international
market (Guru focus, 2017).
Capital structure:
Capitals structure of a company depict about the sources through which the comapny
has raised long term funds. Capital structure analysis depicts about the level of the risk and
return in an organization. Through this analysis, it has been found that capital structure of
NATIONAL TAKAFUL is as follows:
Price Cost
Debt 243766000 0.035
Equity 79175000 0.05038
Paraphrase This Document
Need a fresh take? Get an instant paraphrase of this document with our AI Paraphraser
Financial Management
5
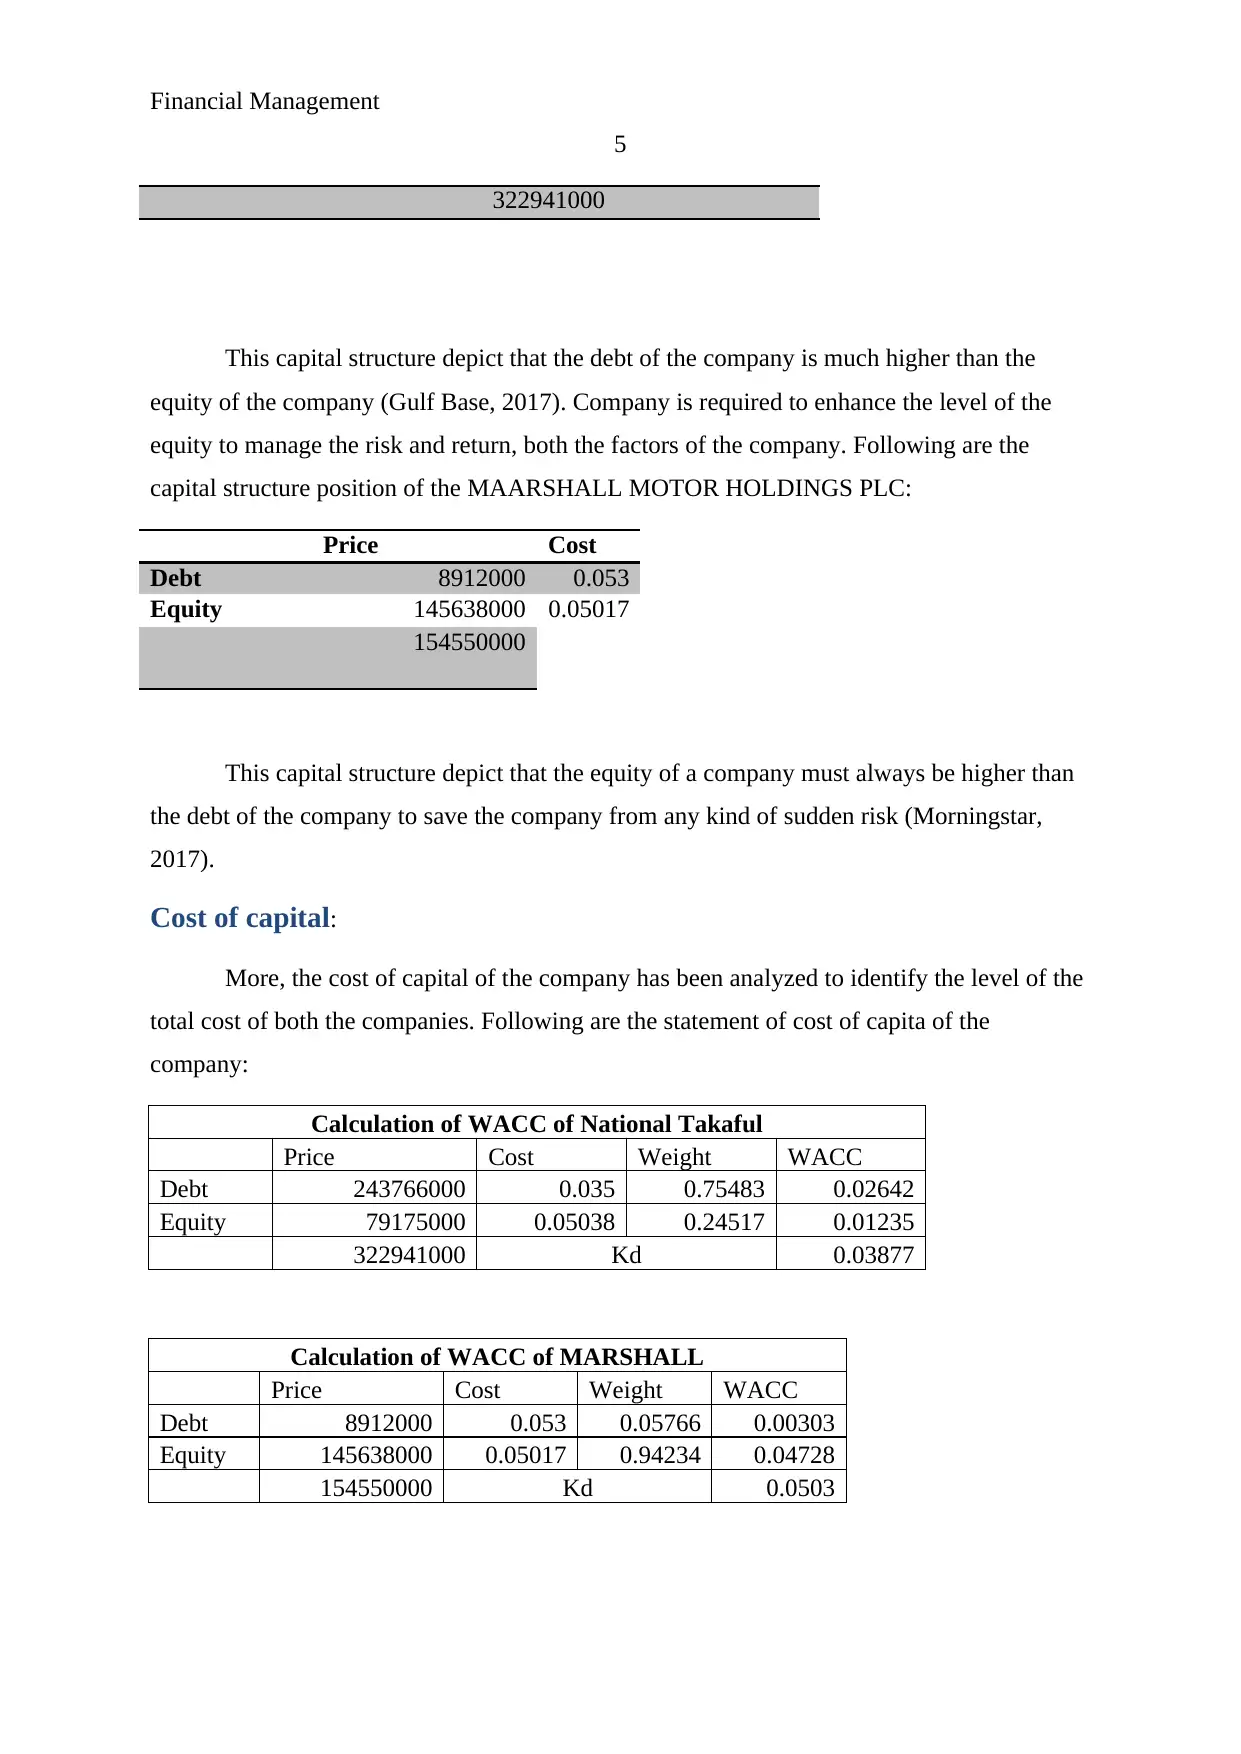
322941000
This capital structure depict that the debt of the company is much higher than the
equity of the company (Gulf Base, 2017). Company is required to enhance the level of the
equity to manage the risk and return, both the factors of the company. Following are the
capital structure position of the MAARSHALL MOTOR HOLDINGS PLC:
Price Cost
Debt 8912000 0.053
Equity 145638000 0.05017
154550000
This capital structure depict that the equity of a company must always be higher than
the debt of the company to save the company from any kind of sudden risk (Morningstar,
2017).
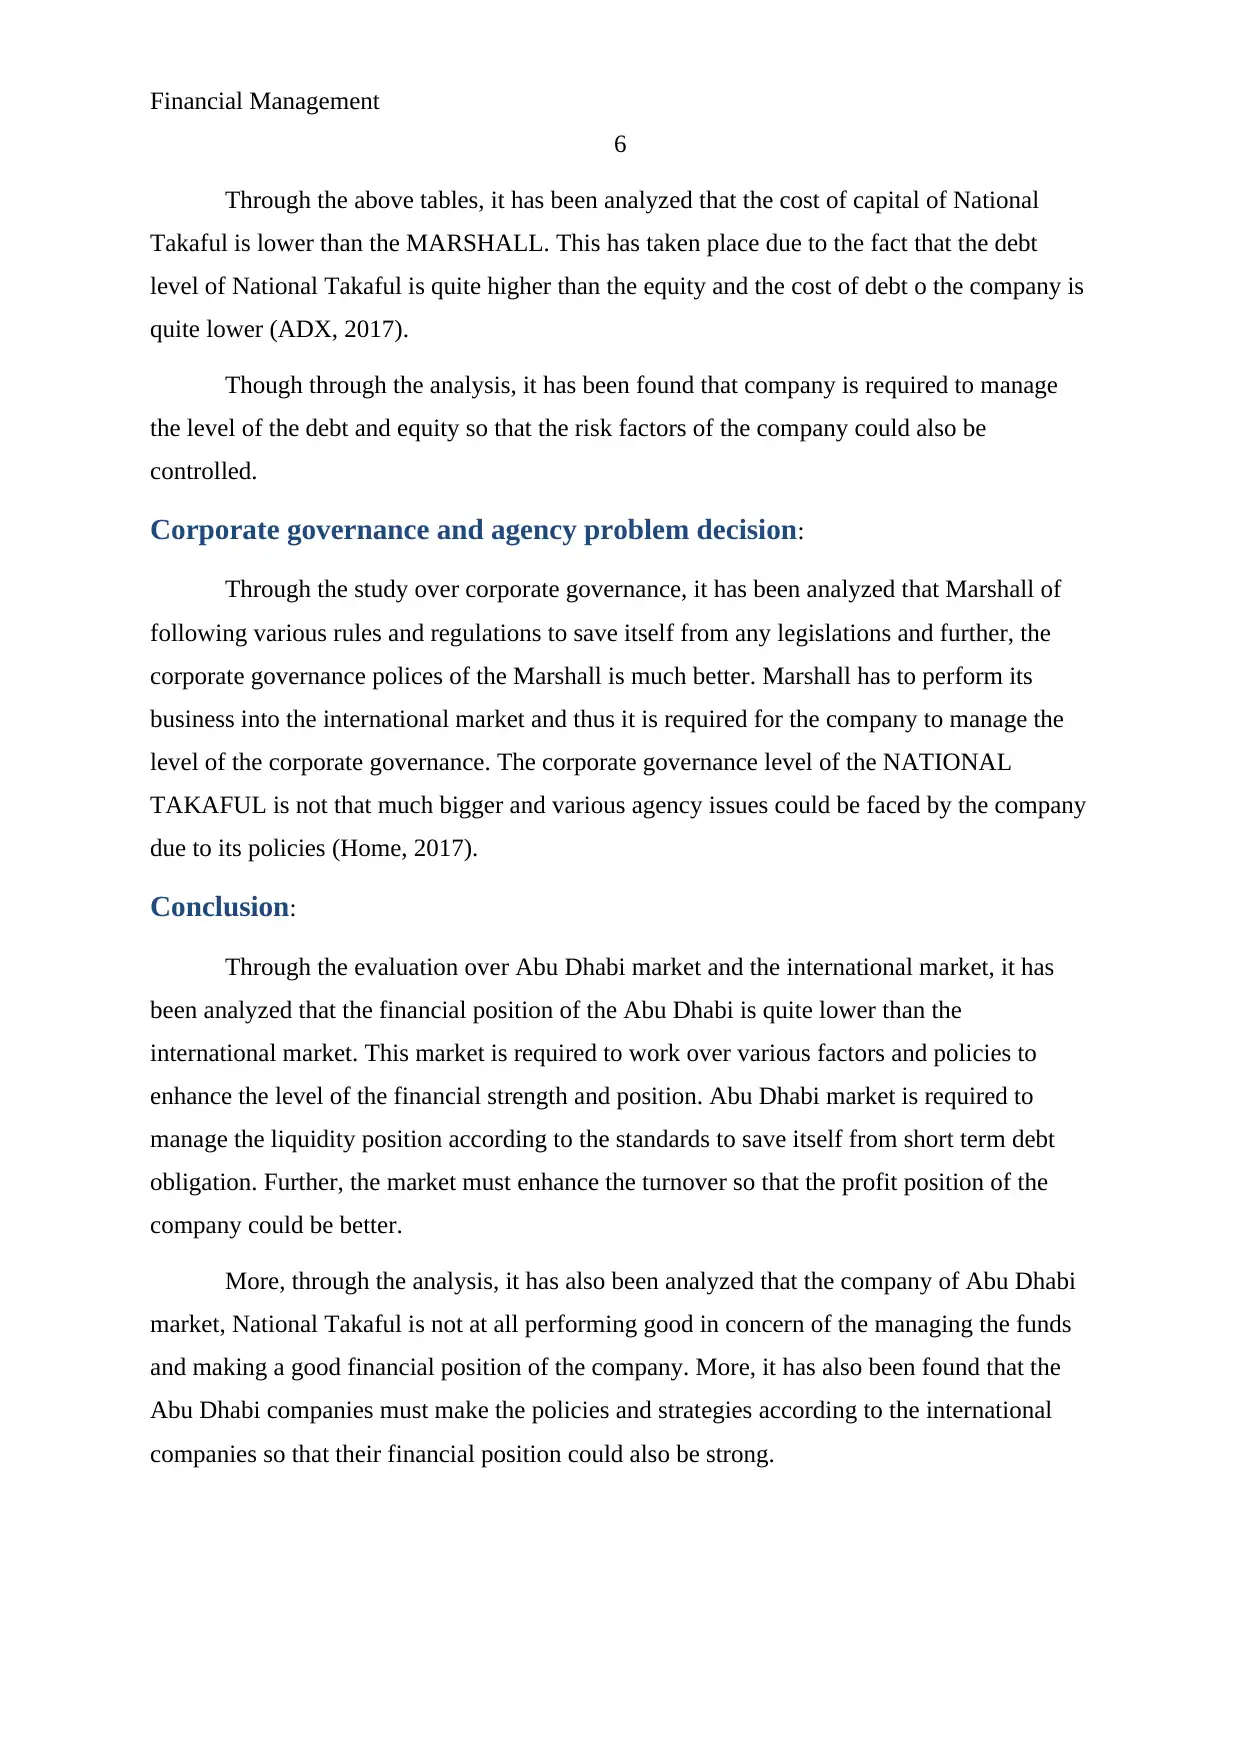
Cost of capital:
More, the cost of capital of the company has been analyzed to identify the level of the
total cost of both the companies. Following are the statement of cost of capita of the
company:
Calculation of WACC of National Takaful
Price Cost Weight WACC
Debt 243766000 0.035 0.75483 0.02642
Equity 79175000 0.05038 0.24517 0.01235
322941000 Kd 0.03877
Calculation of WACC of MARSHALL
Price Cost Weight WACC
Debt 8912000 0.053 0.05766 0.00303
Equity 145638000 0.05017 0.94234 0.04728
154550000 Kd 0.0503
5
322941000
This capital structure depict that the debt of the company is much higher than the
equity of the company (Gulf Base, 2017). Company is required to enhance the level of the
equity to manage the risk and return, both the factors of the company. Following are the
capital structure position of the MAARSHALL MOTOR HOLDINGS PLC:
Price Cost
Debt 8912000 0.053
Equity 145638000 0.05017
154550000
This capital structure depict that the equity of a company must always be higher than
the debt of the company to save the company from any kind of sudden risk (Morningstar,
2017).
Cost of capital:
More, the cost of capital of the company has been analyzed to identify the level of the
total cost of both the companies. Following are the statement of cost of capita of the
company:
Calculation of WACC of National Takaful
Price Cost Weight WACC
Debt 243766000 0.035 0.75483 0.02642
Equity 79175000 0.05038 0.24517 0.01235
322941000 Kd 0.03877
Calculation of WACC of MARSHALL
Price Cost Weight WACC
Debt 8912000 0.053 0.05766 0.00303
Equity 145638000 0.05017 0.94234 0.04728
154550000 Kd 0.0503
Financial Management
6
Through the above tables, it has been analyzed that the cost of capital of National
Takaful is lower than the MARSHALL. This has taken place due to the fact that the debt
level of National Takaful is quite higher than the equity and the cost of debt o the company is
quite lower (ADX, 2017).
Though through the analysis, it has been found that company is required to manage
the level of the debt and equity so that the risk factors of the company could also be
controlled.
Corporate governance and agency problem decision:
Through the study over corporate governance, it has been analyzed that Marshall of
following various rules and regulations to save itself from any legislations and further, the
corporate governance polices of the Marshall is much better. Marshall has to perform its
business into the international market and thus it is required for the company to manage the
level of the corporate governance. The corporate governance level of the NATIONAL
TAKAFUL is not that much bigger and various agency issues could be faced by the company
due to its policies (Home, 2017).
Conclusion:
Through the evaluation over Abu Dhabi market and the international market, it has
been analyzed that the financial position of the Abu Dhabi is quite lower than the
international market. This market is required to work over various factors and policies to
enhance the level of the financial strength and position. Abu Dhabi market is required to
manage the liquidity position according to the standards to save itself from short term debt
obligation. Further, the market must enhance the turnover so that the profit position of the
company could be better.
More, through the analysis, it has also been analyzed that the company of Abu Dhabi
market, National Takaful is not at all performing good in concern of the managing the funds
and making a good financial position of the company. More, it has also been found that the
Abu Dhabi companies must make the policies and strategies according to the international
companies so that their financial position could also be strong.
⊘ This is a preview!⊘
Do you want full access?
Subscribe today to unlock all pages.
Trusted by 1+ million students worldwide
Financial Management
7
References:
ADX. (2017). NATIONAL TAKAFUL COMPANY. Retrieved from
https://www.adx.ae/English/Pages/default.aspx available as on 20th Nov 2017.
Bloomberg. (2017). NATIONAL TAKAFUL COMPANY. Retrieved from
https://www.bloomberg.com/quote/TKFL:UH available as on 20th Nov 2017.
Gulf Base. (2017). Market Indices. Retrieved from https://www.gulfbase.com/research-
report-6173 available as on 20th Nov 2017.
Gurufocus. (2017). London stock exchange. Retrieved from
https://www.gurufocus.com/term/wacc/LDNXF/Weighted+Average+Cost+Of+Capital
+%2528WACC%2529/London+Stock+Exchange+Group+PLC available as on 20th
Nov 2017.
Home. (2017). NATIONAL TAKAFUL COMPANY. Retrieved from
https://takaful.ae/en/about-us/overview/ available as on 20th Nov 2017.
Index (2017). Insurance industry. Retrieved from https://www.takaful.ae/english/index.aspx
available as on 20th Nov 2017.
London stock exchange. (2017). Marshall Motor holdings plc. Retrieved from
http://www.londonstockexchange.com/exchange/prices-and-markets/stocks/summary/
company-summary/GB00BVYB2Q58GBGBXASQ1.html available as on 20th Nov
2017
Morningstar. (2017). Marshall Motor holdings plc. Retrieved from
http://financials.morningstar.com/ratios/r.html?t=MSLH available as on 20th Nov 2017
Morningstar. (2017). NATIONAL TAKAFUL COMPANY. Retrieved from
http://financials.morningstar.com/income-statement/is.html?t=WATANIA®ion=are
available as on 20th Nov 2017.
Paraphrase This Document
Need a fresh take? Get an instant paraphrase of this document with our AI Paraphraser
Financial Management
8
Appendix:
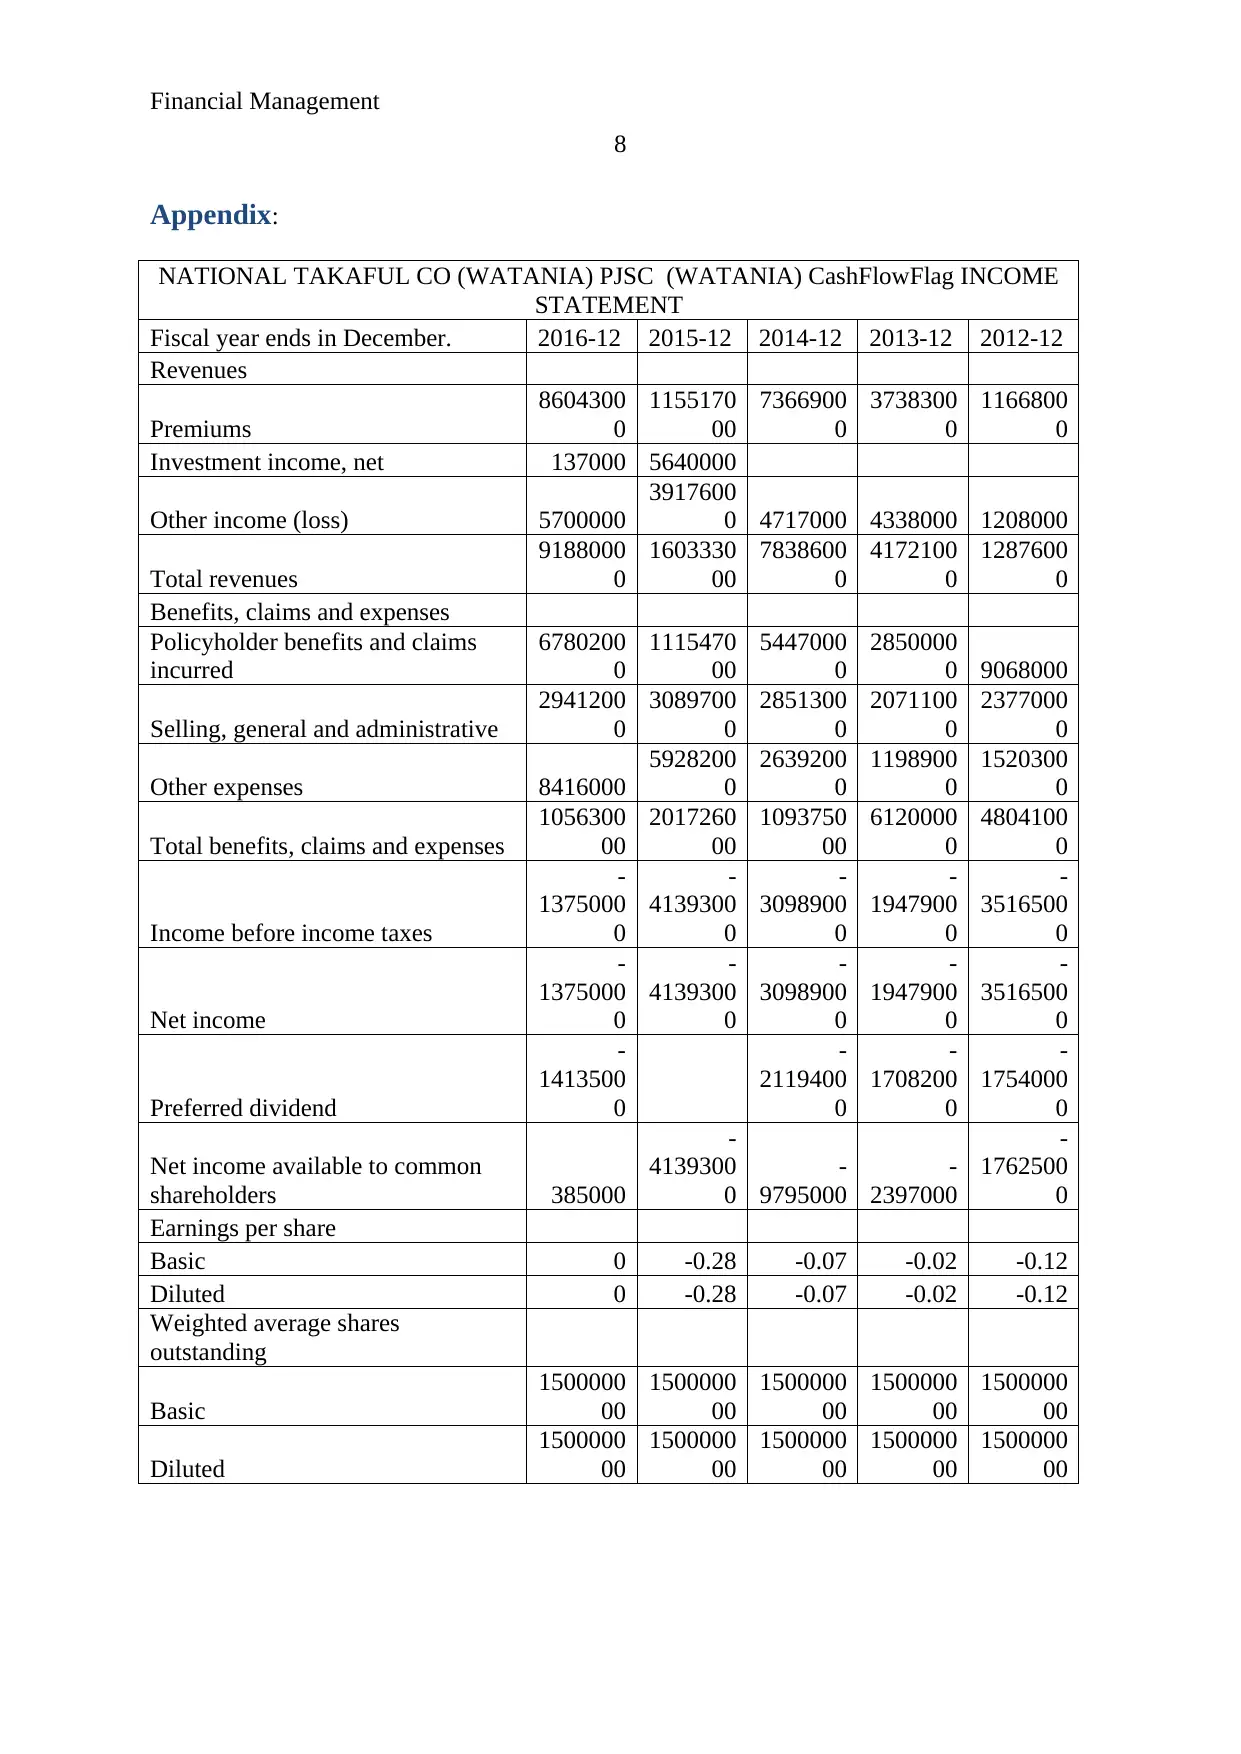
NATIONAL TAKAFUL CO (WATANIA) PJSC (WATANIA) CashFlowFlag INCOME
STATEMENT
Fiscal year ends in December. 2016-12 2015-12 2014-12 2013-12 2012-12
Revenues
Premiums
8604300
0
1155170
00
7366900
0
3738300
0
1166800
0
Investment income, net 137000 5640000
Other income (loss) 5700000
3917600
0 4717000 4338000 1208000
Total revenues
9188000
0
1603330
00
7838600
0
4172100
0
1287600
0
Benefits, claims and expenses
Policyholder benefits and claims
incurred
6780200
0
1115470
00
5447000
0
2850000
0 9068000
Selling, general and administrative
2941200
0
3089700
0
2851300
0
2071100
0
2377000
0
Other expenses 8416000
5928200
0
2639200
0
1198900
0
1520300
0
Total benefits, claims and expenses
1056300
00
2017260
00
1093750
00
6120000
0
4804100
0
Income before income taxes
-
1375000
0
-
4139300
0
-
3098900
0
-
1947900
0
-
3516500
0
Net income
-
1375000
0
-
4139300
0
-
3098900
0
-
1947900
0
-
3516500
0
Preferred dividend
-
1413500
0
-
2119400
0
-
1708200
0
-
1754000
0
Net income available to common
shareholders 385000
-
4139300
0
-
9795000
-
2397000
-
1762500
0
Earnings per share
Basic 0 -0.28 -0.07 -0.02 -0.12
Diluted 0 -0.28 -0.07 -0.02 -0.12
Weighted average shares
outstanding
Basic
1500000
00
1500000
00
1500000
00
1500000
00
1500000
00
Diluted
1500000
00
1500000
00
1500000
00
1500000
00
1500000
00
8
Appendix:
NATIONAL TAKAFUL CO (WATANIA) PJSC (WATANIA) CashFlowFlag INCOME
STATEMENT
Fiscal year ends in December. 2016-12 2015-12 2014-12 2013-12 2012-12
Revenues
Premiums
8604300
0
1155170
00
7366900
0
3738300
0
1166800
0
Investment income, net 137000 5640000
Other income (loss) 5700000
3917600
0 4717000 4338000 1208000
Total revenues
9188000
0
1603330
00
7838600
0
4172100
0
1287600
0
Benefits, claims and expenses
Policyholder benefits and claims
incurred
6780200
0
1115470
00
5447000
0
2850000
0 9068000
Selling, general and administrative
2941200
0
3089700
0
2851300
0
2071100
0
2377000
0
Other expenses 8416000
5928200
0
2639200
0
1198900
0
1520300
0
Total benefits, claims and expenses
1056300
00
2017260
00
1093750
00
6120000
0
4804100
0
Income before income taxes
-
1375000
0
-
4139300
0
-
3098900
0
-
1947900
0
-
3516500
0
Net income
-
1375000
0
-
4139300
0
-
3098900
0
-
1947900
0
-
3516500
0
Preferred dividend
-
1413500
0
-
2119400
0
-
1708200
0
-
1754000
0
Net income available to common
shareholders 385000
-
4139300
0
-
9795000
-
2397000
-
1762500
0
Earnings per share
Basic 0 -0.28 -0.07 -0.02 -0.12
Diluted 0 -0.28 -0.07 -0.02 -0.12
Weighted average shares
outstanding
Basic
1500000
00
1500000
00
1500000
00
1500000
00
1500000
00
Diluted
1500000
00
1500000
00
1500000
00
1500000
00
1500000
00
Financial Management
9
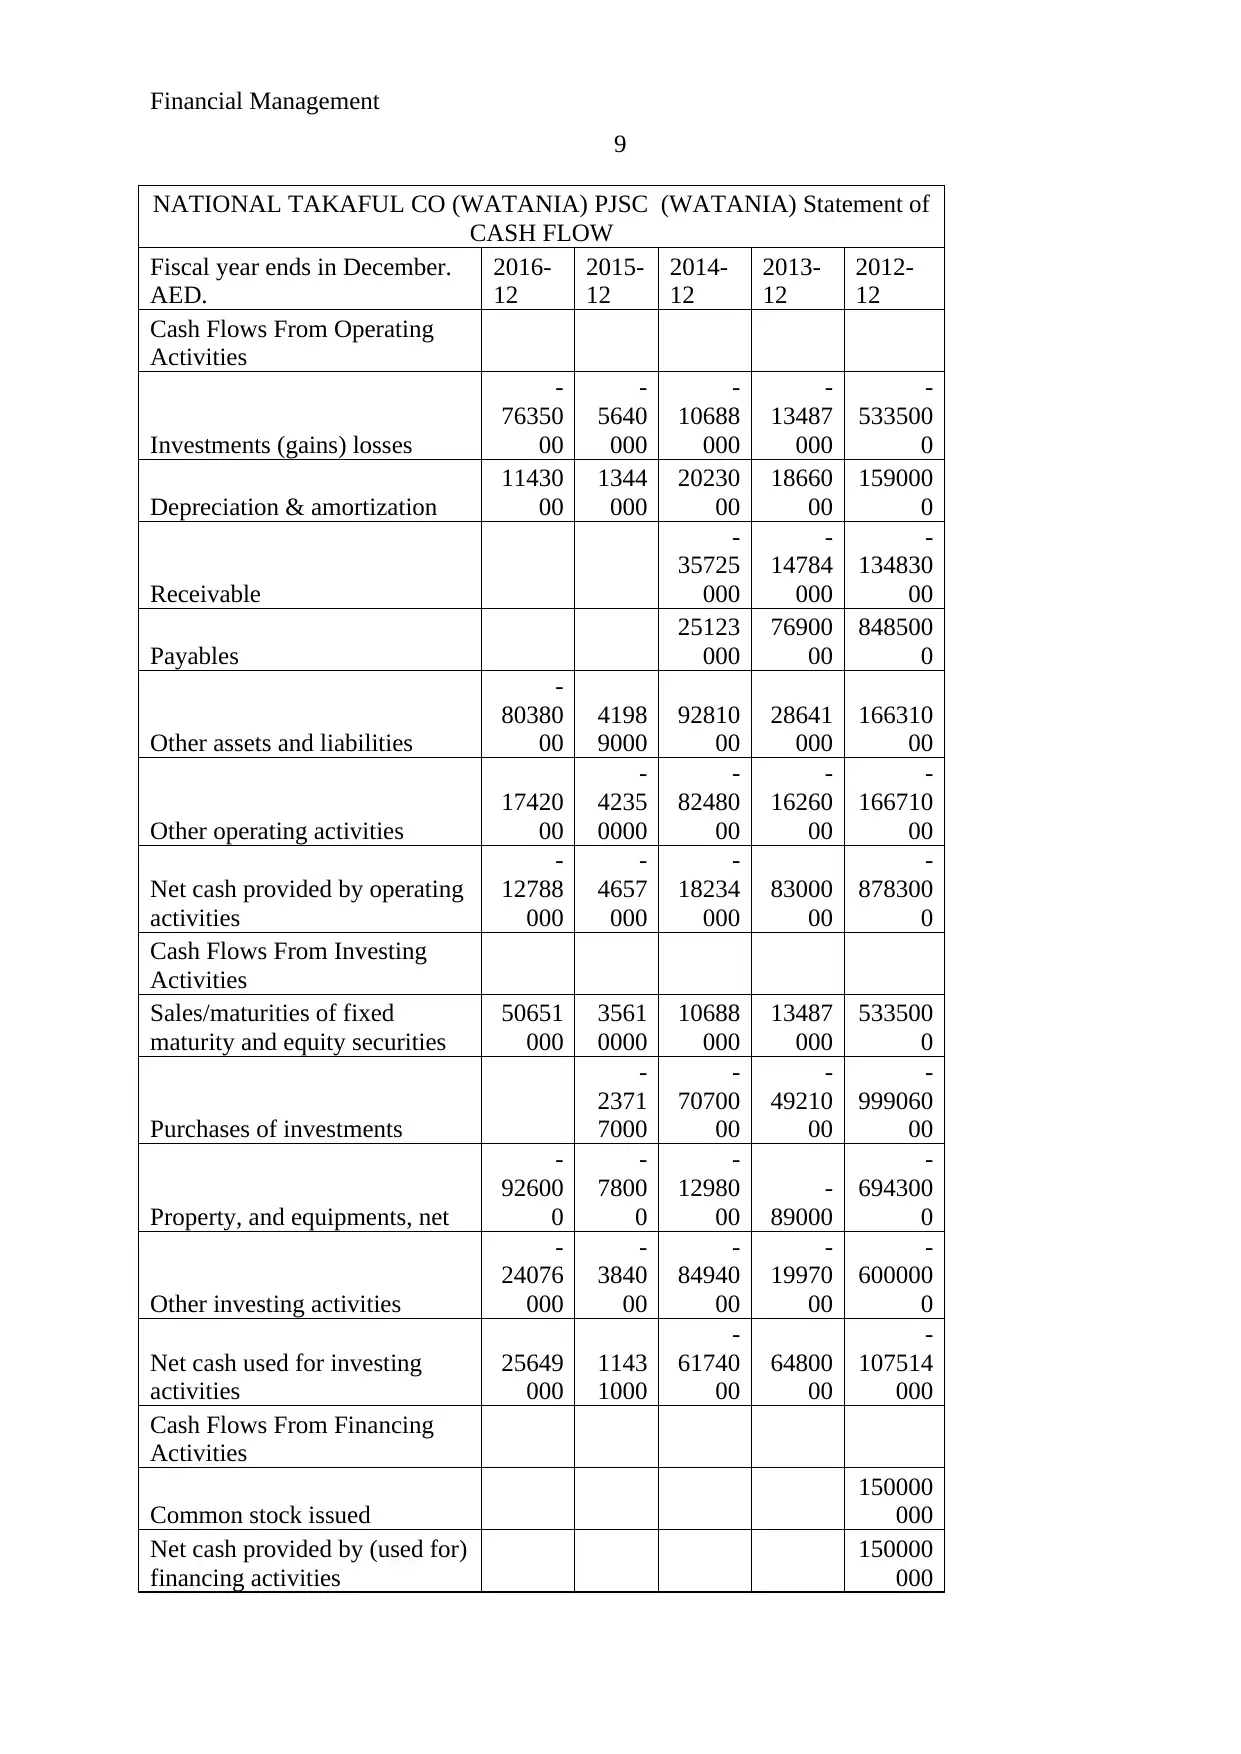
NATIONAL TAKAFUL CO (WATANIA) PJSC (WATANIA) Statement of
CASH FLOW
Fiscal year ends in December.
AED.
2016-
12
2015-
12
2014-
12
2013-
12
2012-
12
Cash Flows From Operating
Activities
Investments (gains) losses
-
76350
00
-
5640
000
-
10688
000
-
13487
000
-
533500
0
Depreciation & amortization
11430
00
1344
000
20230
00
18660
00
159000
0
Receivable
-
35725
000
-
14784
000
-
134830
00
Payables
25123
000
76900
00
848500
0
Other assets and liabilities
-
80380
00
4198
9000
92810
00
28641
000
166310
00
Other operating activities
17420
00
-
4235
0000
-
82480
00
-
16260
00
-
166710
00
Net cash provided by operating
activities
-
12788
000
-
4657
000
-
18234
000
83000
00
-
878300
0
Cash Flows From Investing
Activities
Sales/maturities of fixed
maturity and equity securities
50651
000
3561
0000
10688
000
13487
000
533500
0
Purchases of investments
-
2371
7000
-
70700
00
-
49210
00
-
999060
00
Property, and equipments, net
-
92600
0
-
7800
0
-
12980
00
-
89000
-
694300
0
Other investing activities
-
24076
000
-
3840
00
-
84940
00
-
19970
00
-
600000
0
Net cash used for investing
activities
25649
000
1143
1000
-
61740
00
64800
00
-
107514
000
Cash Flows From Financing
Activities
Common stock issued
150000
000
Net cash provided by (used for)
financing activities
150000
000
9
NATIONAL TAKAFUL CO (WATANIA) PJSC (WATANIA) Statement of
CASH FLOW
Fiscal year ends in December.
AED.
2016-
12
2015-
12
2014-
12
2013-
12
2012-
12
Cash Flows From Operating
Activities
Investments (gains) losses
-
76350
00
-
5640
000
-
10688
000
-
13487
000
-
533500
0
Depreciation & amortization
11430
00
1344
000
20230
00
18660
00
159000
0
Receivable
-
35725
000
-
14784
000
-
134830
00
Payables
25123
000
76900
00
848500
0
Other assets and liabilities
-
80380
00
4198
9000
92810
00
28641
000
166310
00
Other operating activities
17420
00
-
4235
0000
-
82480
00
-
16260
00
-
166710
00
Net cash provided by operating
activities
-
12788
000
-
4657
000
-
18234
000
83000
00
-
878300
0
Cash Flows From Investing
Activities
Sales/maturities of fixed
maturity and equity securities
50651
000
3561
0000
10688
000
13487
000
533500
0
Purchases of investments
-
2371
7000
-
70700
00
-
49210
00
-
999060
00
Property, and equipments, net
-
92600
0
-
7800
0
-
12980
00
-
89000
-
694300
0
Other investing activities
-
24076
000
-
3840
00
-
84940
00
-
19970
00
-
600000
0
Net cash used for investing
activities
25649
000
1143
1000
-
61740
00
64800
00
-
107514
000
Cash Flows From Financing
Activities
Common stock issued
150000
000
Net cash provided by (used for)
financing activities
150000
000
⊘ This is a preview!⊘
Do you want full access?
Subscribe today to unlock all pages.
Trusted by 1+ million students worldwide
Financial Management
10
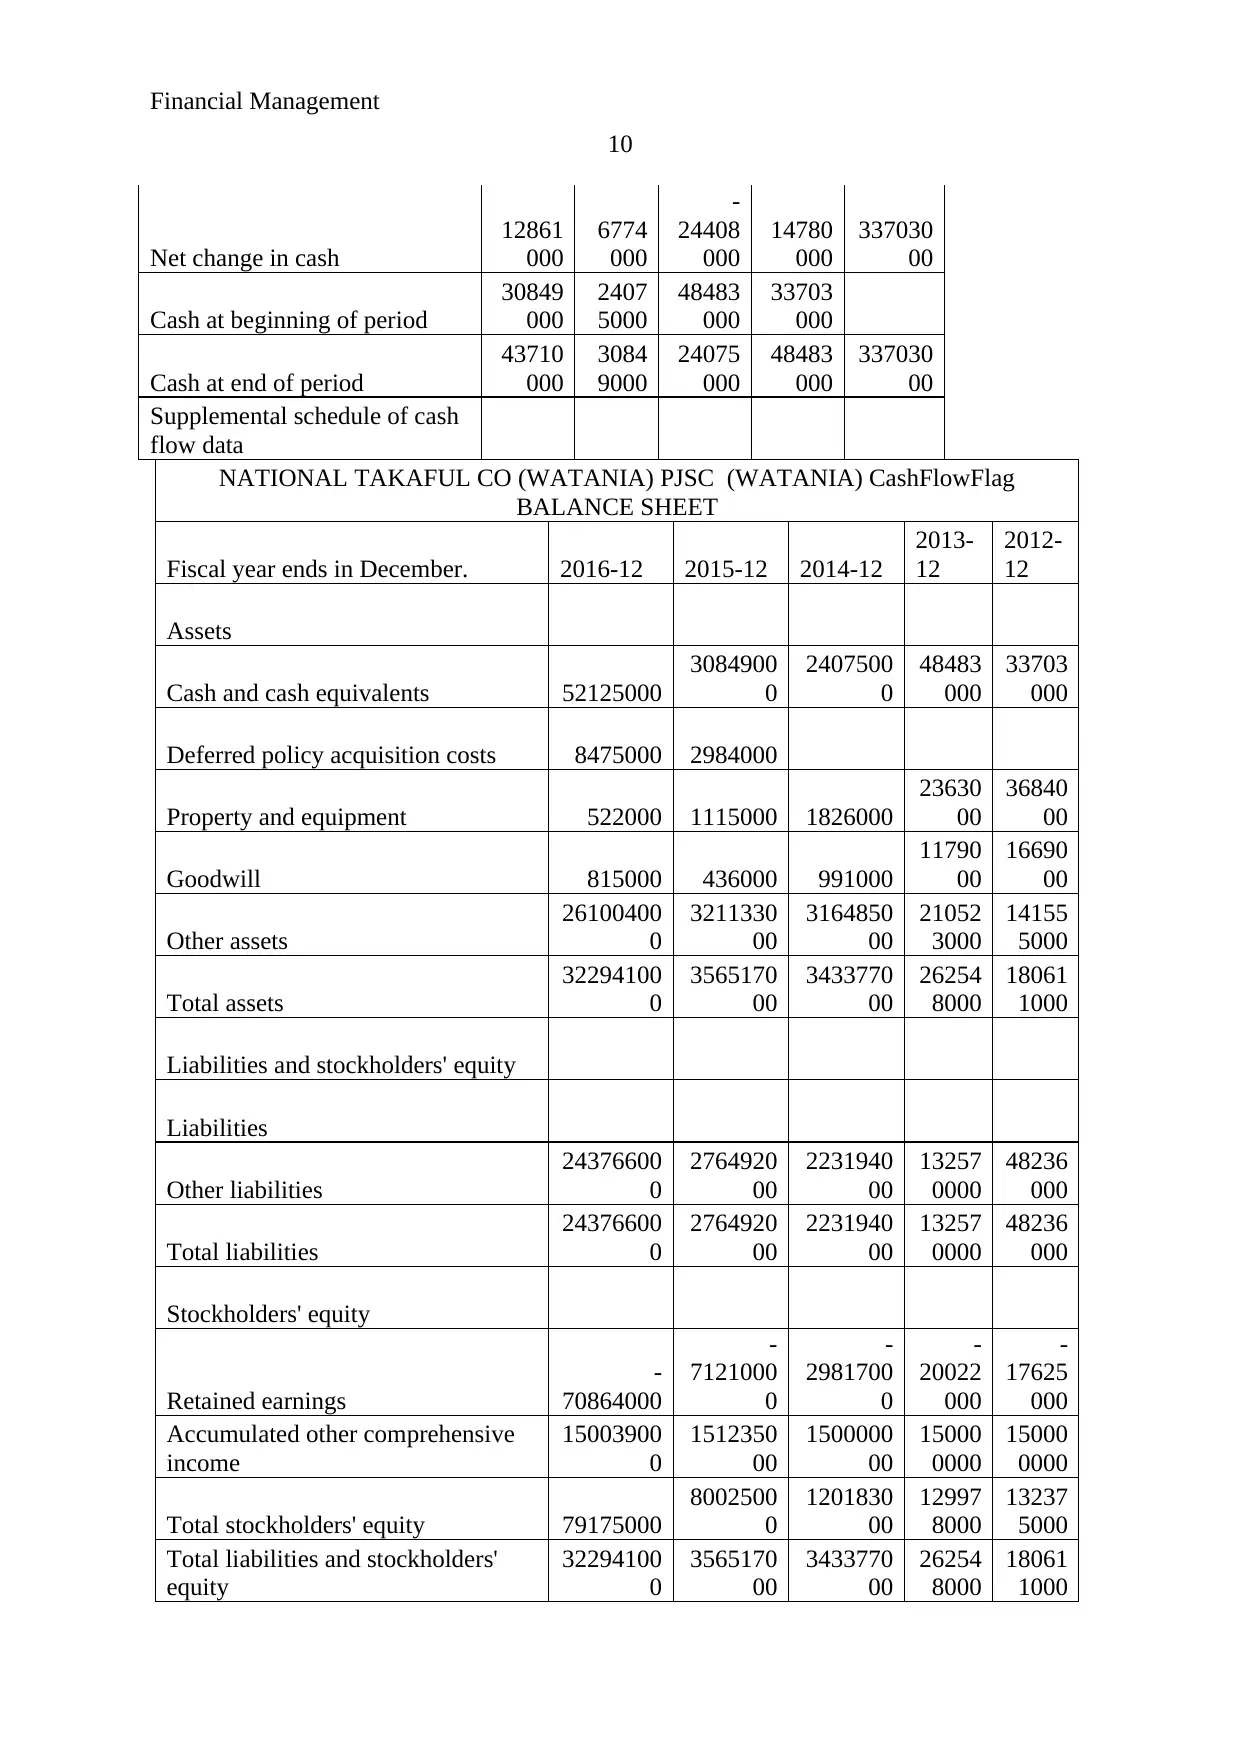
Net change in cash
12861
000
6774
000
-
24408
000
14780
000
337030
00
Cash at beginning of period
30849
000
2407
5000
48483
000
33703
000
Cash at end of period
43710
000
3084
9000
24075
000
48483
000
337030
00
Supplemental schedule of cash
flow data
NATIONAL TAKAFUL CO (WATANIA) PJSC (WATANIA) CashFlowFlag
BALANCE SHEET
Fiscal year ends in December. 2016-12 2015-12 2014-12
2013-
12
2012-
12
Assets
Cash and cash equivalents 52125000
3084900
0
2407500
0
48483
000
33703
000
Deferred policy acquisition costs 8475000 2984000
Property and equipment 522000 1115000 1826000
23630
00
36840
00
Goodwill 815000 436000 991000
11790
00
16690
00
Other assets
26100400
0
3211330
00
3164850
00
21052
3000
14155
5000
Total assets
32294100
0
3565170
00
3433770
00
26254
8000
18061
1000
Liabilities and stockholders' equity
Liabilities
Other liabilities
24376600
0
2764920
00
2231940
00
13257
0000
48236
000
Total liabilities
24376600
0
2764920
00
2231940
00
13257
0000
48236
000
Stockholders' equity
Retained earnings
-
70864000
-
7121000
0
-
2981700
0
-
20022
000
-
17625
000
Accumulated other comprehensive
income
15003900
0
1512350
00
1500000
00
15000
0000
15000
0000
Total stockholders' equity 79175000
8002500
0
1201830
00
12997
8000
13237
5000
Total liabilities and stockholders'
equity
32294100
0
3565170
00
3433770
00
26254
8000
18061
1000
10
Net change in cash
12861
000
6774
000
-
24408
000
14780
000
337030
00
Cash at beginning of period
30849
000
2407
5000
48483
000
33703
000
Cash at end of period
43710
000
3084
9000
24075
000
48483
000
337030
00
Supplemental schedule of cash
flow data
NATIONAL TAKAFUL CO (WATANIA) PJSC (WATANIA) CashFlowFlag
BALANCE SHEET
Fiscal year ends in December. 2016-12 2015-12 2014-12
2013-
12
2012-
12
Assets
Cash and cash equivalents 52125000
3084900
0
2407500
0
48483
000
33703
000
Deferred policy acquisition costs 8475000 2984000
Property and equipment 522000 1115000 1826000
23630
00
36840
00
Goodwill 815000 436000 991000
11790
00
16690
00
Other assets
26100400
0
3211330
00
3164850
00
21052
3000
14155
5000
Total assets
32294100
0
3565170
00
3433770
00
26254
8000
18061
1000
Liabilities and stockholders' equity
Liabilities
Other liabilities
24376600
0
2764920
00
2231940
00
13257
0000
48236
000
Total liabilities
24376600
0
2764920
00
2231940
00
13257
0000
48236
000
Stockholders' equity
Retained earnings
-
70864000
-
7121000
0
-
2981700
0
-
20022
000
-
17625
000
Accumulated other comprehensive
income
15003900
0
1512350
00
1500000
00
15000
0000
15000
0000
Total stockholders' equity 79175000
8002500
0
1201830
00
12997
8000
13237
5000
Total liabilities and stockholders'
equity
32294100
0
3565170
00
3433770
00
26254
8000
18061
1000
Paraphrase This Document
Need a fresh take? Get an instant paraphrase of this document with our AI Paraphraser
Financial Management
11
Descrip
tion Formula National Takaful Co
2016 2015 2014 2013 2012
Profita
bility
Net
margin
Net
profit/reve
nues -14.97% -25.82% -39.53% -46.69% -273.11%
Return
on
equity
Net
profit/Equi
ty -17.37% -51.73% -25.78% -14.99% -26.56%
Liquidi
ty
Current
ratio
Current
assets/curr
ent
liabilities 0.25 0.13 0.12 0.38 0.78
Quick
Ratio
Current
assets-
Inventory/
current
liabilities 0.25 0.13 0.12 0.38 0.78
Solvenc
y
Debt to
Equity
Ratio
Debt/
Equity 3.08 3.46 1.86 1.02 0.36
Debt to
assets
Debt/
Total
assets 0.75 0.78 0.65 0.50 0.27
Calculation of WACC
Price Cost Weight WACC
Debt 243766000 0.035 0.75483 0.02642
Equity 79175000 0.05038 0.24517 0.01235
322941000 Kd 0.03877
Calculation of cost of equity
Dividend expected 3.20%
Growth rate 5%
Financial Management
12
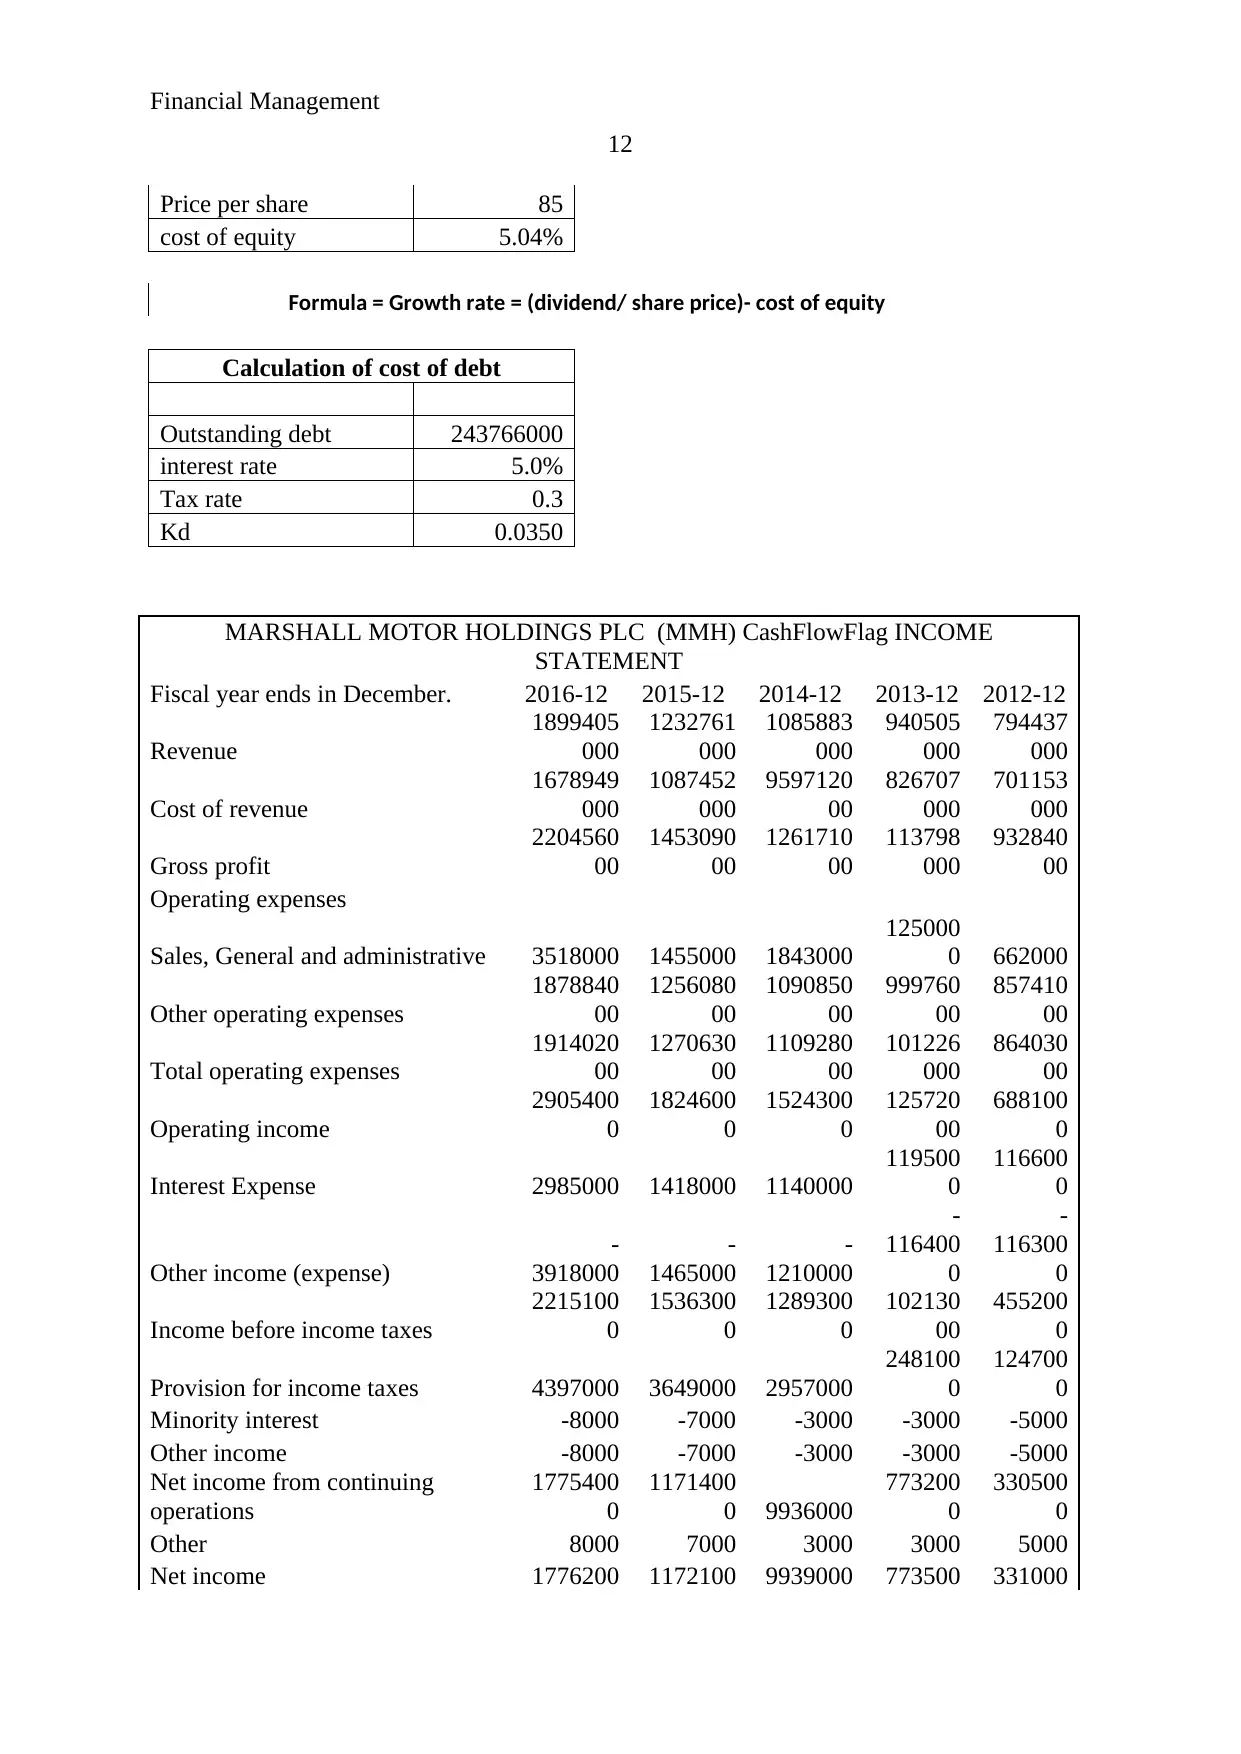
Price per share 85
cost of equity 5.04%
Formula = Growth rate = (dividend/ share price)- cost of equity
Calculation of cost of debt
Outstanding debt 243766000
interest rate 5.0%
Tax rate 0.3
Kd 0.0350
MARSHALL MOTOR HOLDINGS PLC (MMH) CashFlowFlag INCOME
STATEMENT
Fiscal year ends in December. 2016-12 2015-12 2014-12 2013-12 2012-12
Revenue
1899405
000
1232761
000
1085883
000
940505
000
794437
000
Cost of revenue
1678949
000
1087452
000
9597120
00
826707
000
701153
000
Gross profit
2204560
00
1453090
00
1261710
00
113798
000
932840
00
Operating expenses
Sales, General and administrative 3518000 1455000 1843000
125000
0 662000
Other operating expenses
1878840
00
1256080
00
1090850
00
999760
00
857410
00
Total operating expenses
1914020
00
1270630
00
1109280
00
101226
000
864030
00
Operating income
2905400
0
1824600
0
1524300
0
125720
00
688100
0
Interest Expense 2985000 1418000 1140000
119500
0
116600
0
Other income (expense)
-
3918000
-
1465000
-
1210000
-
116400
0
-
116300
0
Income before income taxes
2215100
0
1536300
0
1289300
0
102130
00
455200
0
Provision for income taxes 4397000 3649000 2957000
248100
0
124700
0
Minority interest -8000 -7000 -3000 -3000 -5000
Other income -8000 -7000 -3000 -3000 -5000
Net income from continuing
operations
1775400
0
1171400
0 9936000
773200
0
330500
0
Other 8000 7000 3000 3000 5000
Net income 1776200 1172100 9939000 773500 331000
12
Price per share 85
cost of equity 5.04%
Formula = Growth rate = (dividend/ share price)- cost of equity
Calculation of cost of debt
Outstanding debt 243766000
interest rate 5.0%
Tax rate 0.3
Kd 0.0350
MARSHALL MOTOR HOLDINGS PLC (MMH) CashFlowFlag INCOME
STATEMENT
Fiscal year ends in December. 2016-12 2015-12 2014-12 2013-12 2012-12
Revenue
1899405
000
1232761
000
1085883
000
940505
000
794437
000
Cost of revenue
1678949
000
1087452
000
9597120
00
826707
000
701153
000
Gross profit
2204560
00
1453090
00
1261710
00
113798
000
932840
00
Operating expenses
Sales, General and administrative 3518000 1455000 1843000
125000
0 662000
Other operating expenses
1878840
00
1256080
00
1090850
00
999760
00
857410
00
Total operating expenses
1914020
00
1270630
00
1109280
00
101226
000
864030
00
Operating income
2905400
0
1824600
0
1524300
0
125720
00
688100
0
Interest Expense 2985000 1418000 1140000
119500
0
116600
0
Other income (expense)
-
3918000
-
1465000
-
1210000
-
116400
0
-
116300
0
Income before income taxes
2215100
0
1536300
0
1289300
0
102130
00
455200
0
Provision for income taxes 4397000 3649000 2957000
248100
0
124700
0
Minority interest -8000 -7000 -3000 -3000 -5000
Other income -8000 -7000 -3000 -3000 -5000
Net income from continuing
operations
1775400
0
1171400
0 9936000
773200
0
330500
0
Other 8000 7000 3000 3000 5000
Net income 1776200 1172100 9939000 773500 331000
⊘ This is a preview!⊘
Do you want full access?
Subscribe today to unlock all pages.
Trusted by 1+ million students worldwide
1 out of 17
Related Documents


Your All-in-One AI-Powered Toolkit for Academic Success.
+13062052269
info@desklib.com
Available 24*7 on WhatsApp / Email
![[object Object]](/_next/static/media/star-bottom.7253800d.svg)
Unlock your academic potential
Copyright © 2020–2026 A2Z Services. All Rights Reserved. Developed and managed by ZUCOL.