Uber and Sexual Harassment: An Analysis and Research Report
VerifiedAdded on 2023/06/07
|15
|3940
|238
Report
AI Summary
This research report investigates the issue of sexual harassment at Uber. The study begins with a literature review that contextualizes the problem within the broader framework of workplace harassment and gender discrimination, and then presents the research objectives and hypotheses. The methodology section details the data collection process, which involved an online survey using Mturk, and describes the demographic profile of the 201 respondents, including gender, race, education, and income levels. The data analysis section employs statistical techniques such as t-tests, ANOVA, and correlation analysis to examine the differences in anger towards sexual harassment between genders and income groups, and the relationship between word of mouth and brand popularity. The findings reveal that women express greater anger regarding sexual harassment compared to men and that there is no significant difference in anger across different income levels. The correlation between word of mouth and brand popularity is positive but not significant. The report concludes by summarizing the key findings and discussing the implications of the study.
Uber and sexual harassment
Abstract
Sexual harassment has become one of the most serious issues in the current time as the global
brand like UBER was expected to have some measures to prevent such incidents. There were
allegation against the CEO of the company, who finally resigned from post. Apart from this the
sexual harassment cases are increasing in UBER. So, the current research has been conducted to
examine the sexual harassment at UBER and how the people react to such incidents. The primary
data was collected for the analysis purpose. A sample size of 210 respondents have been
collected using the online data collection tool. Data was analyzed using different statistical
techniques such as the t test, ANOVA and the correlation analysis. Findings from the analysis
shows that women are angrier about the sexual harassment as compared to male. There is no
difference in the anger towards sexual harassment in terms of income. Finally the correlation
between word of mouth and brand popularity is positive but not significant.
Contents
Abstract.......................................................................................................................................................1
Literature Review........................................................................................................................................1
Research objective and hypothesis..............................................................................................................2
Method sampling and the approach.............................................................................................................3
Data analysis and summarization................................................................................................................6
Conclusion.................................................................................................................................................10
Paraphrase This Document
Need a fresh take? Get an instant paraphrase of this document with our AI Paraphraser
Literature Review
Sexual harassment is one of the complex issue which negatively affect the organization,
individual and the entire society. The issue of the sexual harassment is not the new phenomenon
and there has been a long history of discrimination and harassment, especially against the
women. Even though many laws and the sexual harassment prohibition laws has been introduced
by international and national organization, women are still harassed in both the unorganized and
the organized sectors in different ways(ILO, 2016; Pereira & Rodrigues, 2014).
There has been extensive research on the issue of the sexual harassment by many scholars from
different parts of the world at different time periods. One of the study by (MacKinnon, 1979;
McLaughlin, Uggen, & Blackstone, 2012) defines it as “ the unwanted imposition of sexual
requirements in the context of a relationship of unequal power”. Furthermore the International
labor Organisation (ILO) has defined sexual harassment as “ a continuum of unacceptable
behaviors and practices that are likely to results physical, psychological or sexual harm or
suffering”(ILO, 2016). Another study by (Uggen & Blackstone, 2008) in some cases the caste
and level of the individuals in the society. In addition research by (Leskinen & Cortin,
2013)make the distinction between the sex based harassment and the sexual harassment. Authors
argued that sexual harassment may not necessarily only refer to the sexual desire only about the
sexuality, it can be the power of one particular sex over the other(Hejase, 2015; Pereira &
Rodrigues, 2014; Sharma, 2017). For example the assert power of maleness of the femaleness. In
another research by (Centre for Transforming India, 2010; McLaughlin et al., 2012) authors
argued that in most cases the sexual harassment is used as equalizer against the women who are
in power, and not as the sexual desire which is often instigated.
A research by (Pereira & Rodrigues, 2014) examined the women harassment cases and issues in
India. For the analysis purpose the authors have taken a sample from India and conducted the
descriptive statistics. Results from the analysis shows that most of the women in India are not
aware about the sexual harassment and the number of reporting of such cases are very low. On
the basis of the results authors concluded that the awareness program has to be implemented
properly.
Another research by the (Sahgal & Sahgal, 2017) conducted the exploratory reach to examine the
dynamics and the occurrence of the sexual harassment. For the analysis purpose both the
qualitative and the quantitative research has been conducted. The sample included both the
respondents from both the private and public organizations. Results from the analysis shows that
the even though the women are educated and they still dependent on the male member to support
them.
In case of UBER also there has been various allegations from employees and the riders. Due to
the sexual harassment issues the CEO of the company had to resign and there are other
allegations against him also(Recod, 2017). Furthermore UBER also fires other employees in the
organization in the sexual harassment investigation(the guardian, 2017).
Research objective and hypothesis
The current research is aimed to examine the sexual harassment at UBER. The major objective
of the research are as follows:
To examine whether the male and female have difference in terms of anger towards
sexual harassment at UBER.
To examine if the anger towards sexual harassment at UBER for people in different
income groups.
To examine if the relationship between Word of mouth about UBER and its brand value.
On the basis of the research objectives following hypothesis has been proposed.
Hypothesis
Hypothesis 1:
Null hypothesis: There is no significant difference between genders on anger towards sexual
harassment at UBER (ASP3).
⊘ This is a preview!⊘
Do you want full access?
Subscribe today to unlock all pages.
Trusted by 1+ million students worldwide
Alternative hypothesis: There is significant difference between genders on anger towards sexual
harassment at UBER (ASP3).
Hypothesis 2:
Null hypothesis: There is no significant difference between income levels on the anger towards
sexual harassment at UBER (ASP3).
Alternative hypothesis: There is significant difference between income levels on the anger
towards sexual harassment at UBER (ASP3).
Hypothesis:
Null hypothesis: There is no positive correlation between the Word of mouth (WOM3) and brand
popularity of Uber (BP4).
Alternative hypothesis: There is positive correlation between the Word of mouth (WOM3) and
brand popularity of Uber (BP4).
Method sampling and the approach
Research methodology is one of the most important part of every research. The methodology
explains all the research methods and techniques used in the study including the data collection
procedure. There are two types of research methods which can be used for any research. The first
method is the qualitative research which is used when the researcher wants to explore the
research topic and get in-depth knowledge about. The second method is the quantitative method
where the collected data is used to get useful and hidden information using different different
statistical tools and techniques.
The data is also majorly two types, namely the primary and the secondary data. The primary data
is the data collected for the first time by the researcher whereas the secondary data is already
collected by someone else.
Paraphrase This Document
Need a fresh take? Get an instant paraphrase of this document with our AI Paraphraser
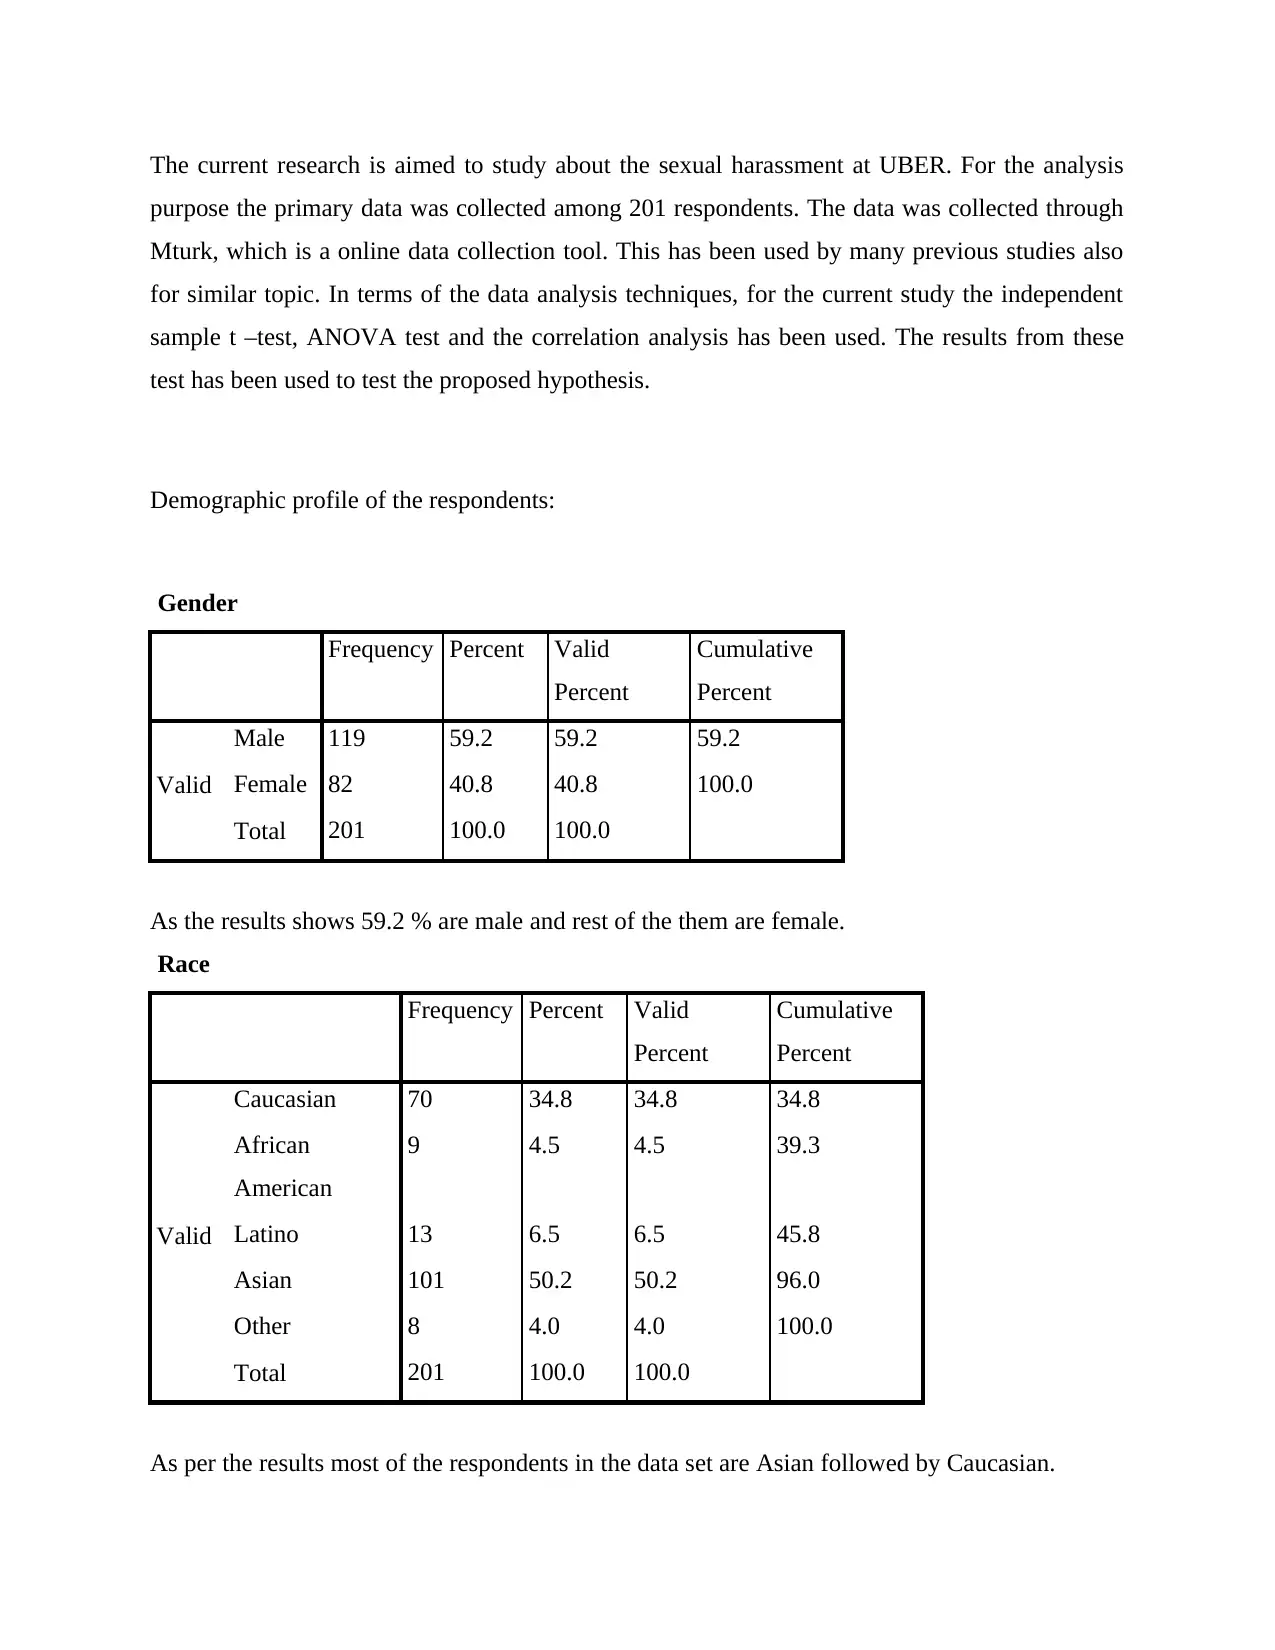
The current research is aimed to study about the sexual harassment at UBER. For the analysis
purpose the primary data was collected among 201 respondents. The data was collected through
Mturk, which is a online data collection tool. This has been used by many previous studies also
for similar topic. In terms of the data analysis techniques, for the current study the independent
sample t –test, ANOVA test and the correlation analysis has been used. The results from these
test has been used to test the proposed hypothesis.
Demographic profile of the respondents:
Gender
Frequency Percent Valid
Percent
Cumulative
Percent
Valid
Male 119 59.2 59.2 59.2
Female 82 40.8 40.8 100.0
Total 201 100.0 100.0
As the results shows 59.2 % are male and rest of the them are female.
Race
Frequency Percent Valid
Percent
Cumulative
Percent
Valid
Caucasian 70 34.8 34.8 34.8
African
American
9 4.5 4.5 39.3
Latino 13 6.5 6.5 45.8
Asian 101 50.2 50.2 96.0
Other 8 4.0 4.0 100.0
Total 201 100.0 100.0
As per the results most of the respondents in the data set are Asian followed by Caucasian.
Educational Level
Frequency Percent Valid
Percent
Cumulative
Percent
Valid
Less than high school 2 1.0 1.0 1.0
High School Diploma 24 11.9 11.9 12.9
Associates Degree 28 13.9 13.9 26.9
Undergraduate Degree 54 26.9 26.9 53.7
Graduate Degree 72 35.8 35.8 89.6
Higher than Graduate
Degree
21 10.4 10.4 100.0
Total 201 100.0 100.0
On the basis of the results it can be concluded that 35 % of the respondents are graduate and 26
% undergraduate. The proportion of the respondents with less than high school is very less.
Income
Frequency Percent Valid
Percent
Cumulative
Percent
Valid
Less than $30,000 per
year
84 41.8 41.8 41.8
Between $30,000 and
$50,000
57 28.4 28.4 70.1
Between $50,000 and
$70,000
31 15.4 15.4 85.6
Between $70,000 and
$90,000
19 9.5 9.5 95.0
More than $90,000 10 5.0 5.0 100.0
Total 201 100.0 100.0
Number of other people living in household
Frequency Percent Valid
Percent
Cumulative
Percent
Valid
Less than high school 2 1.0 1.0 1.0
High School Diploma 24 11.9 11.9 12.9
Associates Degree 28 13.9 13.9 26.9
Undergraduate Degree 54 26.9 26.9 53.7
Graduate Degree 72 35.8 35.8 89.6
Higher than Graduate
Degree
21 10.4 10.4 100.0
Total 201 100.0 100.0
On the basis of the results it can be concluded that 35 % of the respondents are graduate and 26
% undergraduate. The proportion of the respondents with less than high school is very less.
Income
Frequency Percent Valid
Percent
Cumulative
Percent
Valid
Less than $30,000 per
year
84 41.8 41.8 41.8
Between $30,000 and
$50,000
57 28.4 28.4 70.1
Between $50,000 and
$70,000
31 15.4 15.4 85.6
Between $70,000 and
$90,000
19 9.5 9.5 95.0
More than $90,000 10 5.0 5.0 100.0
Total 201 100.0 100.0
Number of other people living in household
⊘ This is a preview!⊘
Do you want full access?
Subscribe today to unlock all pages.
Trusted by 1+ million students worldwide
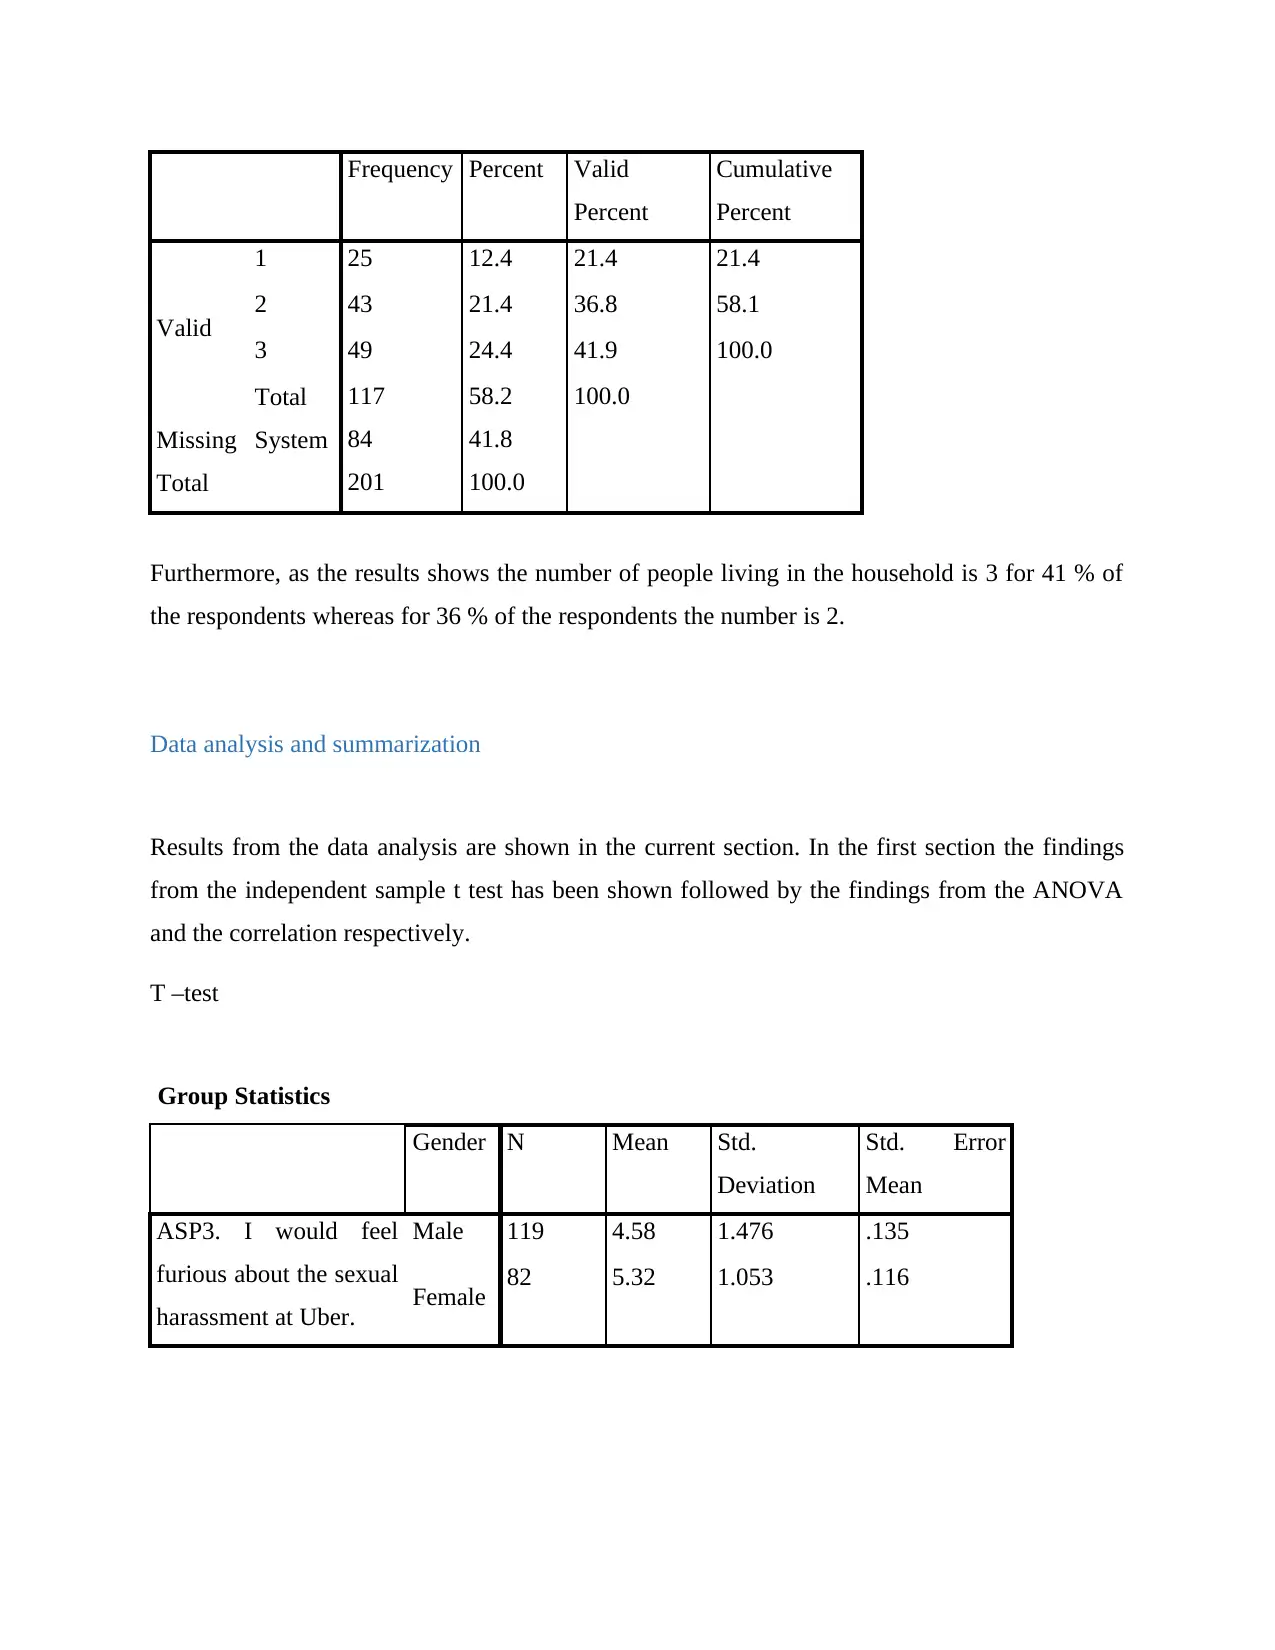
Frequency Percent Valid
Percent
Cumulative
Percent
Valid
1 25 12.4 21.4 21.4
2 43 21.4 36.8 58.1
3 49 24.4 41.9 100.0
Total 117 58.2 100.0
Missing System 84 41.8
Total 201 100.0
Furthermore, as the results shows the number of people living in the household is 3 for 41 % of
the respondents whereas for 36 % of the respondents the number is 2.
Data analysis and summarization
Results from the data analysis are shown in the current section. In the first section the findings
from the independent sample t test has been shown followed by the findings from the ANOVA
and the correlation respectively.
T –test
Group Statistics
Gender N Mean Std.
Deviation
Std. Error
Mean
ASP3. I would feel
furious about the sexual
harassment at Uber.
Male 119 4.58 1.476 .135
Female 82 5.32 1.053 .116
Percent
Cumulative
Percent
Valid
1 25 12.4 21.4 21.4
2 43 21.4 36.8 58.1
3 49 24.4 41.9 100.0
Total 117 58.2 100.0
Missing System 84 41.8
Total 201 100.0
Furthermore, as the results shows the number of people living in the household is 3 for 41 % of
the respondents whereas for 36 % of the respondents the number is 2.
Data analysis and summarization
Results from the data analysis are shown in the current section. In the first section the findings
from the independent sample t test has been shown followed by the findings from the ANOVA
and the correlation respectively.
T –test
Group Statistics
Gender N Mean Std.
Deviation
Std. Error
Mean
ASP3. I would feel
furious about the sexual
harassment at Uber.
Male 119 4.58 1.476 .135
Female 82 5.32 1.053 .116
Paraphrase This Document
Need a fresh take? Get an instant paraphrase of this document with our AI Paraphraser
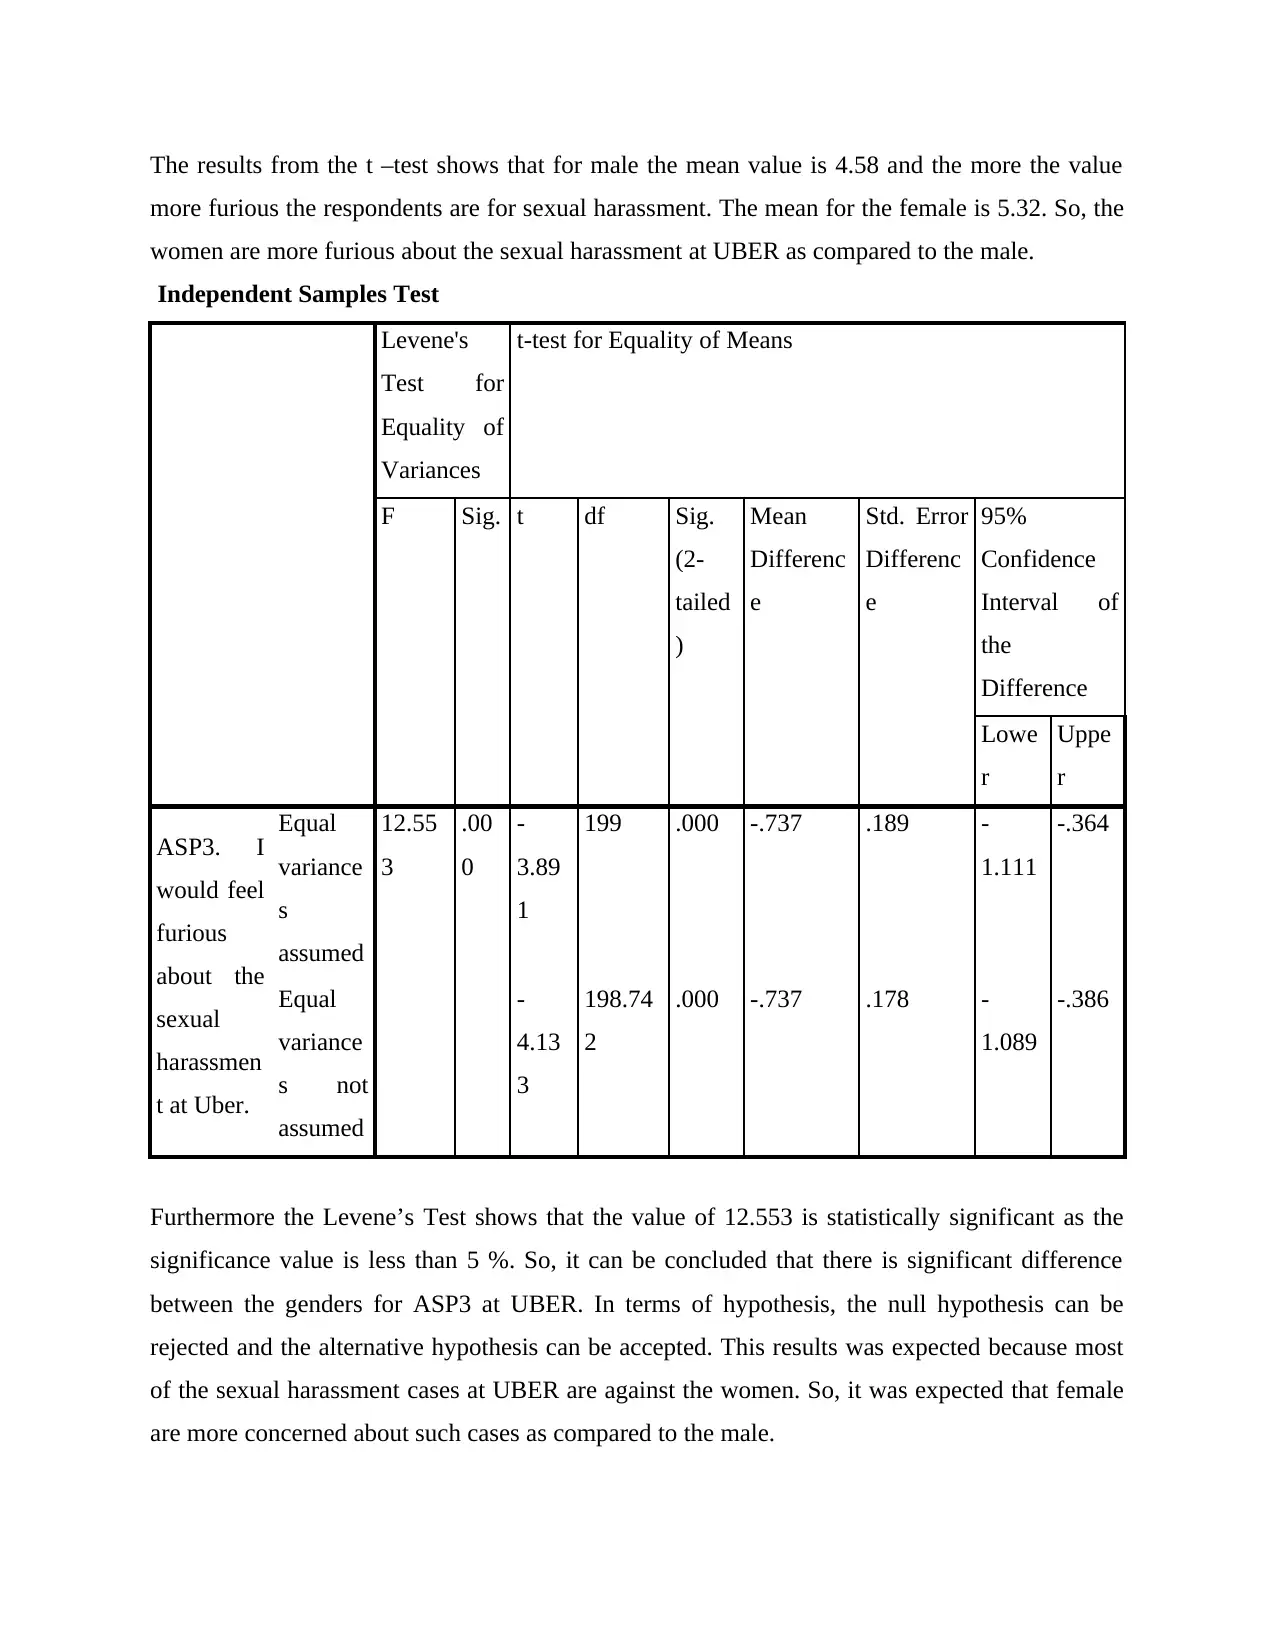
The results from the t –test shows that for male the mean value is 4.58 and the more the value
more furious the respondents are for sexual harassment. The mean for the female is 5.32. So, the
women are more furious about the sexual harassment at UBER as compared to the male.
Independent Samples Test
Levene's
Test for
Equality of
Variances
t-test for Equality of Means
F Sig. t df Sig.
(2-
tailed
)
Mean
Differenc
e
Std. Error
Differenc
e
95%
Confidence
Interval of
the
Difference
Lowe
r
Uppe
r
ASP3. I
would feel
furious
about the
sexual
harassmen
t at Uber.
Equal
variance
s
assumed
12.55
3
.00
0
-
3.89
1
199 .000 -.737 .189 -
1.111
-.364
Equal
variance
s not
assumed
-
4.13
3
198.74
2
.000 -.737 .178 -
1.089
-.386
Furthermore the Levene’s Test shows that the value of 12.553 is statistically significant as the
significance value is less than 5 %. So, it can be concluded that there is significant difference
between the genders for ASP3 at UBER. In terms of hypothesis, the null hypothesis can be
rejected and the alternative hypothesis can be accepted. This results was expected because most
of the sexual harassment cases at UBER are against the women. So, it was expected that female
are more concerned about such cases as compared to the male.
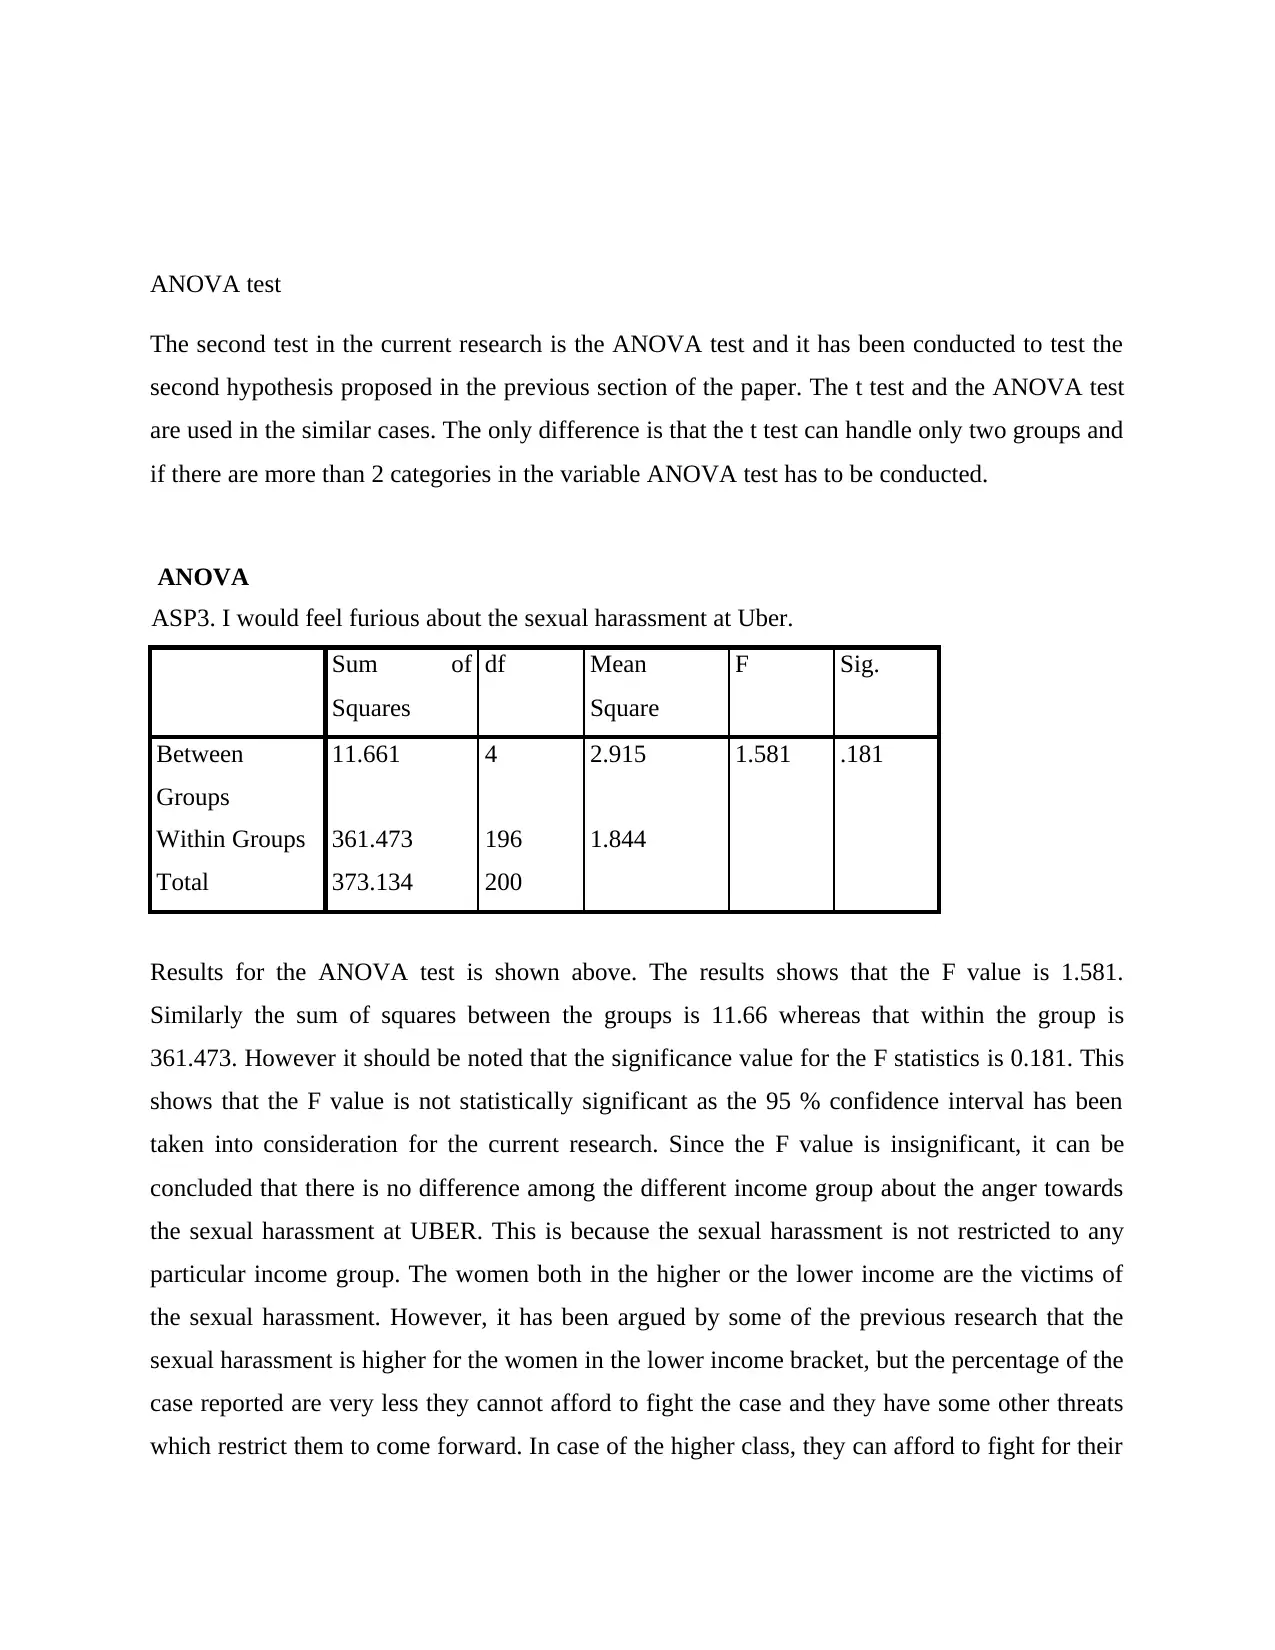
ANOVA test
The second test in the current research is the ANOVA test and it has been conducted to test the
second hypothesis proposed in the previous section of the paper. The t test and the ANOVA test
are used in the similar cases. The only difference is that the t test can handle only two groups and
if there are more than 2 categories in the variable ANOVA test has to be conducted.
ANOVA
ASP3. I would feel furious about the sexual harassment at Uber.
Sum of
Squares
df Mean
Square
F Sig.
Between
Groups
11.661 4 2.915 1.581 .181
Within Groups 361.473 196 1.844
Total 373.134 200
Results for the ANOVA test is shown above. The results shows that the F value is 1.581.
Similarly the sum of squares between the groups is 11.66 whereas that within the group is
361.473. However it should be noted that the significance value for the F statistics is 0.181. This
shows that the F value is not statistically significant as the 95 % confidence interval has been
taken into consideration for the current research. Since the F value is insignificant, it can be
concluded that there is no difference among the different income group about the anger towards
the sexual harassment at UBER. This is because the sexual harassment is not restricted to any
particular income group. The women both in the higher or the lower income are the victims of
the sexual harassment. However, it has been argued by some of the previous research that the
sexual harassment is higher for the women in the lower income bracket, but the percentage of the
case reported are very less they cannot afford to fight the case and they have some other threats
which restrict them to come forward. In case of the higher class, they can afford to fight for their
⊘ This is a preview!⊘
Do you want full access?
Subscribe today to unlock all pages.
Trusted by 1+ million students worldwide
rights and are also aware of their rights. Based on the results the null hypothesis cannot be
rejected.
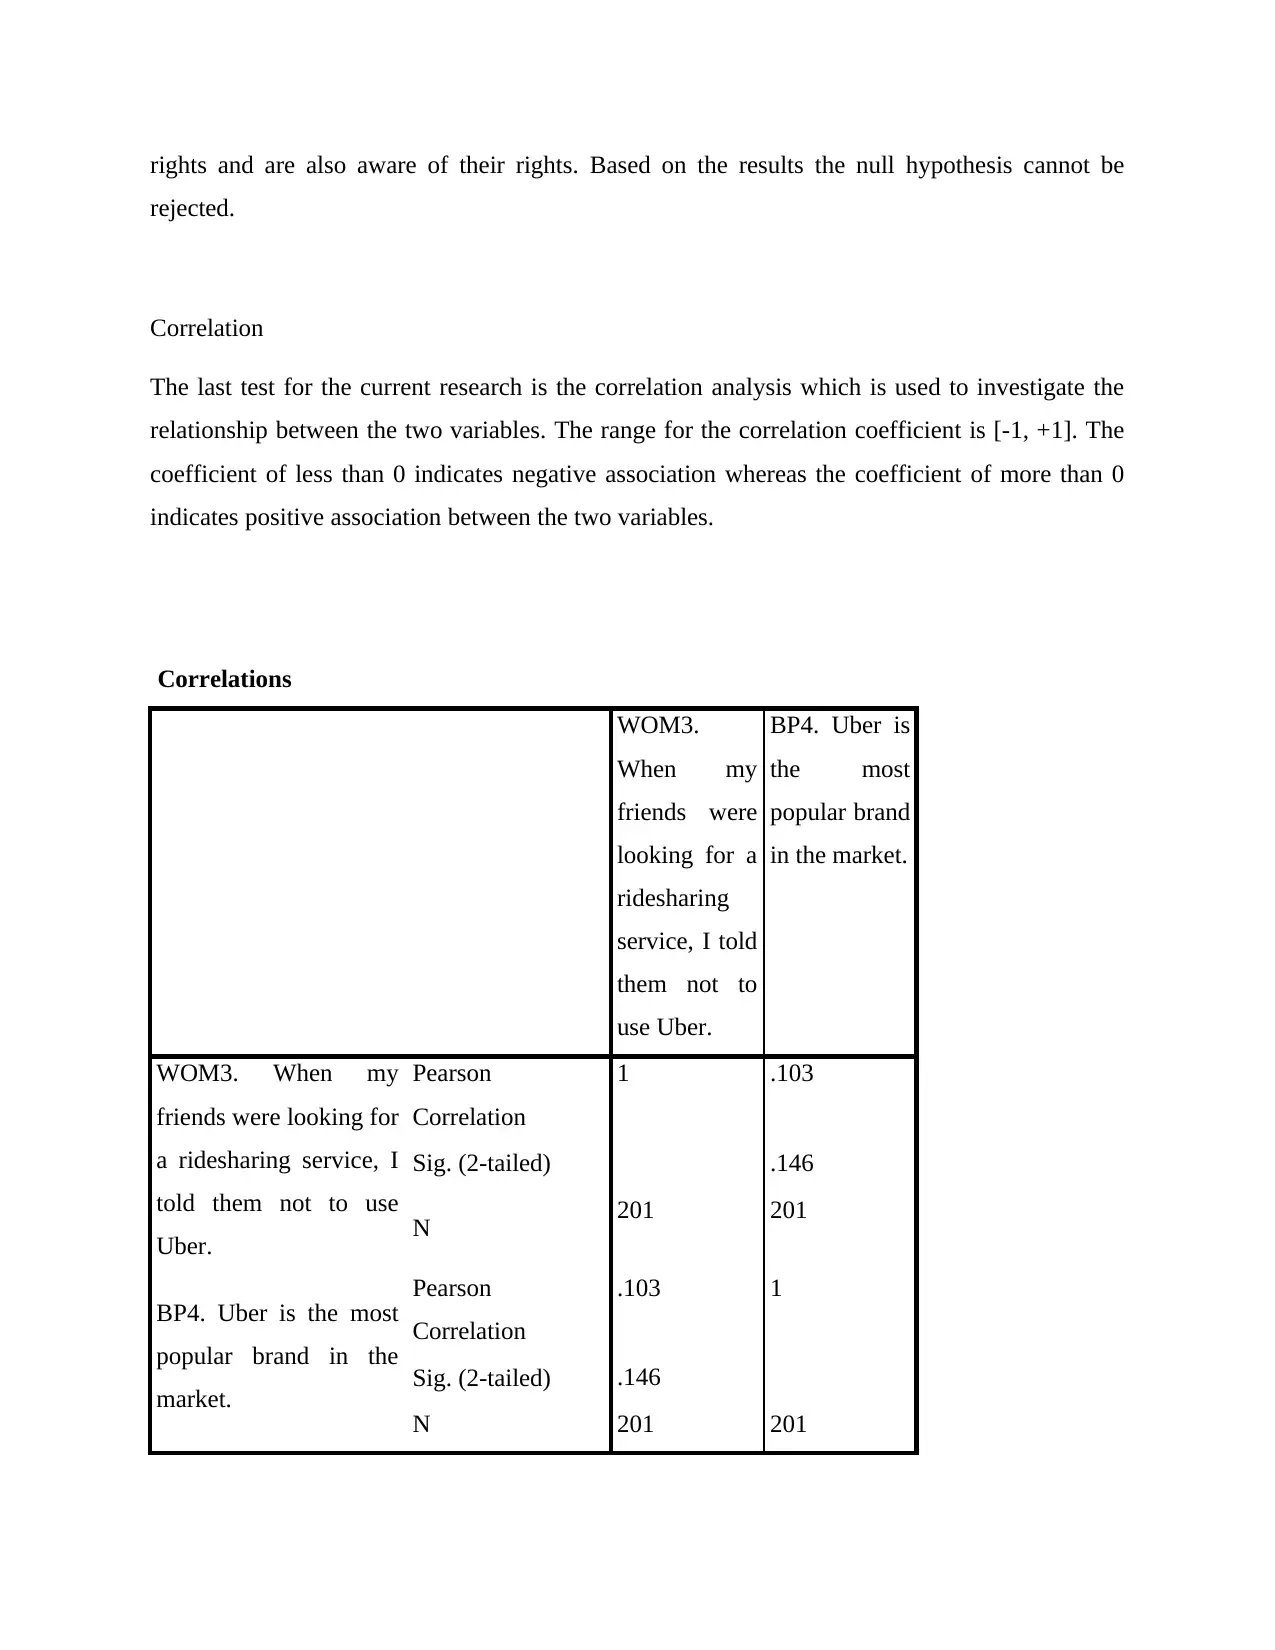
Correlation
The last test for the current research is the correlation analysis which is used to investigate the
relationship between the two variables. The range for the correlation coefficient is [-1, +1]. The
coefficient of less than 0 indicates negative association whereas the coefficient of more than 0
indicates positive association between the two variables.
Correlations
WOM3.
When my
friends were
looking for a
ridesharing
service, I told
them not to
use Uber.
BP4. Uber is
the most
popular brand
in the market.
WOM3. When my
friends were looking for
a ridesharing service, I
told them not to use
Uber.
Pearson
Correlation
1 .103
Sig. (2-tailed) .146
N 201 201
BP4. Uber is the most
popular brand in the
market.
Pearson
Correlation
.103 1
Sig. (2-tailed) .146
N 201 201
rejected.
Correlation
The last test for the current research is the correlation analysis which is used to investigate the
relationship between the two variables. The range for the correlation coefficient is [-1, +1]. The
coefficient of less than 0 indicates negative association whereas the coefficient of more than 0
indicates positive association between the two variables.
Correlations
WOM3.
When my
friends were
looking for a
ridesharing
service, I told
them not to
use Uber.
BP4. Uber is
the most
popular brand
in the market.
WOM3. When my
friends were looking for
a ridesharing service, I
told them not to use
Uber.
Pearson
Correlation
1 .103
Sig. (2-tailed) .146
N 201 201
BP4. Uber is the most
popular brand in the
market.
Pearson
Correlation
.103 1
Sig. (2-tailed) .146
N 201 201
Paraphrase This Document
Need a fresh take? Get an instant paraphrase of this document with our AI Paraphraser
For the current case the correlation has been used to examine the relationship between the word
of mouth and the brand popularity of the UBER. As the table shows that correlation coefficient is
0.103 which indicates that the word of mouth and the brand popularity are positively correlated.
However the relationship is not statistically significant. It was expected that the with negative
word of mouth the brand popularity of the UBER will decrease. In other words the negative
correlation was expected. From the previous research it has been shown the word of mouth is
one of the most important factor for any brand and negative word of mouth have negative impact
on the brand. In this case even though the coefficient is positive the p value is more than 0.05, so
the null hypotheis cannot be rejected.
Conclusion
The current research is aimed to study about the sexual harassment at UBER as there has been
increasing incidents about the sexual harassment at UBER both at the higher management level
to the drivel level. For the current research the primary data was collected among 210
respondents using the online data collection portal Mturk. The collected data was analyzed in
SPSS using different statistical tools. This includes the t- test, ANOVA test and the correlation
analysis. The results from the research have various managerial implication which has been
discussed in the following section.
Managerial implication
The results from the t-test shows that the female are angrier about the sexual harassment at
UBER as compared to the male. This is may be because the more sexual harassment cases are
faced by women and there are very rare cases where the male are harassed. So, the UBER
management needs to take quick decision so that the women can feel safe not only while riding
the UBER but also at the UBER workplace. The sexual harassment case of the UBER CEO is
well known so the management should focus on building the culture that the women are safe and
also provide the proper platform so that they can come forward in such cases.
Similarly the results from the data analysis shows that there is no difference in the anger towards
the sexual harassment for respondents in different income level. This clearly indicates that
irrespective of the income and the status people and especially the women are sexually harassed
at UBER. So the management have an important role to play in such cases. It can also be argued
that if the sexual harassment cases are high among the high income group, such cases for lower
income group is much higher, as most of the women in the lower income are threated to not
speak about those incidents. So, the focus should be on preventing the harassment at all levels
and the strict rules and regulations need to be introduced and implemented. This will send a
message to the people to thinks before harassing someone. Also the awareness program should
be conducted to aware people about such issues. This is because some people think that this is
normal and there is such laws which they can use to protect themselves, especially in the lower
income level.
In addition the results from the correlation shows positive but insignificant relationship between
the word of mouth and the brand popularity of the UBER. The negative word of mouth have
adverse impact on the brand value, so UBER should focus on improving the brand value by
solving the concerns of the people. A proper grievance redressal system should be implemented
so that people start having positive brand image. To improve the word of mouth UBER can also
conducte its own survey among the riders and employees and identify the major problems faced
by the people including the sexual harassment. One of the issue for people coming forward about
the sexual harassment is of the social pressure. In such cases the privacy becomes an important
issues. UBER should ensure that if someone wants to complain without revealing the identity,
the proper mechanism should be there.
Research Limitation
Some of the major limitation of the research includes the sample size and the research
methodology used in the analysis. In the current research all the analysis has been done only
using the quantitative research method and there is no qualitative method used. A sensitive issue
like the sexual harassment should have been done using the qualitative research also which could
have provide more details about the issue. Another limitation is related to the sample size of the
study. UBER is now a global brand and it has its presence in many countries. However the
sample for the current study has been collected only from the United States. So, a larger sample
size can be collected from different countries so that the results can be generalized.
⊘ This is a preview!⊘
Do you want full access?
Subscribe today to unlock all pages.
Trusted by 1+ million students worldwide
1 out of 15
Related Documents


Your All-in-One AI-Powered Toolkit for Academic Success.
+13062052269
info@desklib.com
Available 24*7 on WhatsApp / Email
![[object Object]](/_next/static/media/star-bottom.7253800d.svg)
Unlock your academic potential
Copyright © 2020–2026 A2Z Services. All Rights Reserved. Developed and managed by ZUCOL.