Uber Valuation: Financial Analysis for FN 4535 Module

Verified

Added on  2022/09/11

|11
|669
|13
Project
AI Summary
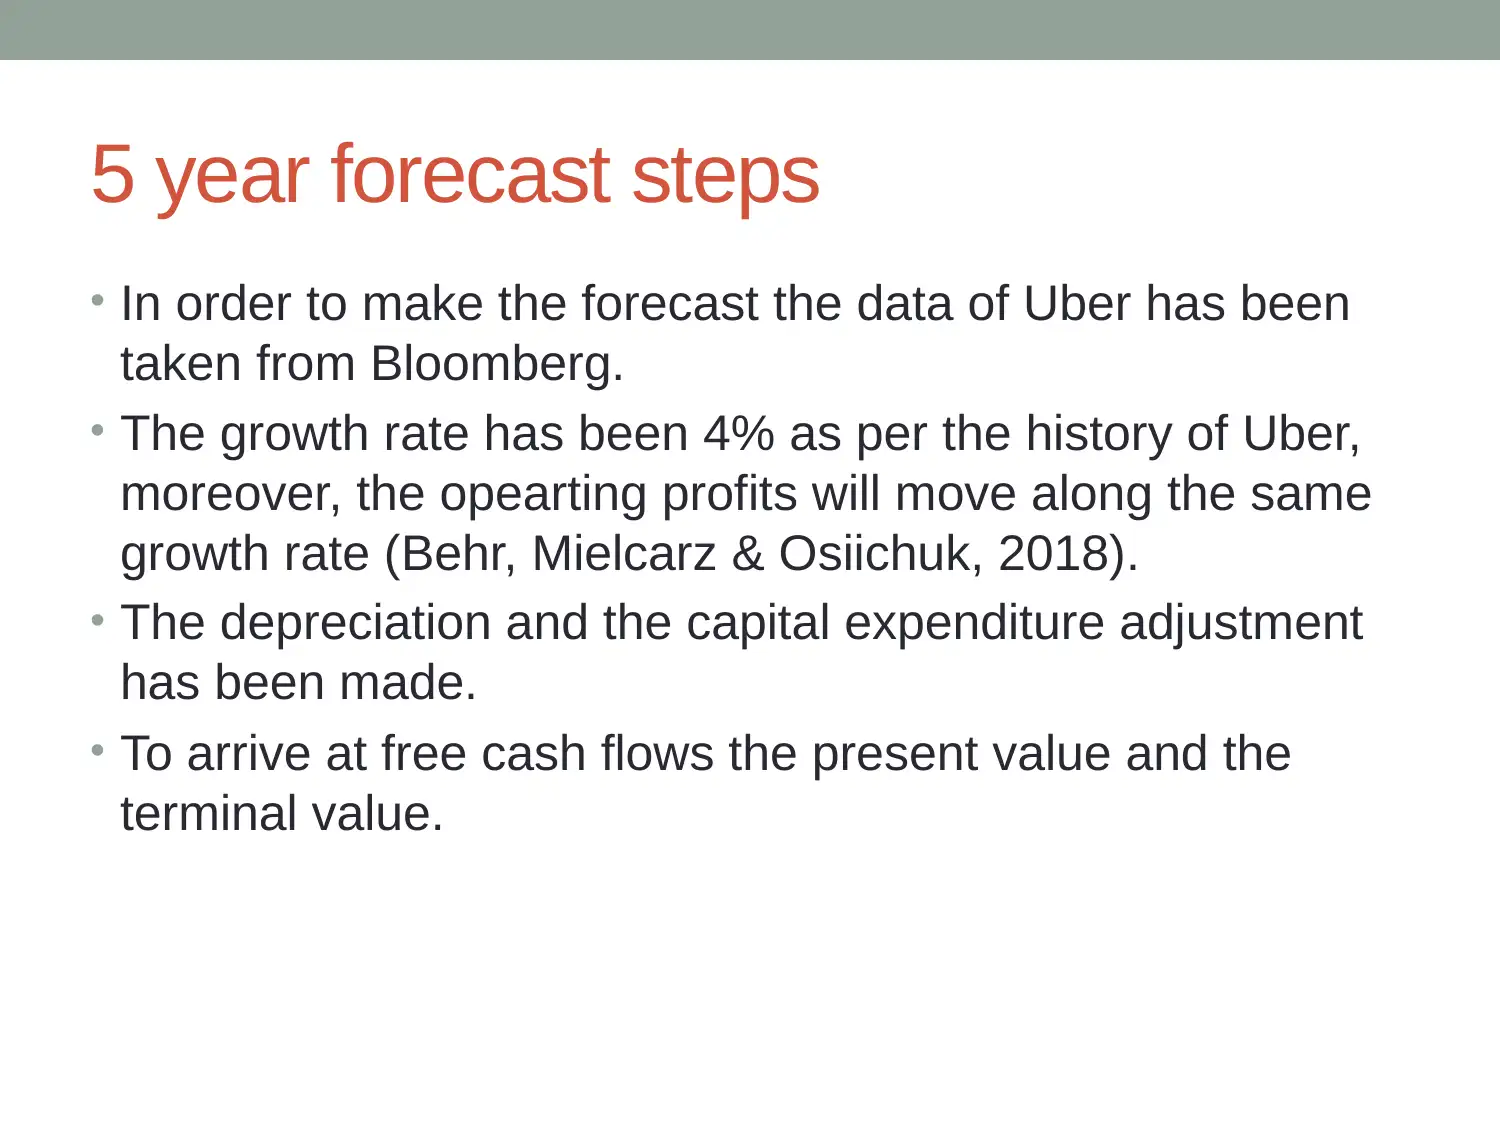
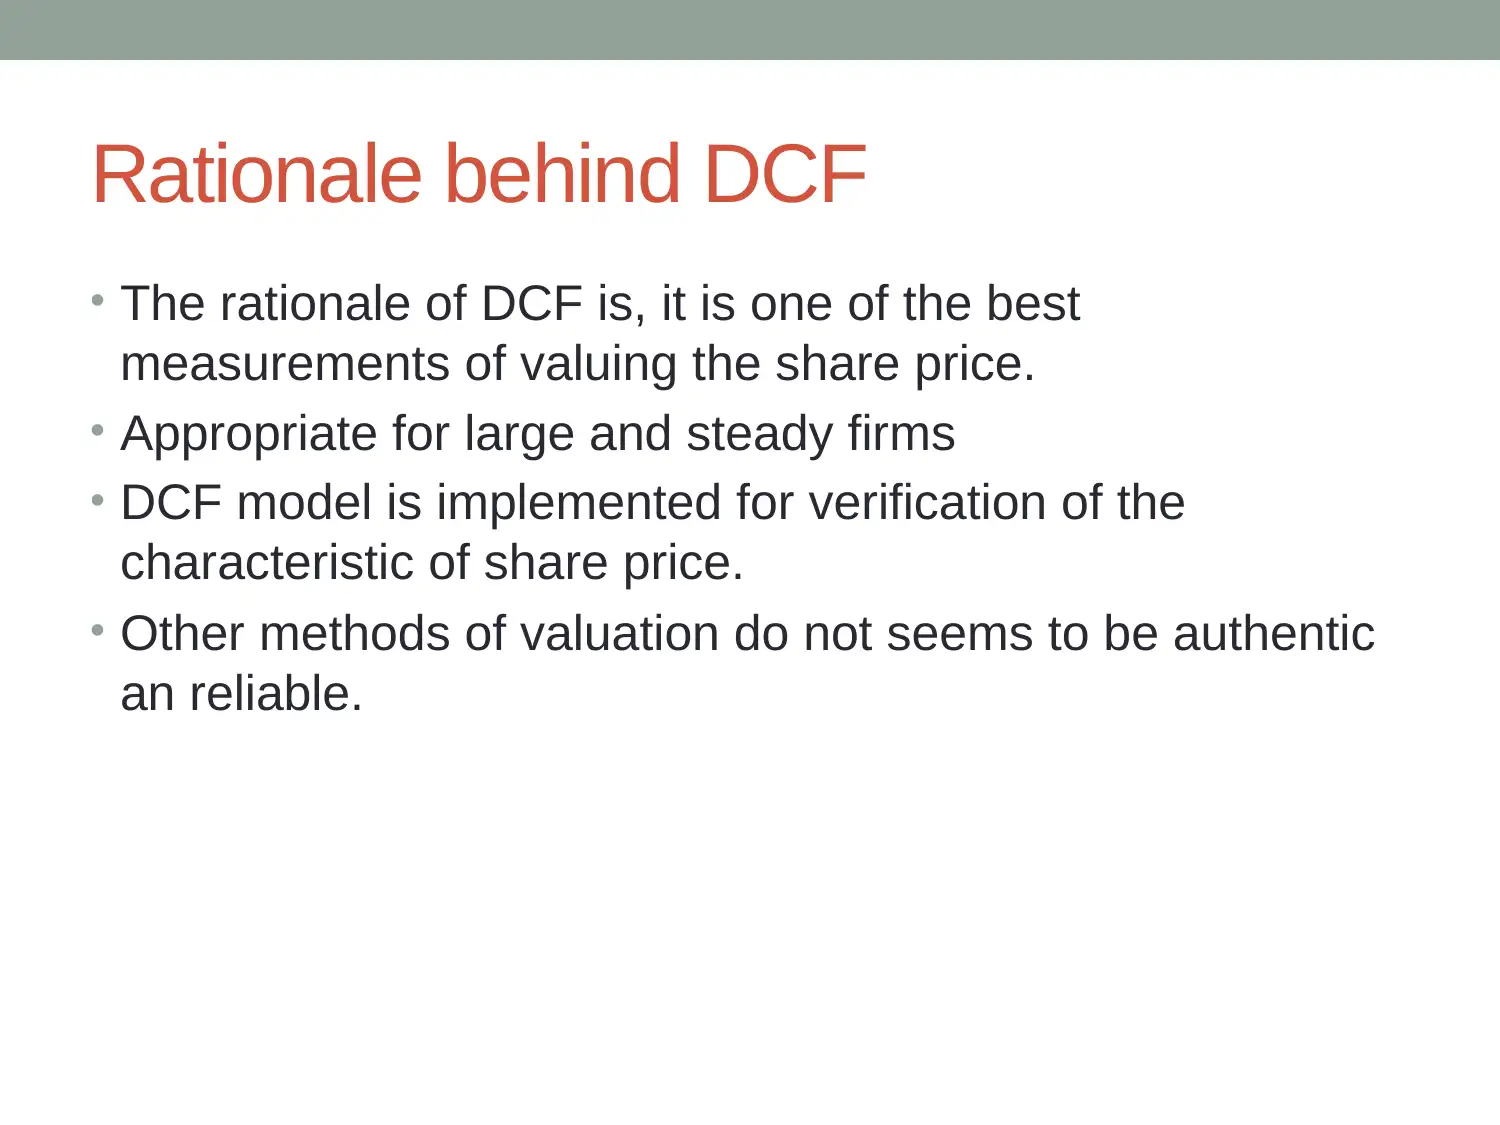
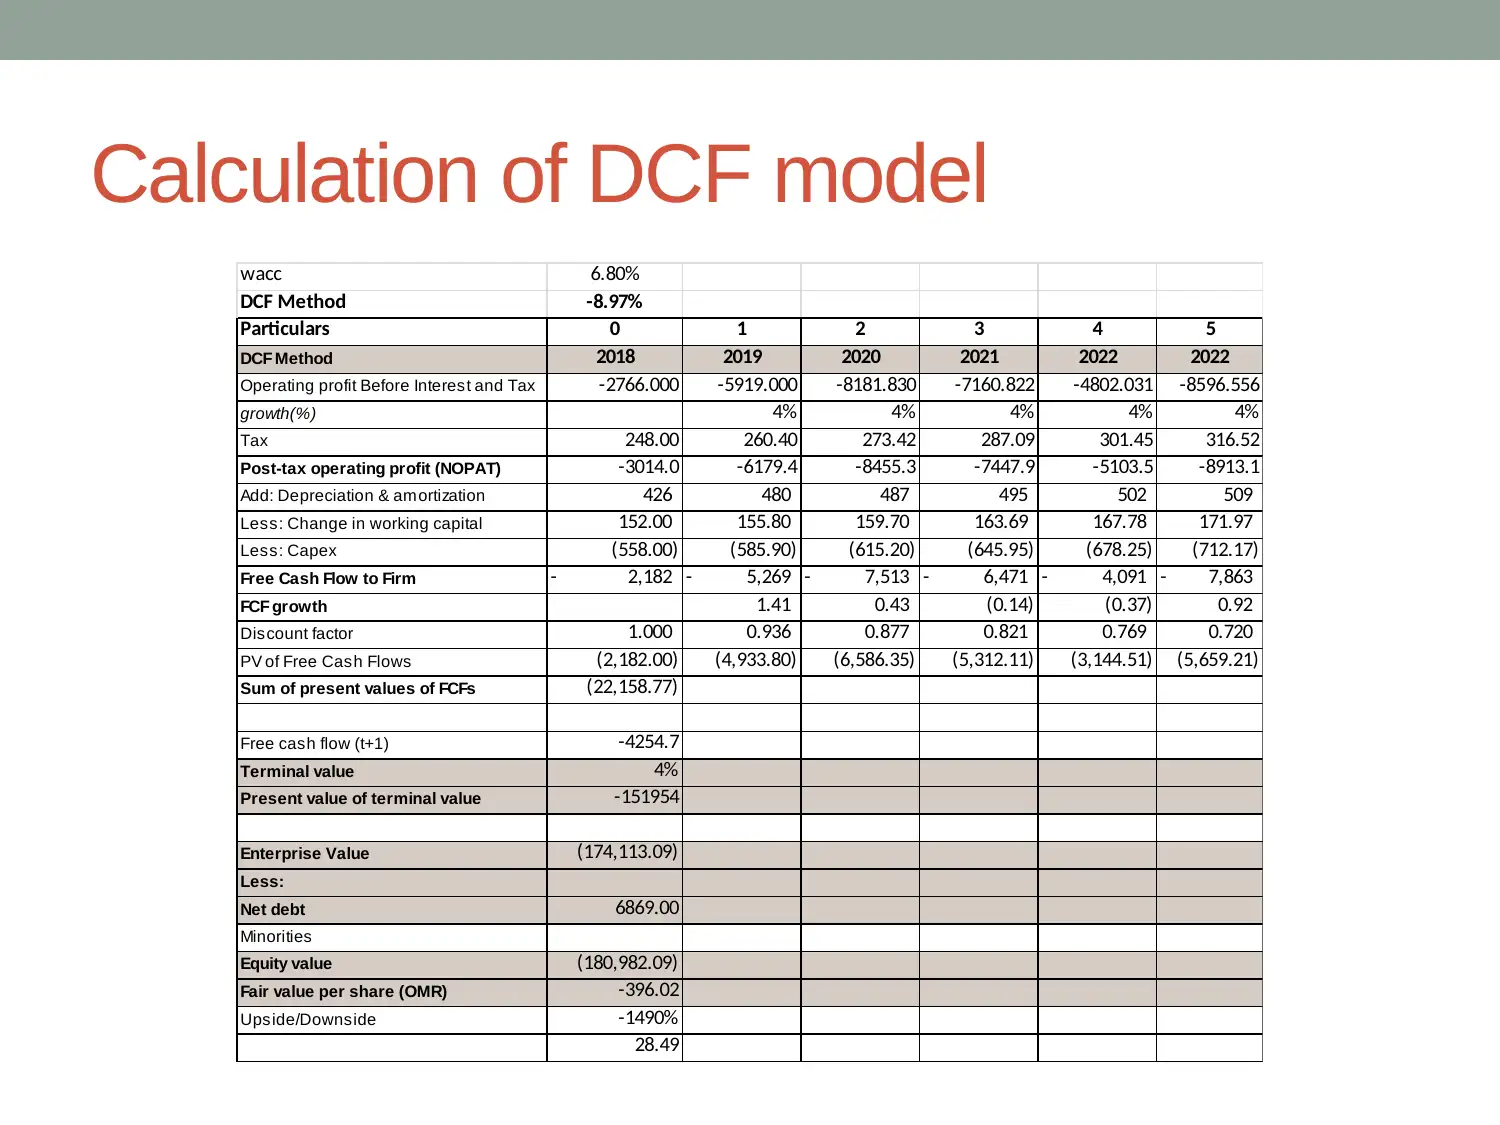
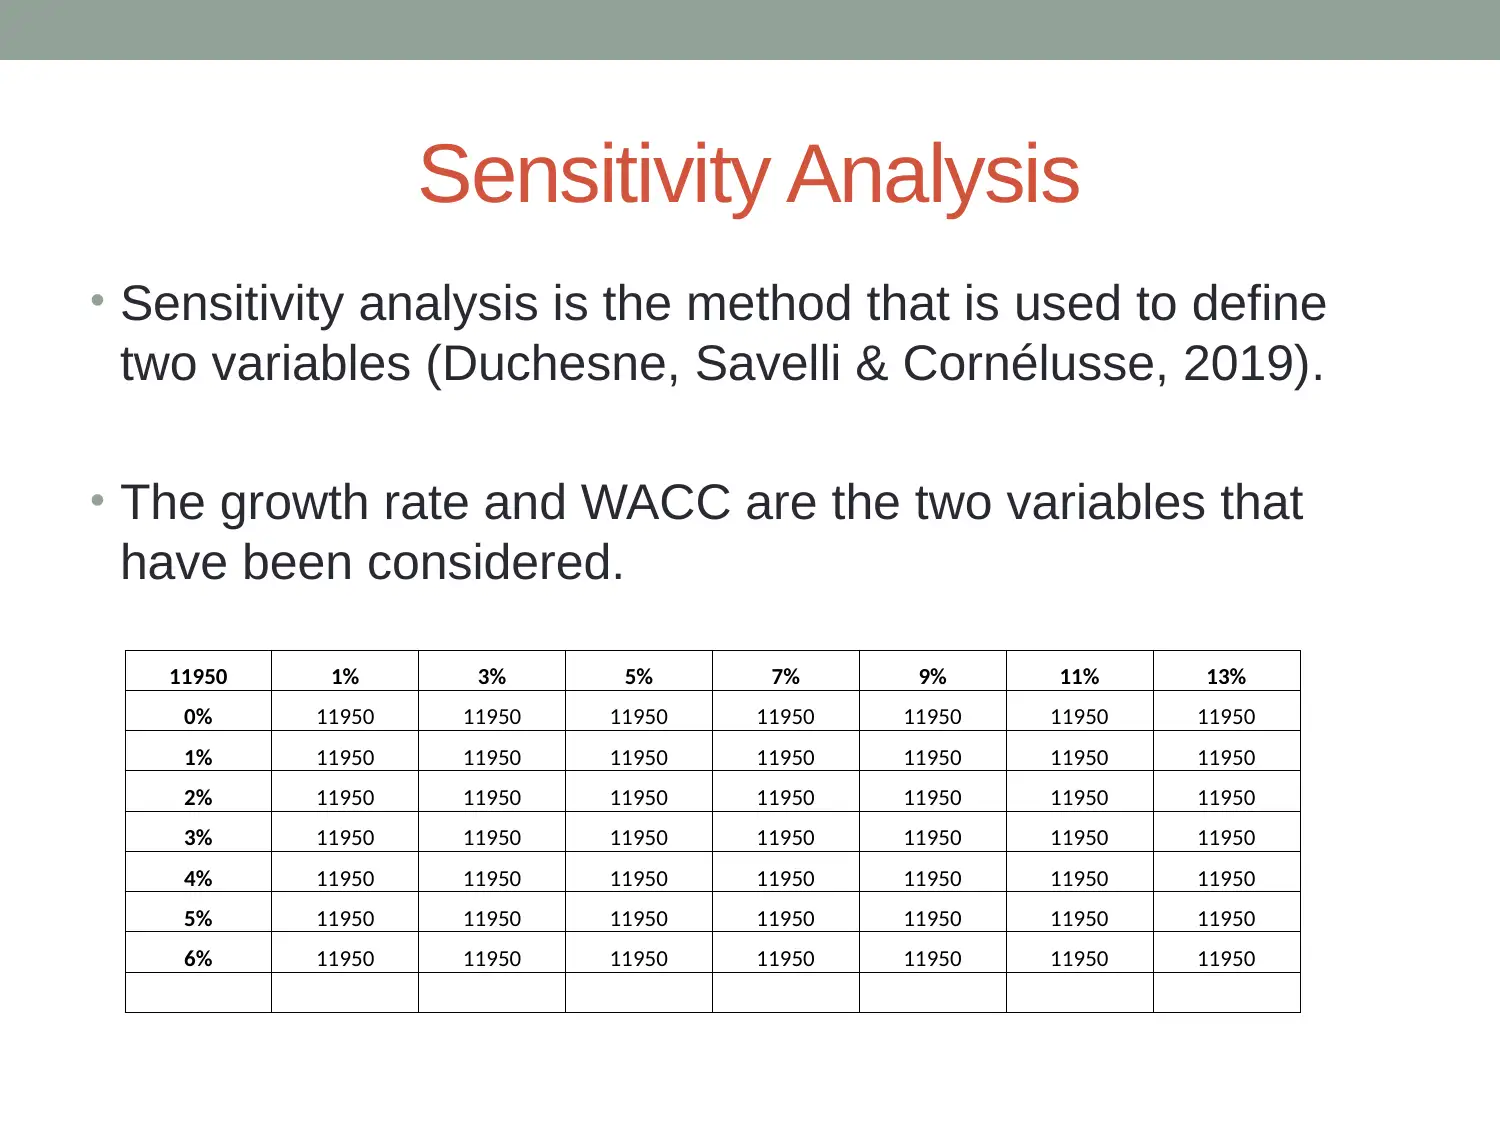
This project provides a comprehensive valuation analysis of Uber Technologies, employing a Discounted Cash Flow (DCF) model to determine its intrinsic value. The analysis utilizes historical data from Bloomberg to forecast future growth and profitability, including a 4% growth rate and adjustments for depreciation and capital expenditures. The DCF model calculates the present value and terminal value to arrive at free cash flows. The rationale behind using DCF is its effectiveness in valuing large, established firms and verifying share price characteristics, as other methods are deemed less reliable. The project calculates an intrinsic value of $21.38 per share, which is then compared to the market value, revealing a 25% overvaluation. The project also examines the historical beta coefficient as a risk measure and the Weighted Average Cost of Capital (WACC), which is calculated to be 6.80%. Sensitivity analysis is conducted using growth rate and WACC as variables. The conclusion suggests the DCF model is effective in identifying the intrinsic value but indicates that Uber's shares are overvalued based on the analysis. The project includes references to relevant academic papers and financial data sources to support its findings.
Document Page
UBER TECHNOLOGIES
Valuation
tabler-icon-diamond-filled.svg

Paraphrase This Document

Need a fresh take? Get an instant paraphrase of this document with our AI Paraphraser
Document Page
Introduction
Uber is an American based company.
It provides several services such as service hailing, food
delivery and micro mobility.
It can be used in two modes, application or online
website.
67% of market share can be observed in the market.
Document Page
5 year forecast steps
In order to make the forecast the data of Uber has been
taken from Bloomberg.
The growth rate has been 4% as per the history of Uber,
moreover, the opearting profits will move along the same
growth rate (Behr, Mielcarz & Osiichuk, 2018).
The depreciation and the capital expenditure adjustment
has been made.
To arrive at free cash flows the present value and the
terminal value.
Document Page
Rationale behind DCF
The rationale of DCF is, it is one of the best
measurements of valuing the share price.
Appropriate for large and steady firms
DCF model is implemented for verification of the
characteristic of share price.
Other methods of valuation do not seems to be authentic
an reliable.
tabler-icon-diamond-filled.svg

Paraphrase This Document

Need a fresh take? Get an instant paraphrase of this document with our AI Paraphraser
Document Page
Calculation of DCF model
wacc 6.80%
DCF Method -8.97%
Particulars 0 1 2 3 4 5
DCF Method 2018 2019 2020 2021 2022 2022
Operating profit Before Interest and Tax -2766.000 -5919.000 -8181.830 -7160.822 -4802.031 -8596.556
growth(%) 4% 4% 4% 4% 4%
Tax 248.00 260.40 273.42 287.09 301.45 316.52
Post-tax operating profit (NOPAT) -3014.0 -6179.4 -8455.3 -7447.9 -5103.5 -8913.1
Add: Depreciation & amortization 426 480 487 495 502 509
Less: Change in working capital 152.00 155.80 159.70 163.69 167.78 171.97
Less: Capex (558.00) (585.90) (615.20) (645.95) (678.25) (712.17)
Free Cash Flow to Firm 2,182- 5,269- 7,513- 6,471- 4,091- 7,863-
FCF growth 1.41 0.43 (0.14) (0.37) 0.92
Discount factor 1.000 0.936 0.877 0.821 0.769 0.720
PV of Free Cash Flows (2,182.00) (4,933.80) (6,586.35) (5,312.11) (3,144.51) (5,659.21)
Sum of present values of FCFs (22,158.77)
Free cash flow (t+1) -4254.7
Terminal value 4%
Present value of terminal value -151954
Enterprise Value (174,113.09)
Less:
Net debt 6869.00
Minorities
Equity value (180,982.09)
Fair value per share (OMR) -396.02
Upside/Downside -1490%
28.49
Document Page
Intrinsic value pre share
Intrinsic value is dependent on the internal factors
of the company.
The intrinsic value comes at $21.38 per share
The share price in comparison to the market
value is overvalued by 25% (Jennergren, 2019).
Intrinsic value is one of the major factor in
determining the value of share price.
Document Page
Historical Beta
Beta coefficient is a risk measure that is decides how risk
the share price is.
When beta is represented in the slope form, it shows how
it deviates from the market.
Fluctuates in comparison to the overall market.
It is a single factor model of asset price.
tabler-icon-diamond-filled.svg

Paraphrase This Document

Need a fresh take? Get an instant paraphrase of this document with our AI Paraphraser
Document Page
Weighted average cost of Capital
Weighted average cost of capital is commonly referred to
as WACC.
It is not affected by the management it is dictated by the
market value (Maadani & Motamedi, 2016).
WACC is a combination of the debt and the equity.
The current WACC of Uber technologies is 6.80%.
Document Page
Sensitivity Analysis
Sensitivity analysis is the method that is used to define
two variables (Duchesne, Savelli & Cornélusse, 2019).
The growth rate and WACC are the two variables that
have been considered.
11950 1% 3% 5% 7% 9% 11% 13%
0% 11950 11950 11950 11950 11950 11950 11950
1% 11950 11950 11950 11950 11950 11950 11950
2% 11950 11950 11950 11950 11950 11950 11950
3% 11950 11950 11950 11950 11950 11950 11950
4% 11950 11950 11950 11950 11950 11950 11950
5% 11950 11950 11950 11950 11950 11950 11950
6% 11950 11950 11950 11950 11950 11950 11950
Document Page
Conclusion
DCF Model is comparatively one of the best model to
identify the intrinsic value of the share.
The forecasted variables have been entered into the DCF
model.
The share of UBER has been overvalued.
tabler-icon-diamond-filled.svg

Paraphrase This Document

Need a fresh take? Get an instant paraphrase of this document with our AI Paraphraser
Document Page
References
Behr, A., Mielcarz, P., & Osiichuk, D. (2018). Terminal value calculation in dcf
valuation models: An empirical verification. e-Finanse: Financial Internet
Quarterly, 14(1), 27-38.
Chua, G. A., & Liu, Y. (2019). Sensitivity analysis on responsive pricing and
production under imperfect demand updating. Naval Research Logistics
(NRL), 66(7), 529-546.
Drabikova, E., & Svetlik, J. (2018). SENSITIVITY ANALYSIS APPLICATION IN
THE COMPANY VALUATION: THE CASE OF DISCOUNTED CASH FLOW
METHOD. Ad Alta: Journal of Interdisciplinary Research, 8(1).
Duchesne, L., Savelli, I., & Cornélusse, B. (2019). Sensitivity Analysis of a Local
Market Model for Community Microgrids. PowerTech Milano 2019 Proceedings.
Jennergren, P. (2019). Calibration of DCF valuation in litigation: The case of
HQ (No. 2019: 2). Stockholm School of Economics.
Maadani, M., & Motamedi, S. A. (2016). A comprehensive DCF performance
analysis in noisy industrial wireless networks. International Journal of
Communication Systems, 29(11), 1720-1739.
chevron_up_icon
1 out of 11
circle_padding
hide_on_mobile
zoom_out_icon
[object Object]