Comprehensive Statistical Report on Ulcerative Colitis Data
VerifiedAdded on 2023/04/24
|16
|3173
|213
Report
AI Summary
This report assesses ulcerative colitis (UC) data through hypothesis testing using R. It examines age and gender compositions between control and UC patients, the relationship between gender and disease site in UC patients, and age differences between male and female UC patients. Furthermore, the report analyzes gene expression levels in involved tissues among UC patients in remission, active UC patients, and control patients, as well as comparing gene expressions between involved and non-involved tissues. The analysis employs t-tests and chi-square tests to evaluate various null hypotheses, providing statistical conclusions based on p-values and significance levels. The R code used for the analysis is included in the appendix.
Contribute Materials
Your contribution can guide someone’s learning journey. Share your
documents today.

Ulcerative Colitis Data 1
ASSESSMENT OF ULCERATIVE COLITIS DATA
By (Name)
The Name of the Class (Course)
Professor (Tutor)
The Name of the School (University)
The City and State where it is located
The Date
ASSESSMENT OF ULCERATIVE COLITIS DATA
By (Name)
The Name of the Class (Course)
Professor (Tutor)
The Name of the School (University)
The City and State where it is located
The Date
Secure Best Marks with AI Grader
Need help grading? Try our AI Grader for instant feedback on your assignments.
Ulcerative Colitis Data 2
Assessment of Ulcerative Colitis Data
Section 1
Part (a)
Hypothesis
Null hypothesis (H0): The age of patients with regard to Control and UC is the same i.e. μ1=μ2
Alternative Hypothesis (H1): The age of patients with regard to Control and UC is different i.e.
μ1 ≠ μ2
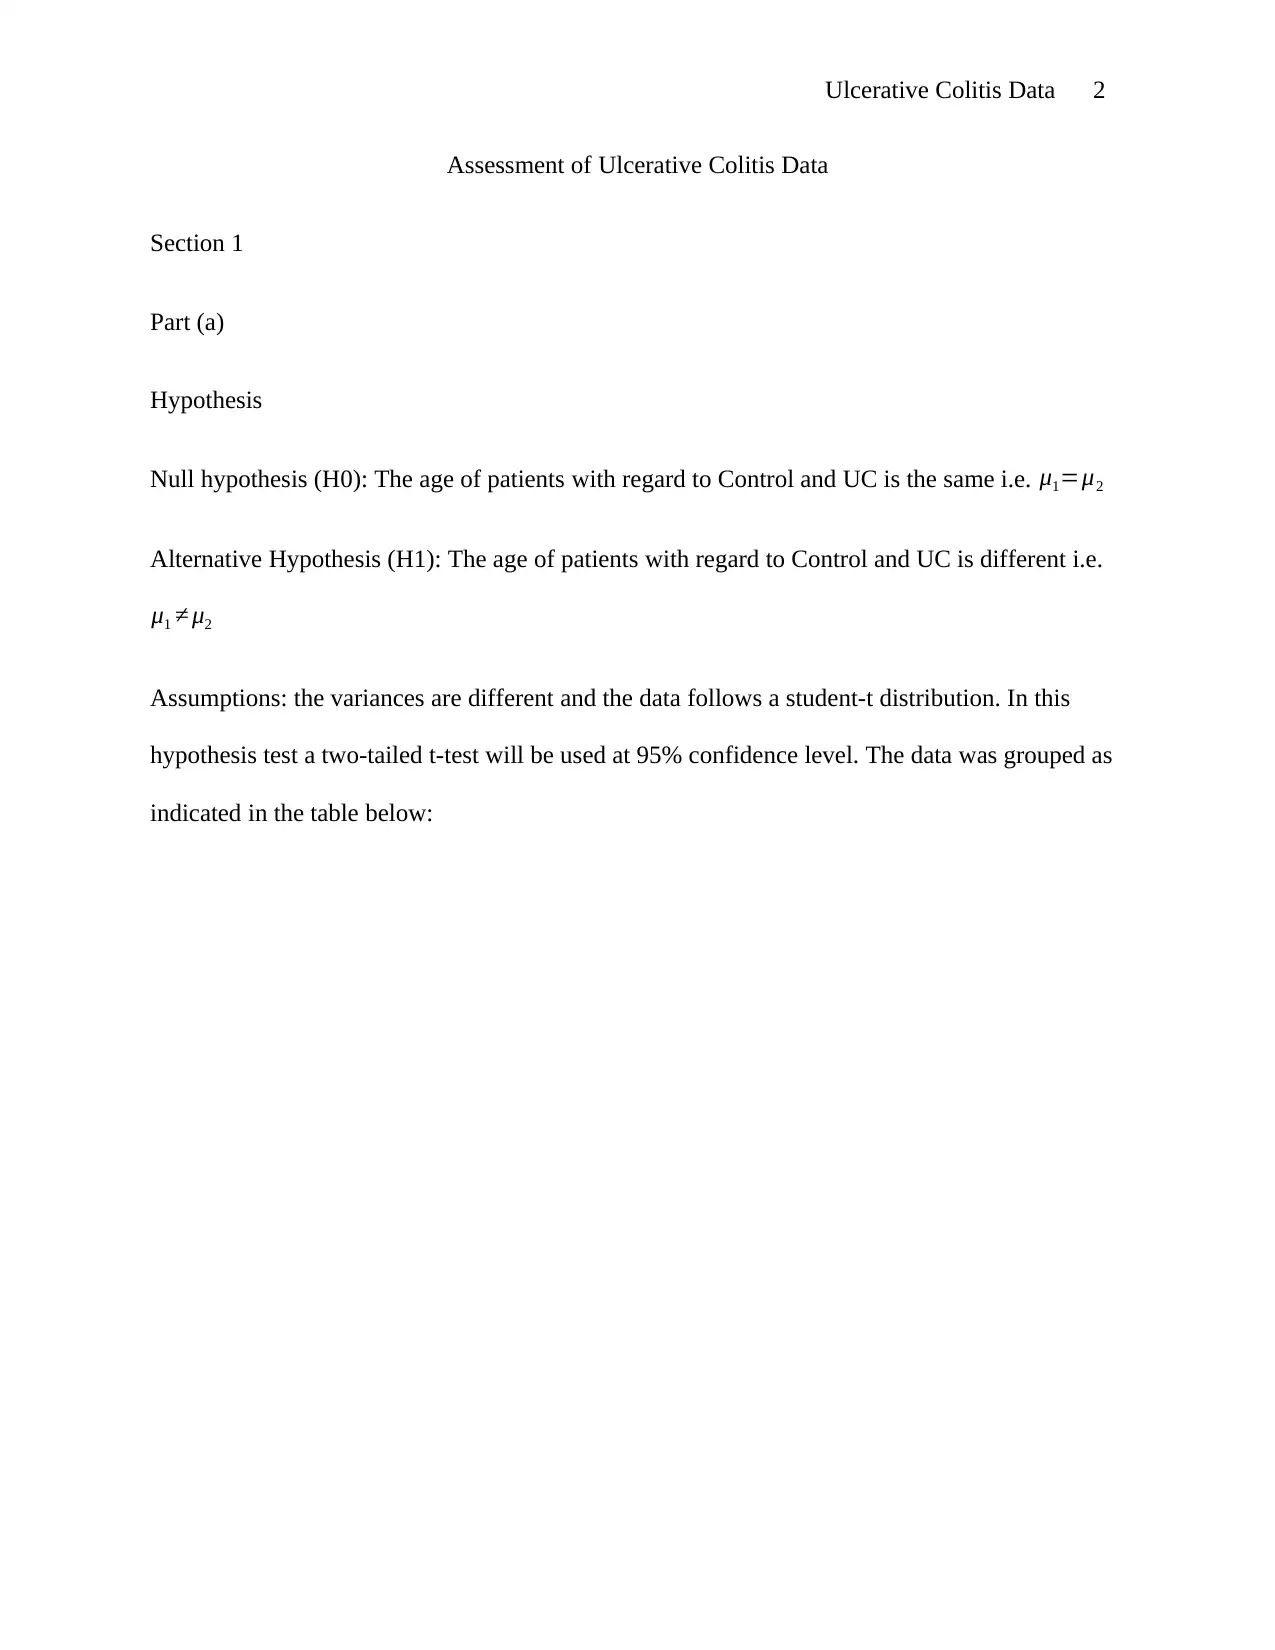
Assumptions: the variances are different and the data follows a student-t distribution. In this
hypothesis test a two-tailed t-test will be used at 95% confidence level. The data was grouped as
indicated in the table below:
Assessment of Ulcerative Colitis Data
Section 1
Part (a)
Hypothesis
Null hypothesis (H0): The age of patients with regard to Control and UC is the same i.e. μ1=μ2
Alternative Hypothesis (H1): The age of patients with regard to Control and UC is different i.e.
μ1 ≠ μ2
Assumptions: the variances are different and the data follows a student-t distribution. In this
hypothesis test a two-tailed t-test will be used at 95% confidence level. The data was grouped as
indicated in the table below:
Ulcerative Colitis Data 3
Control UC
20 40
30 60
41 63
45 36
60 60
55 40
36 41
54 47
22 34
38 43
50 36
40 30
50 41
34
62
46
50
53
33
34
39
58
51
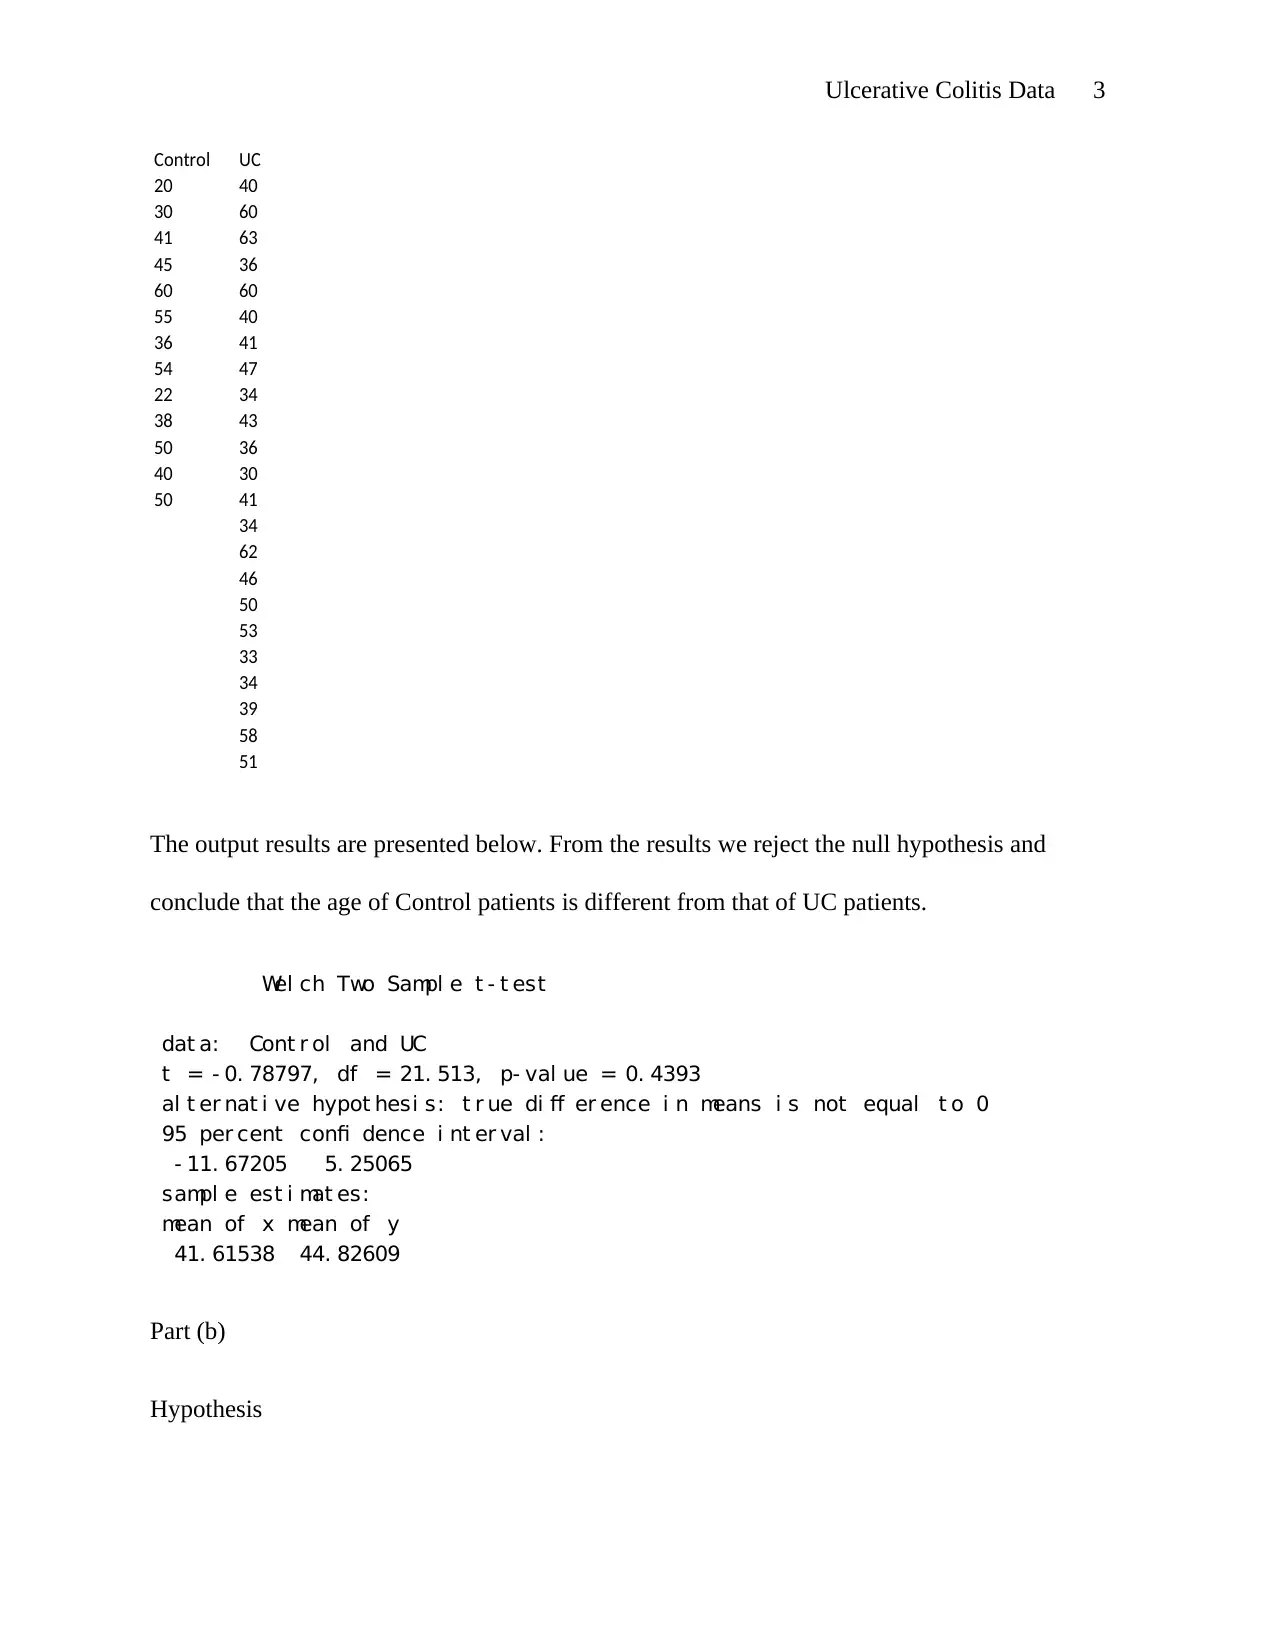
The output results are presented below. From the results we reject the null hypothesis and
conclude that the age of Control patients is different from that of UC patients.
Wel ch Two Sampl e t - t est
dat a: Cont r ol and UC
t = - 0. 78797, df = 21. 513, p- val ue = 0. 4393
al t er nat i ve hypot hesi s: t r ue di ff er ence i n means i s not equal t o 0
95 per cent confi dence i nt er val :
- 11. 67205 5. 25065
sampl e est i mat es:
mean of x mean of y
41. 61538 44. 82609
Part (b)
Hypothesis
Control UC
20 40
30 60
41 63
45 36
60 60
55 40
36 41
54 47
22 34
38 43
50 36
40 30
50 41
34
62
46
50
53
33
34
39
58
51
The output results are presented below. From the results we reject the null hypothesis and
conclude that the age of Control patients is different from that of UC patients.
Wel ch Two Sampl e t - t est
dat a: Cont r ol and UC
t = - 0. 78797, df = 21. 513, p- val ue = 0. 4393
al t er nat i ve hypot hesi s: t r ue di ff er ence i n means i s not equal t o 0
95 per cent confi dence i nt er val :
- 11. 67205 5. 25065
sampl e est i mat es:
mean of x mean of y
41. 61538 44. 82609
Part (b)
Hypothesis
Ulcerative Colitis Data 4
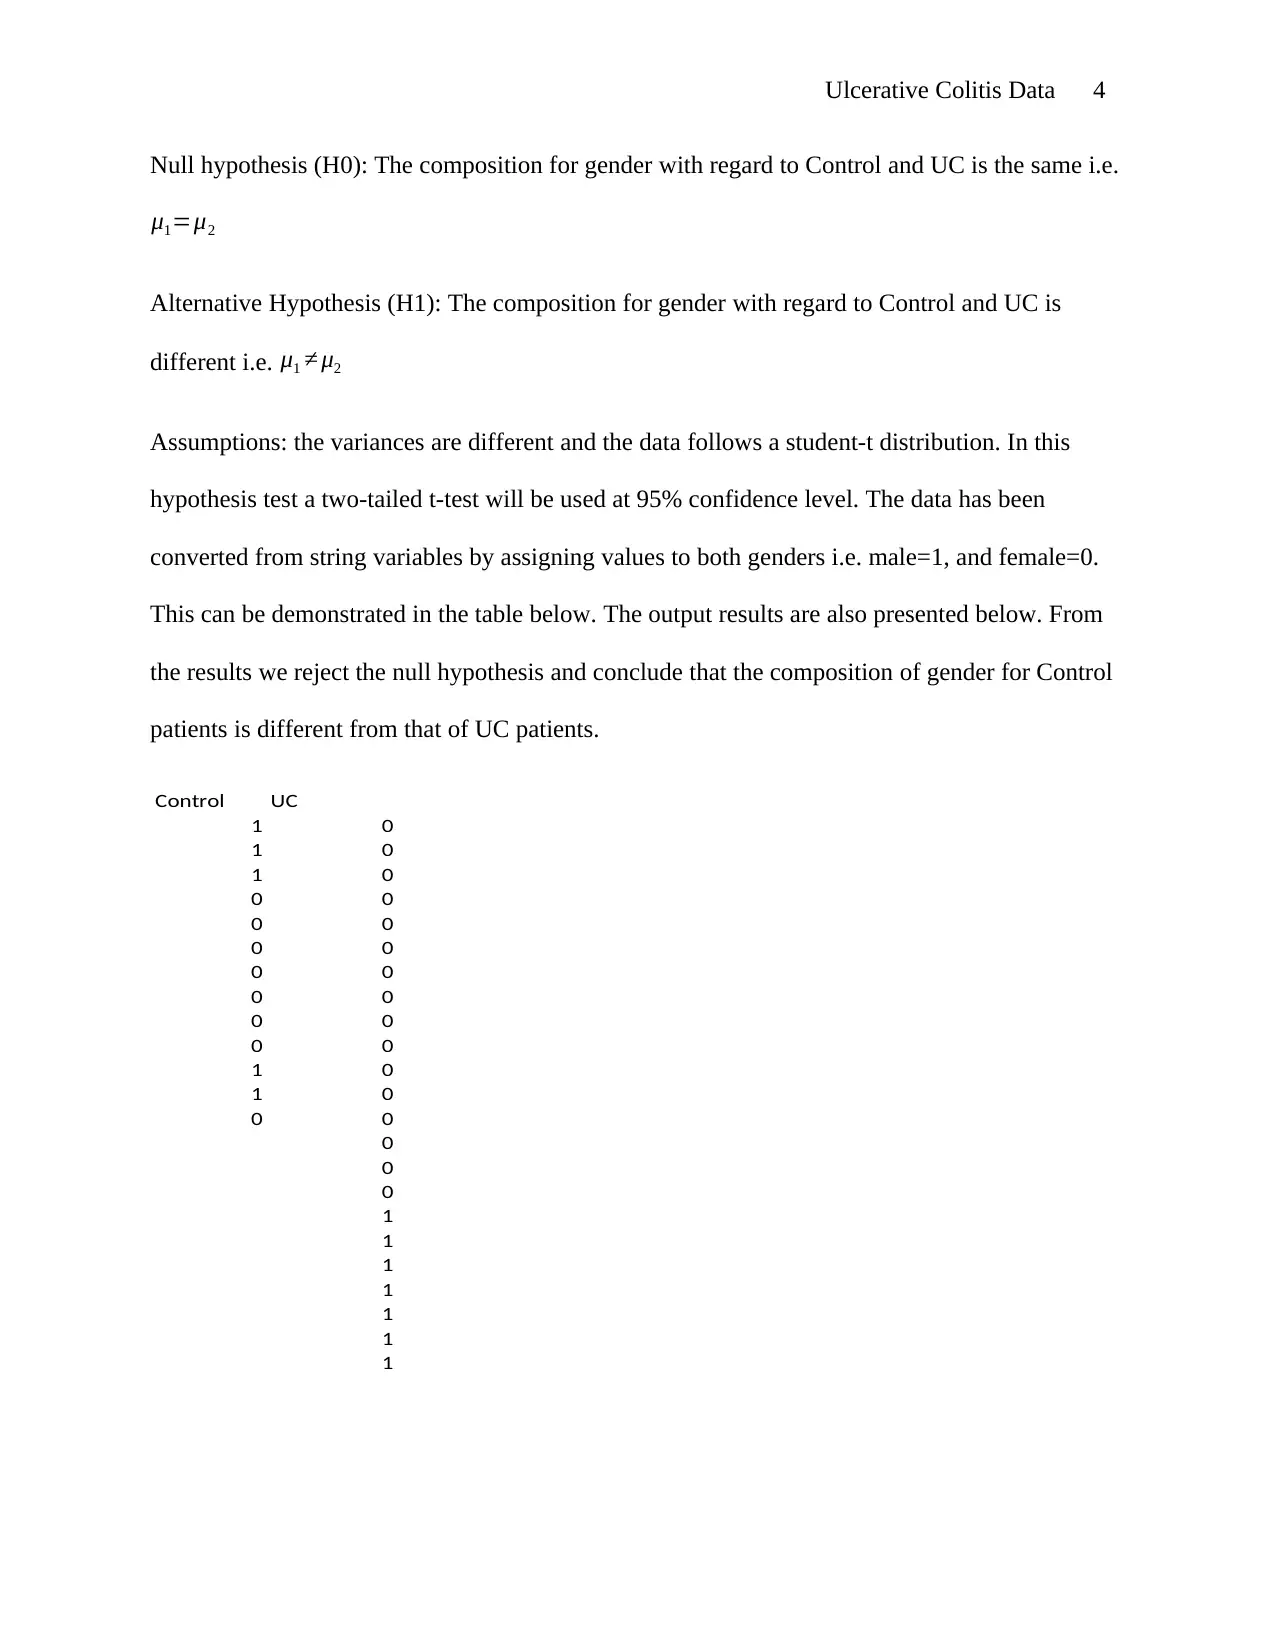
Null hypothesis (H0): The composition for gender with regard to Control and UC is the same i.e.
μ1=μ2
Alternative Hypothesis (H1): The composition for gender with regard to Control and UC is
different i.e. μ1 ≠ μ2
Assumptions: the variances are different and the data follows a student-t distribution. In this
hypothesis test a two-tailed t-test will be used at 95% confidence level. The data has been
converted from string variables by assigning values to both genders i.e. male=1, and female=0.
This can be demonstrated in the table below. The output results are also presented below. From
the results we reject the null hypothesis and conclude that the composition of gender for Control
patients is different from that of UC patients.
Control UC
1 0
1 0
1 0
0 0
0 0
0 0
0 0
0 0
0 0
0 0
1 0
1 0
0 0
0
0
0
1
1
1
1
1
1
1
Secure Best Marks with AI Grader
Need help grading? Try our AI Grader for instant feedback on your assignments.
Ulcerative Colitis Data 5
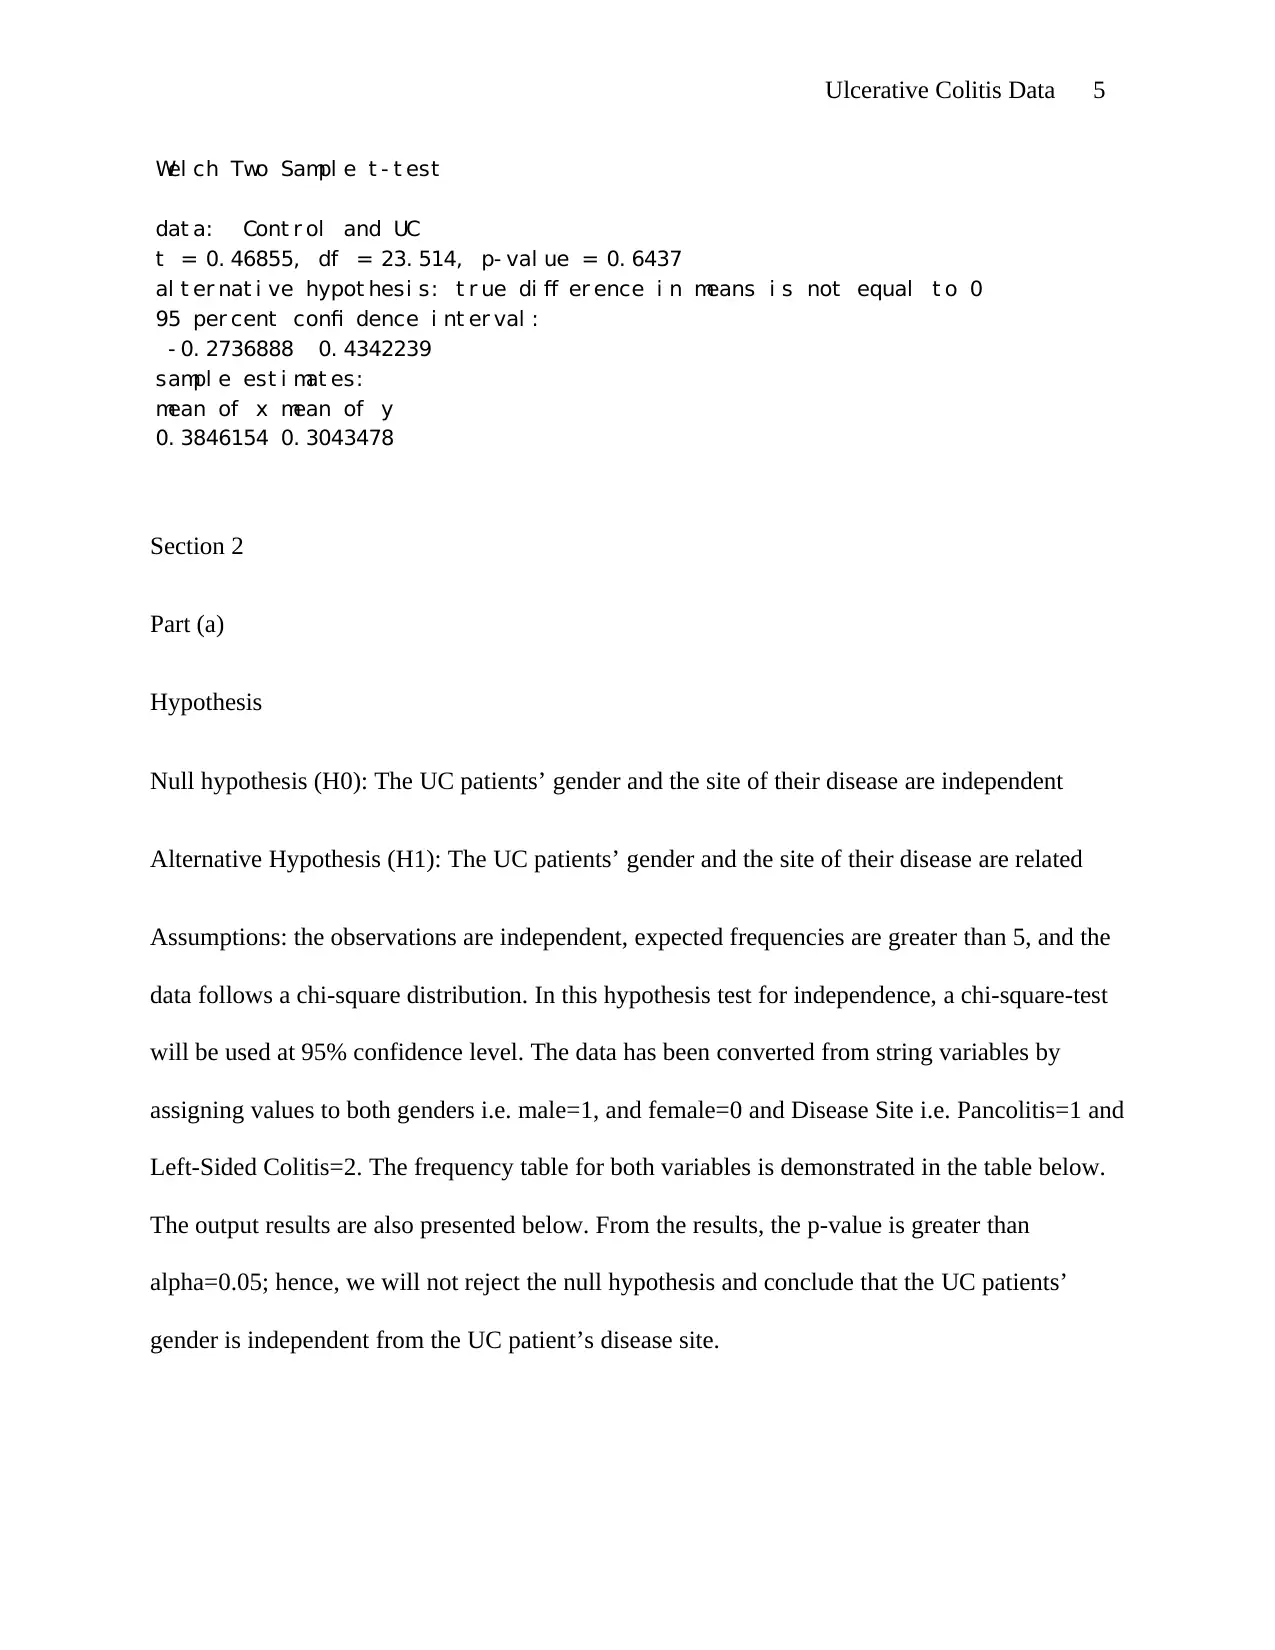
Wel ch Two Sampl e t - t est
dat a: Cont r ol and UC
t = 0. 46855, df = 23. 514, p- val ue = 0. 6437
al t er nat i ve hypot hesi s: t r ue di ff er ence i n means i s not equal t o 0
95 per cent confi dence i nt er val :
- 0. 2736888 0. 4342239
sampl e est i mat es:
mean of x mean of y
0. 3846154 0. 3043478
Section 2
Part (a)
Hypothesis
Null hypothesis (H0): The UC patients’ gender and the site of their disease are independent
Alternative Hypothesis (H1): The UC patients’ gender and the site of their disease are related
Assumptions: the observations are independent, expected frequencies are greater than 5, and the
data follows a chi-square distribution. In this hypothesis test for independence, a chi-square-test
will be used at 95% confidence level. The data has been converted from string variables by
assigning values to both genders i.e. male=1, and female=0 and Disease Site i.e. Pancolitis=1 and
Left-Sided Colitis=2. The frequency table for both variables is demonstrated in the table below.
The output results are also presented below. From the results, the p-value is greater than
alpha=0.05; hence, we will not reject the null hypothesis and conclude that the UC patients’
gender is independent from the UC patient’s disease site.
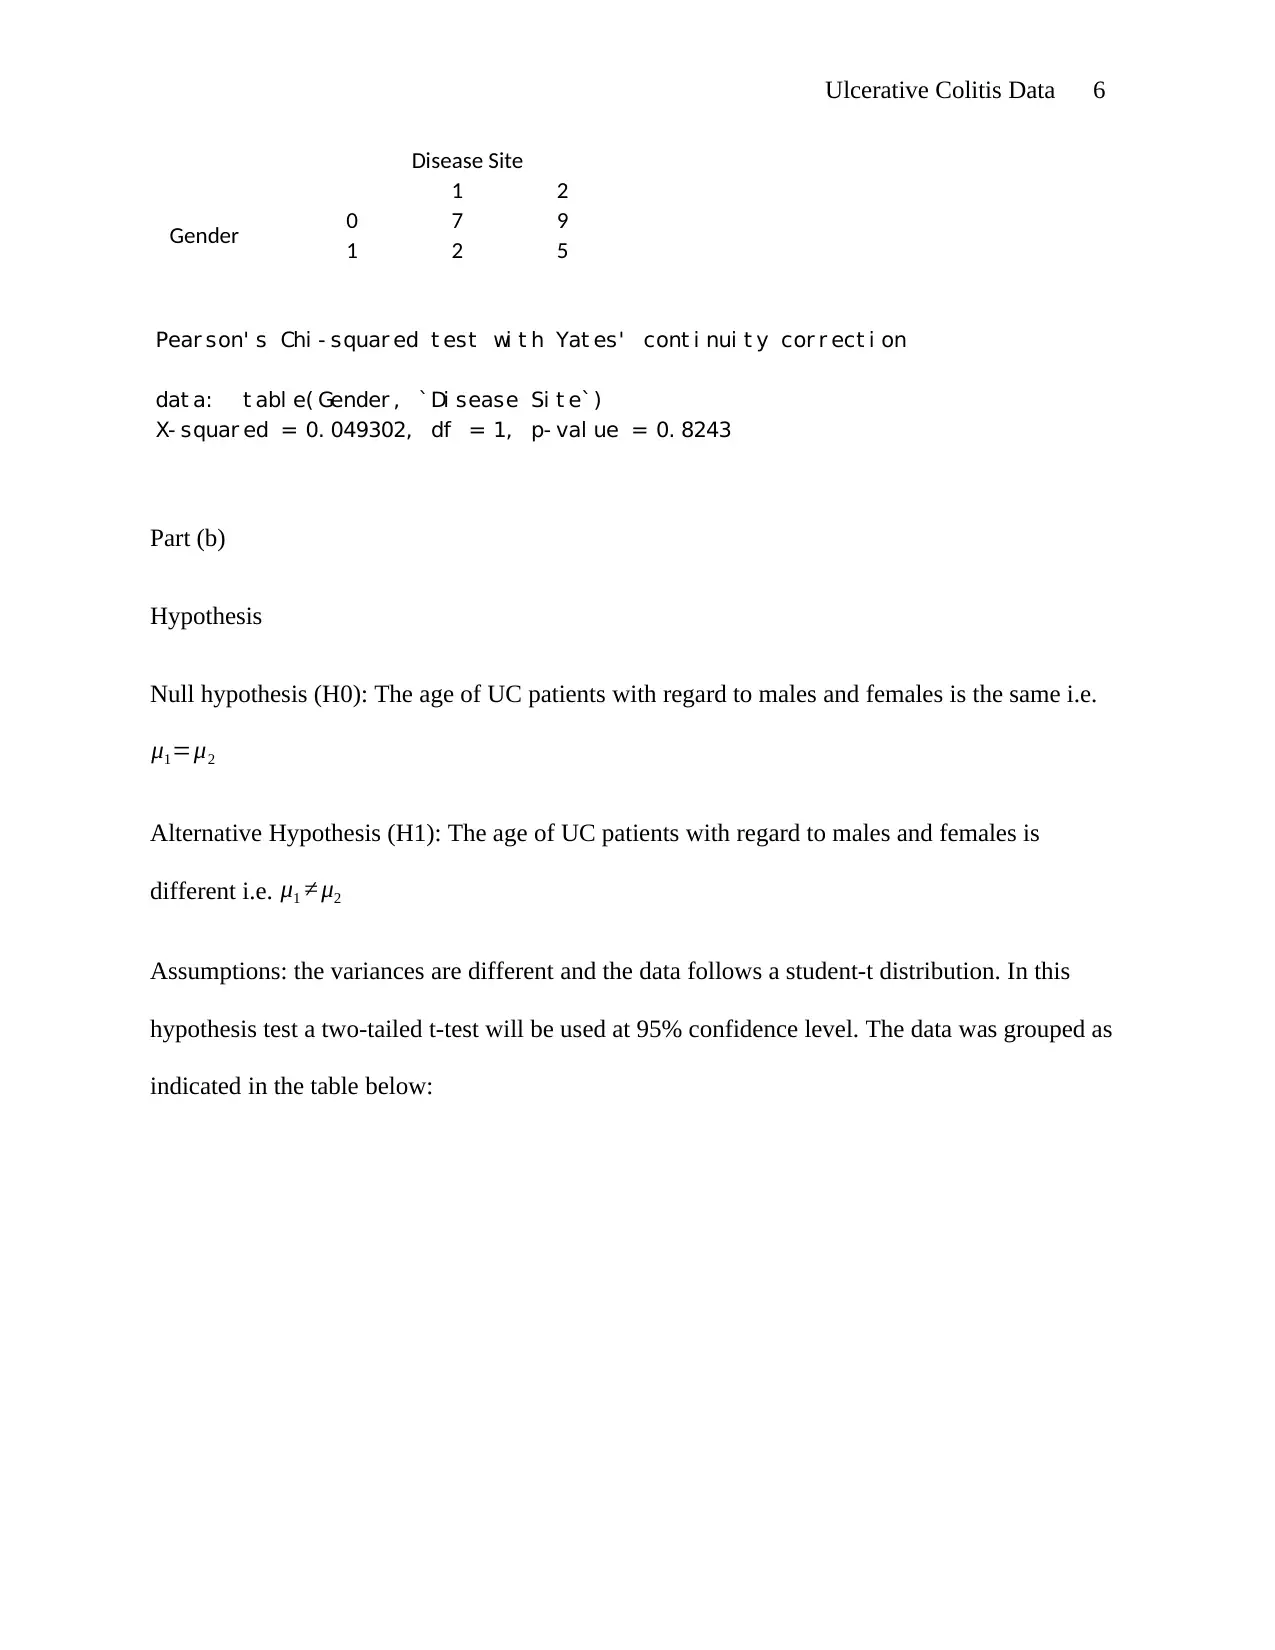
Ulcerative Colitis Data 6
1 2
0 7 9
1 2 5
Disease Site
Gender
Pear son' s Chi - squar ed t est wi t h Yat es' cont i nui t y cor r ect i on
dat a: t abl e( Gender , ` Di sease Si t e`)
X- squar ed = 0. 049302, df = 1, p- val ue = 0. 8243
Part (b)
Hypothesis
Null hypothesis (H0): The age of UC patients with regard to males and females is the same i.e.
μ1=μ2
Alternative Hypothesis (H1): The age of UC patients with regard to males and females is
different i.e. μ1 ≠ μ2
Assumptions: the variances are different and the data follows a student-t distribution. In this
hypothesis test a two-tailed t-test will be used at 95% confidence level. The data was grouped as
indicated in the table below:
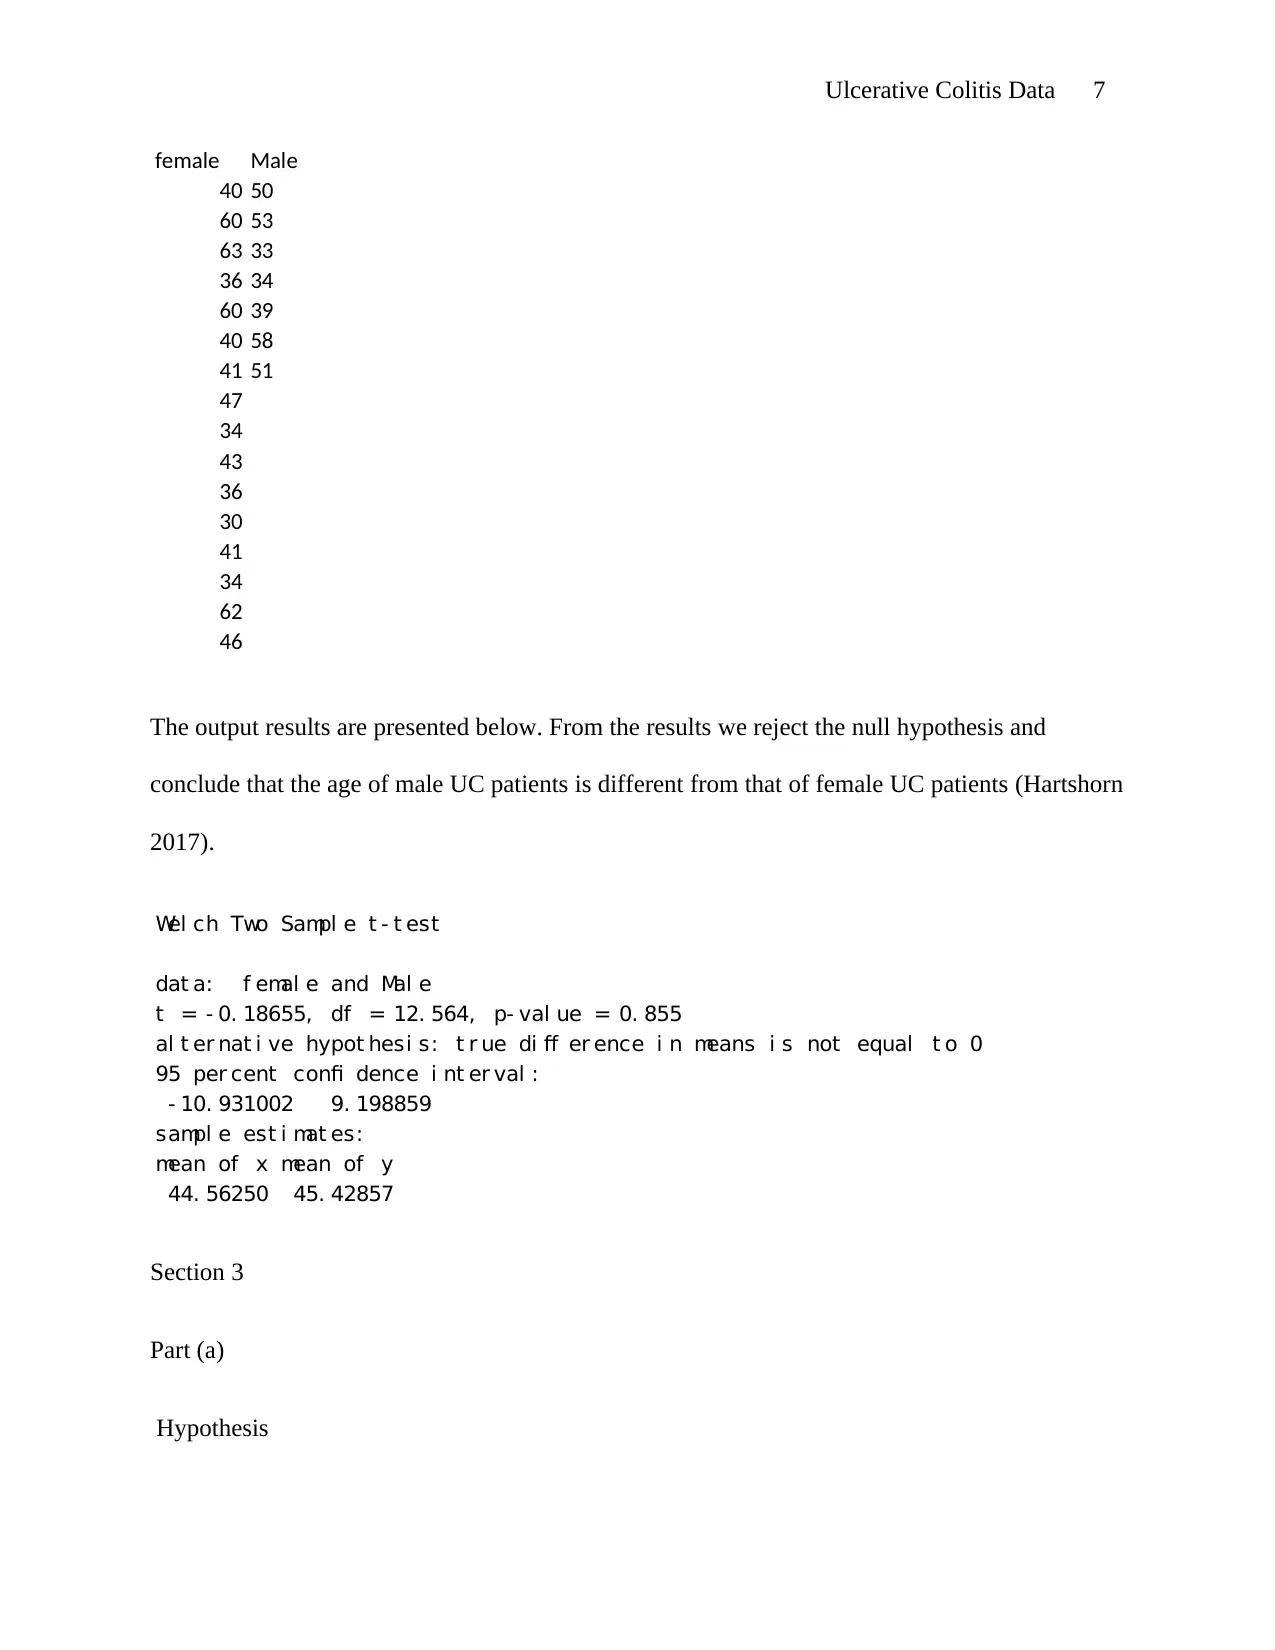
Ulcerative Colitis Data 7
female Male
40 50
60 53
63 33
36 34
60 39
40 58
41 51
47
34
43
36
30
41
34
62
46
The output results are presented below. From the results we reject the null hypothesis and
conclude that the age of male UC patients is different from that of female UC patients (Hartshorn
2017).
Wel ch Two Sampl e t - t est
dat a: f emal e and Mal e
t = - 0. 18655, df = 12. 564, p- val ue = 0. 855
al t er nat i ve hypot hesi s: t r ue di ff er ence i n means i s not equal t o 0
95 per cent confi dence i nt er val :
- 10. 931002 9. 198859
sampl e est i mat es:
mean of x mean of y
44. 56250 45. 42857
Section 3
Part (a)
Hypothesis
Paraphrase This Document
Need a fresh take? Get an instant paraphrase of this document with our AI Paraphraser
Ulcerative Colitis Data 8
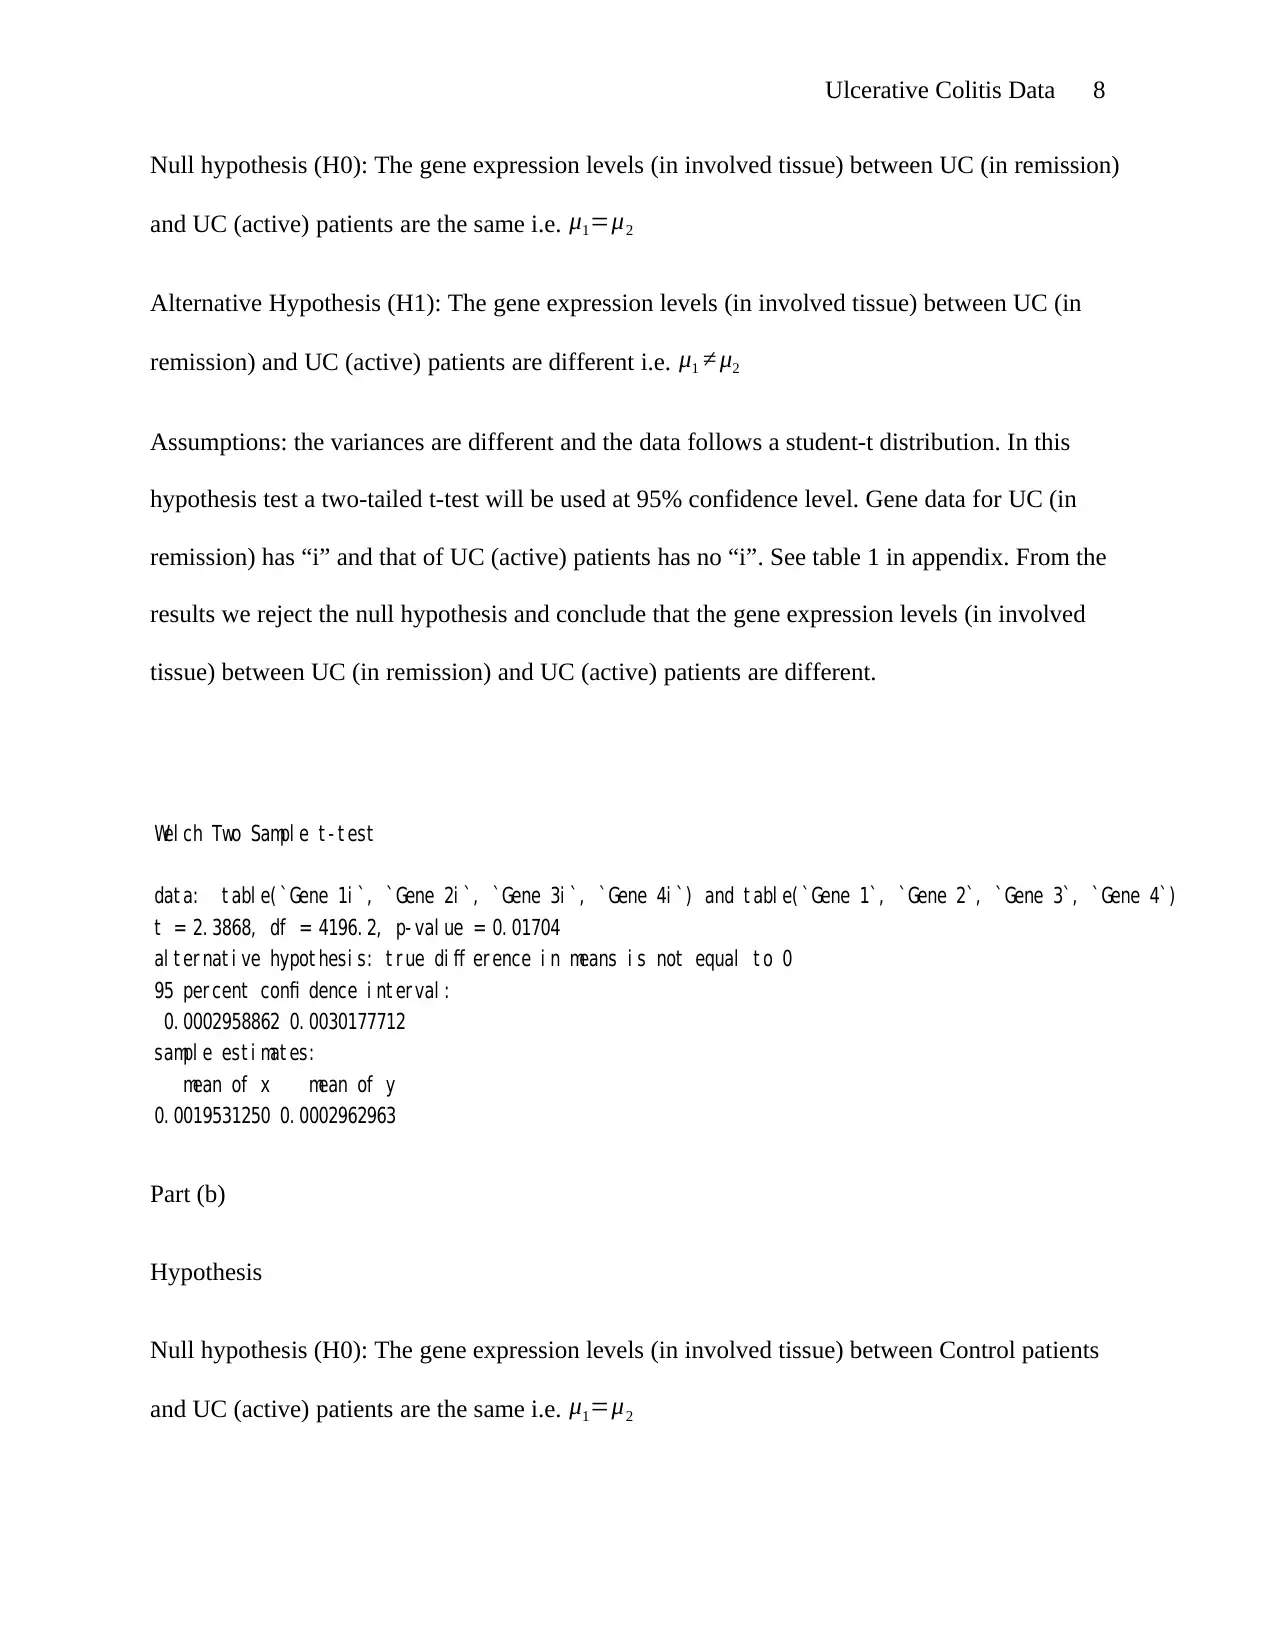
Null hypothesis (H0): The gene expression levels (in involved tissue) between UC (in remission)
and UC (active) patients are the same i.e. μ1=μ2
Alternative Hypothesis (H1): The gene expression levels (in involved tissue) between UC (in
remission) and UC (active) patients are different i.e. μ1 ≠ μ2
Assumptions: the variances are different and the data follows a student-t distribution. In this
hypothesis test a two-tailed t-test will be used at 95% confidence level. Gene data for UC (in
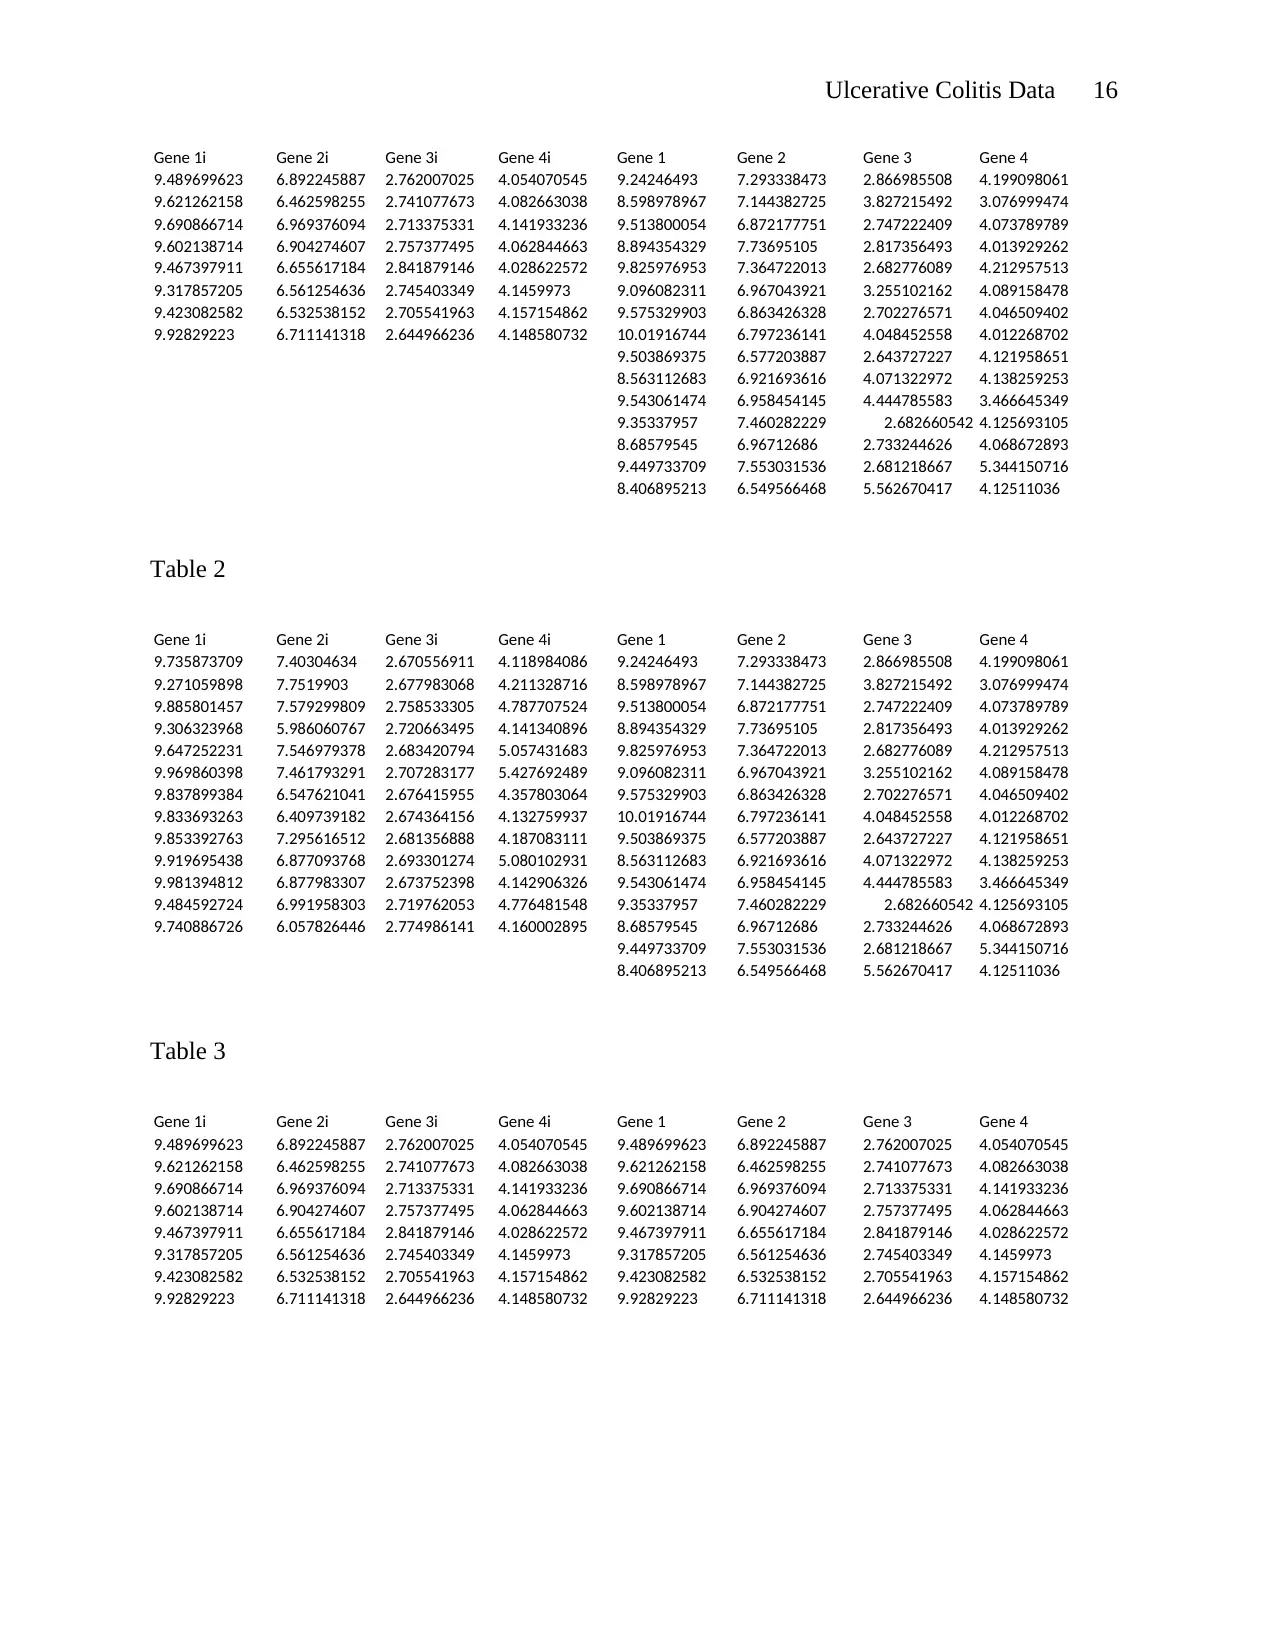
remission) has “i” and that of UC (active) patients has no “i”. See table 1 in appendix. From the
results we reject the null hypothesis and conclude that the gene expression levels (in involved
tissue) between UC (in remission) and UC (active) patients are different.
Wel ch Two Sampl e t - t est
dat a: t abl e( ` Gene 1i `, ` Gene 2i `, `Gene 3i ` , `Gene 4i `) and t abl e( `Gene 1`, `Gene 2`, ` Gene 3` , `Gene 4`)
t = 2. 3868, df = 4196. 2, p- val ue = 0. 01704
al t er nat i ve hypot hesi s: t r ue di ff er ence i n means i s not equal t o 0
95 per cent confi dence i nt er val :
0. 0002958862 0. 0030177712
sampl e est i mat es:
mean of x mean of y
0. 0019531250 0. 0002962963
Part (b)
Hypothesis
Null hypothesis (H0): The gene expression levels (in involved tissue) between Control patients
and UC (active) patients are the same i.e. μ1=μ2
Null hypothesis (H0): The gene expression levels (in involved tissue) between UC (in remission)
and UC (active) patients are the same i.e. μ1=μ2
Alternative Hypothesis (H1): The gene expression levels (in involved tissue) between UC (in
remission) and UC (active) patients are different i.e. μ1 ≠ μ2
Assumptions: the variances are different and the data follows a student-t distribution. In this
hypothesis test a two-tailed t-test will be used at 95% confidence level. Gene data for UC (in
remission) has “i” and that of UC (active) patients has no “i”. See table 1 in appendix. From the
results we reject the null hypothesis and conclude that the gene expression levels (in involved
tissue) between UC (in remission) and UC (active) patients are different.
Wel ch Two Sampl e t - t est
dat a: t abl e( ` Gene 1i `, ` Gene 2i `, `Gene 3i ` , `Gene 4i `) and t abl e( `Gene 1`, `Gene 2`, ` Gene 3` , `Gene 4`)
t = 2. 3868, df = 4196. 2, p- val ue = 0. 01704
al t er nat i ve hypot hesi s: t r ue di ff er ence i n means i s not equal t o 0
95 per cent confi dence i nt er val :
0. 0002958862 0. 0030177712
sampl e est i mat es:
mean of x mean of y
0. 0019531250 0. 0002962963
Part (b)
Hypothesis
Null hypothesis (H0): The gene expression levels (in involved tissue) between Control patients
and UC (active) patients are the same i.e. μ1=μ2
Ulcerative Colitis Data 9
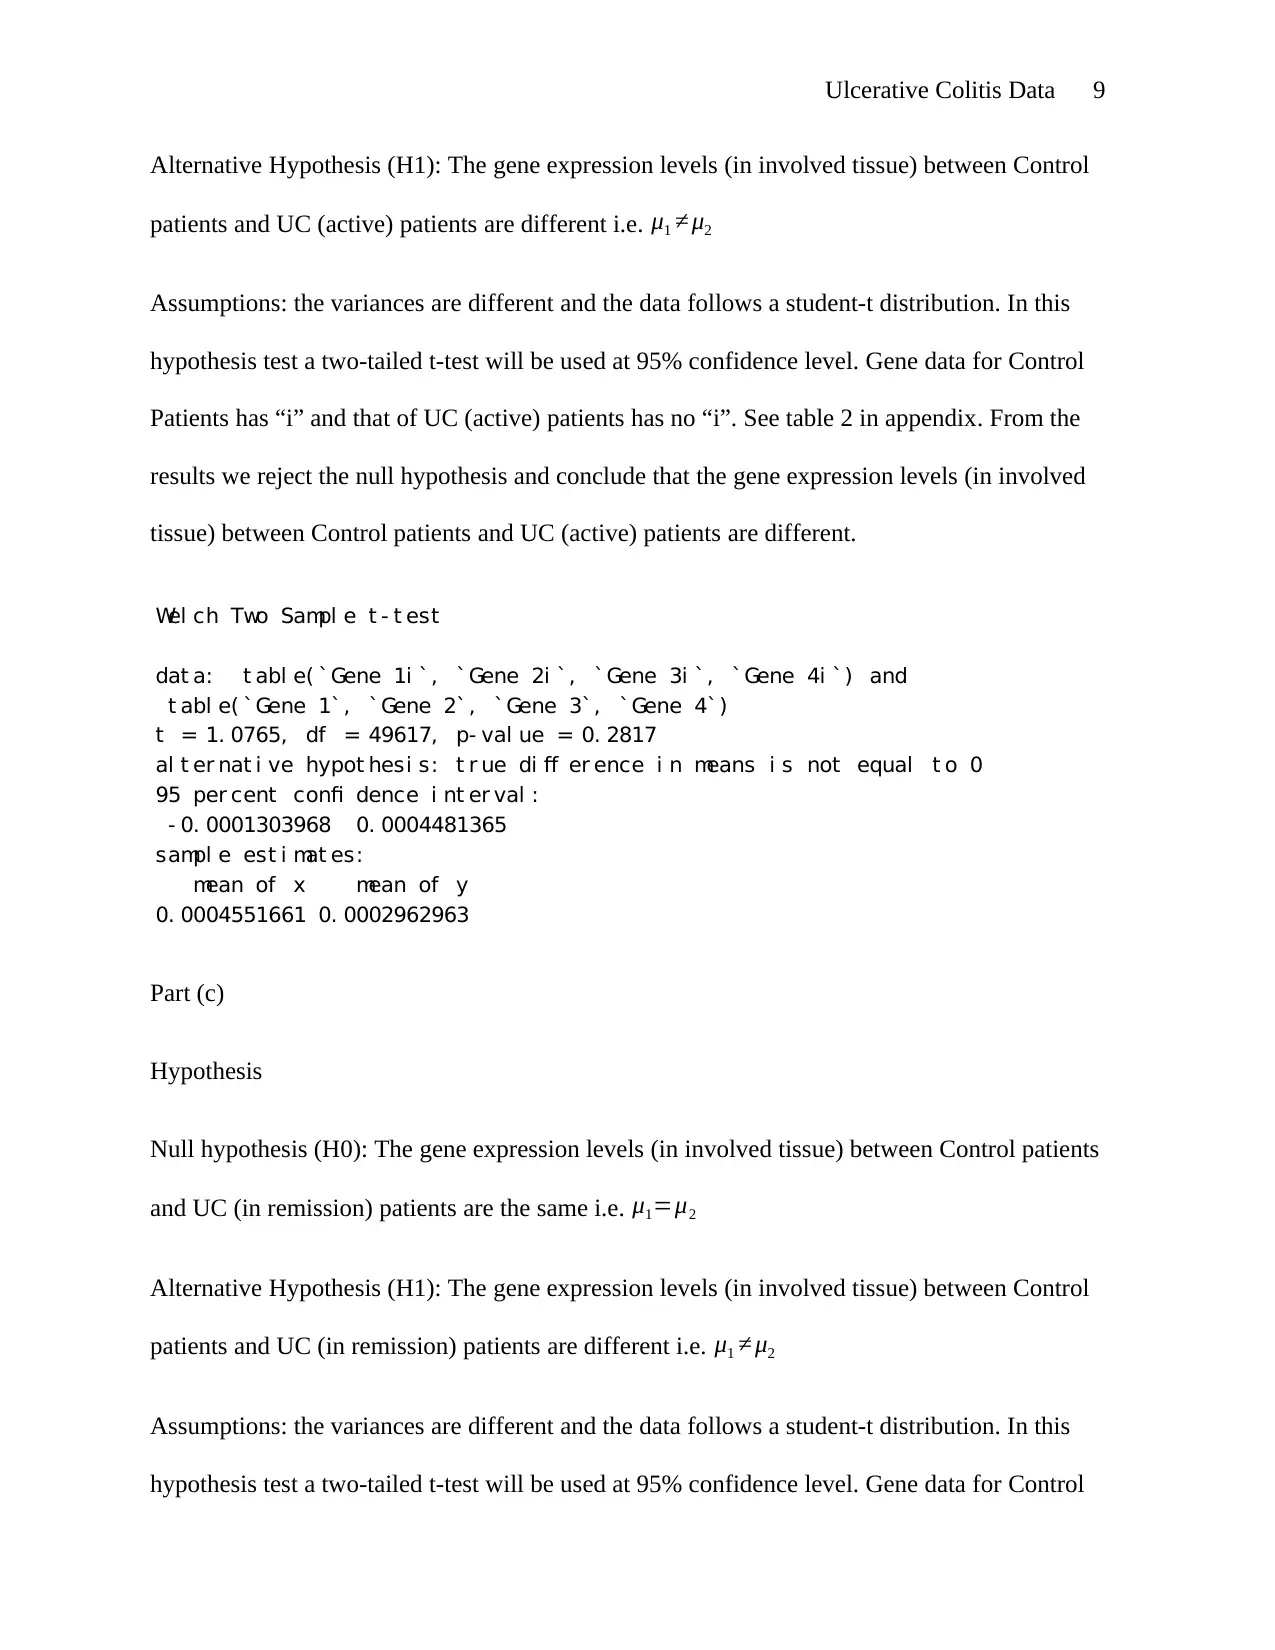
Alternative Hypothesis (H1): The gene expression levels (in involved tissue) between Control
patients and UC (active) patients are different i.e. μ1 ≠ μ2
Assumptions: the variances are different and the data follows a student-t distribution. In this
hypothesis test a two-tailed t-test will be used at 95% confidence level. Gene data for Control
Patients has “i” and that of UC (active) patients has no “i”. See table 2 in appendix. From the
results we reject the null hypothesis and conclude that the gene expression levels (in involved
tissue) between Control patients and UC (active) patients are different.
Wel ch Two Sampl e t - t est
dat a: t abl e( `Gene 1i `, ` Gene 2i `, ` Gene 3i `, ` Gene 4i `) and
t abl e( `Gene 1` , `Gene 2` , `Gene 3`, `Gene 4`)
t = 1. 0765, df = 49617, p- val ue = 0. 2817
al t er nat i ve hypot hesi s: t r ue di ff er ence i n means i s not equal t o 0
95 per cent confi dence i nt er val :
- 0. 0001303968 0. 0004481365
sampl e est i mat es:
mean of x mean of y
0. 0004551661 0. 0002962963
Part (c)
Hypothesis
Null hypothesis (H0): The gene expression levels (in involved tissue) between Control patients
and UC (in remission) patients are the same i.e. μ1=μ2
Alternative Hypothesis (H1): The gene expression levels (in involved tissue) between Control
patients and UC (in remission) patients are different i.e. μ1 ≠ μ2
Assumptions: the variances are different and the data follows a student-t distribution. In this
hypothesis test a two-tailed t-test will be used at 95% confidence level. Gene data for Control
Alternative Hypothesis (H1): The gene expression levels (in involved tissue) between Control
patients and UC (active) patients are different i.e. μ1 ≠ μ2
Assumptions: the variances are different and the data follows a student-t distribution. In this
hypothesis test a two-tailed t-test will be used at 95% confidence level. Gene data for Control
Patients has “i” and that of UC (active) patients has no “i”. See table 2 in appendix. From the
results we reject the null hypothesis and conclude that the gene expression levels (in involved
tissue) between Control patients and UC (active) patients are different.
Wel ch Two Sampl e t - t est
dat a: t abl e( `Gene 1i `, ` Gene 2i `, ` Gene 3i `, ` Gene 4i `) and
t abl e( `Gene 1` , `Gene 2` , `Gene 3`, `Gene 4`)
t = 1. 0765, df = 49617, p- val ue = 0. 2817
al t er nat i ve hypot hesi s: t r ue di ff er ence i n means i s not equal t o 0
95 per cent confi dence i nt er val :
- 0. 0001303968 0. 0004481365
sampl e est i mat es:
mean of x mean of y
0. 0004551661 0. 0002962963
Part (c)
Hypothesis
Null hypothesis (H0): The gene expression levels (in involved tissue) between Control patients
and UC (in remission) patients are the same i.e. μ1=μ2
Alternative Hypothesis (H1): The gene expression levels (in involved tissue) between Control
patients and UC (in remission) patients are different i.e. μ1 ≠ μ2
Assumptions: the variances are different and the data follows a student-t distribution. In this
hypothesis test a two-tailed t-test will be used at 95% confidence level. Gene data for Control
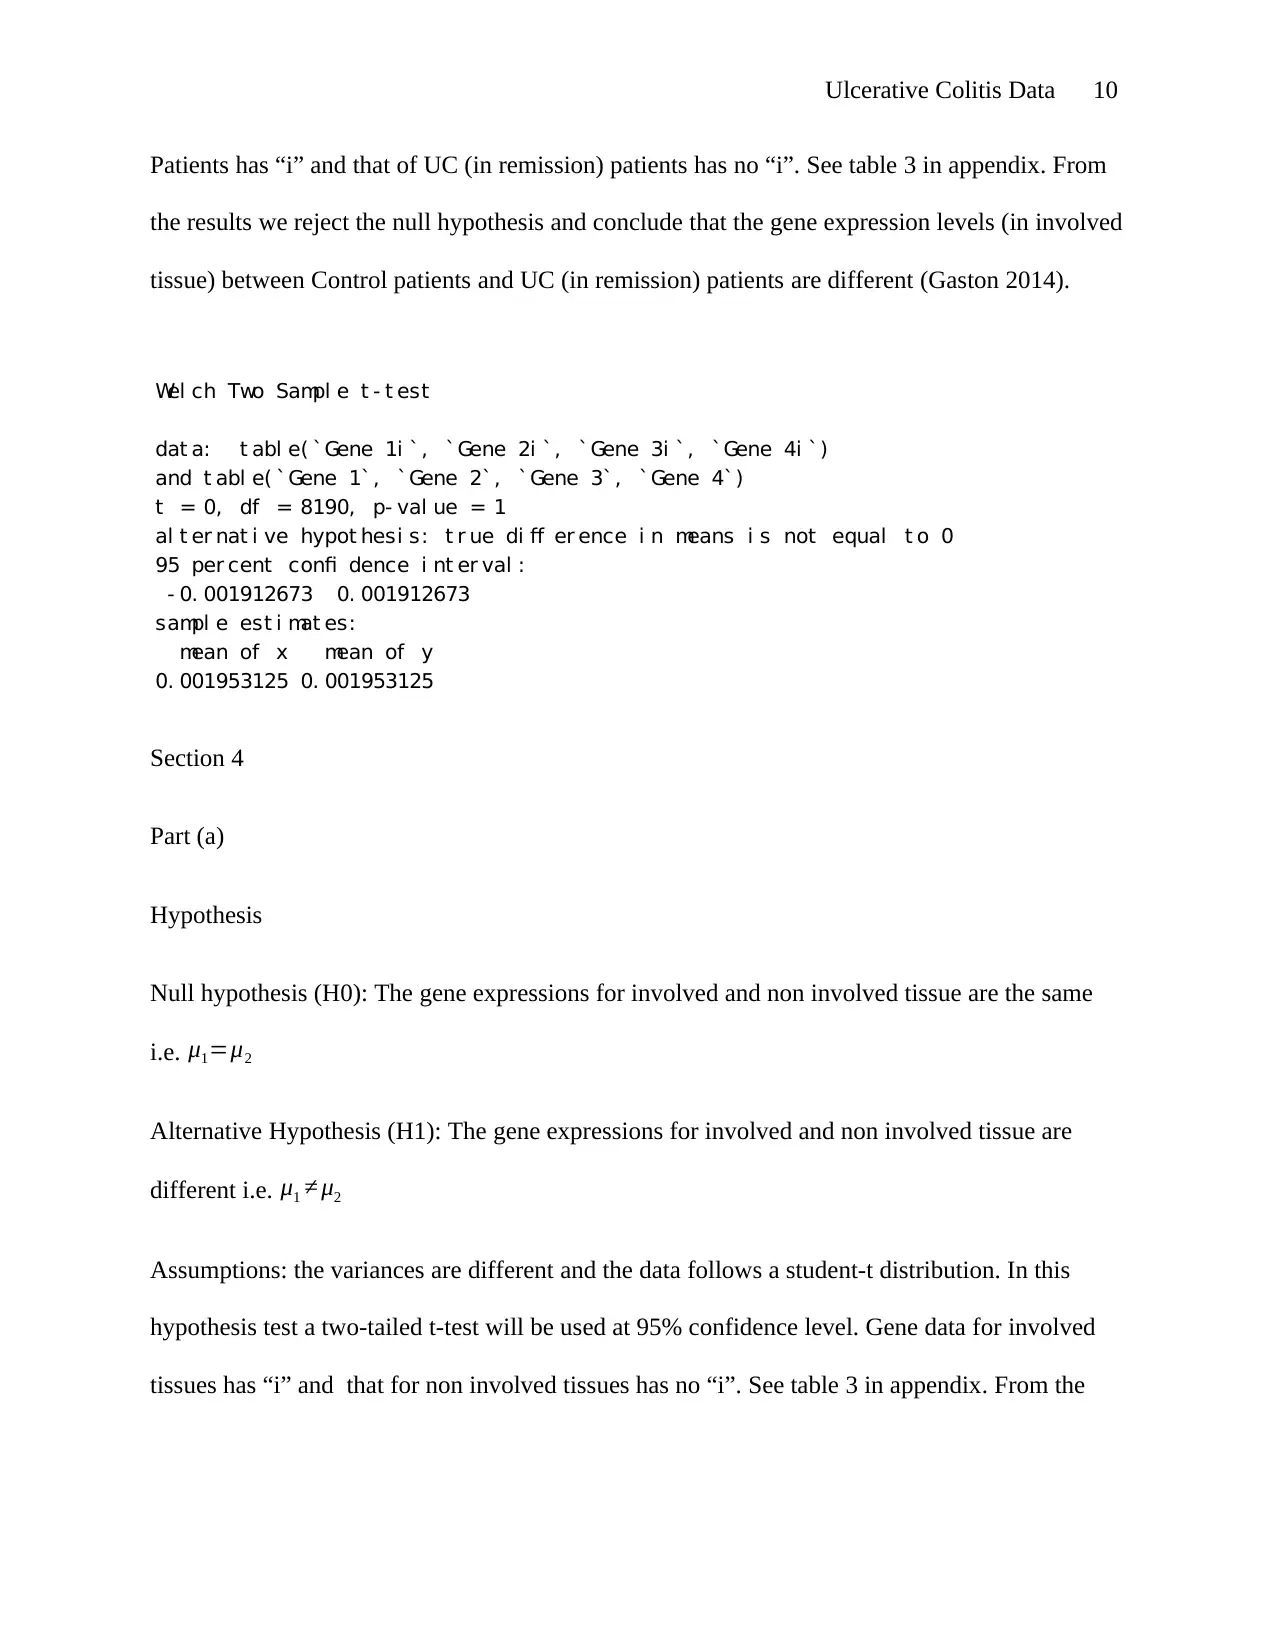
Ulcerative Colitis Data 10
Patients has “i” and that of UC (in remission) patients has no “i”. See table 3 in appendix. From
the results we reject the null hypothesis and conclude that the gene expression levels (in involved
tissue) between Control patients and UC (in remission) patients are different (Gaston 2014).
Wel ch Two Sampl e t - t est
dat a: t abl e( `Gene 1i `, `Gene 2i `, `Gene 3i `, `Gene 4i `)
and t abl e( `Gene 1`, `Gene 2`, `Gene 3`, `Gene 4`)
t = 0, df = 8190, p- val ue = 1
al t er nat i ve hypot hesi s: t r ue di ff er ence i n means i s not equal t o 0
95 per cent confi dence i nt er val :
- 0. 001912673 0. 001912673
sampl e est i mat es:
mean of x mean of y
0. 001953125 0. 001953125
Section 4
Part (a)
Hypothesis
Null hypothesis (H0): The gene expressions for involved and non involved tissue are the same
i.e. μ1=μ2
Alternative Hypothesis (H1): The gene expressions for involved and non involved tissue are
different i.e. μ1 ≠ μ2
Assumptions: the variances are different and the data follows a student-t distribution. In this
hypothesis test a two-tailed t-test will be used at 95% confidence level. Gene data for involved
tissues has “i” and that for non involved tissues has no “i”. See table 3 in appendix. From the
Secure Best Marks with AI Grader
Need help grading? Try our AI Grader for instant feedback on your assignments.
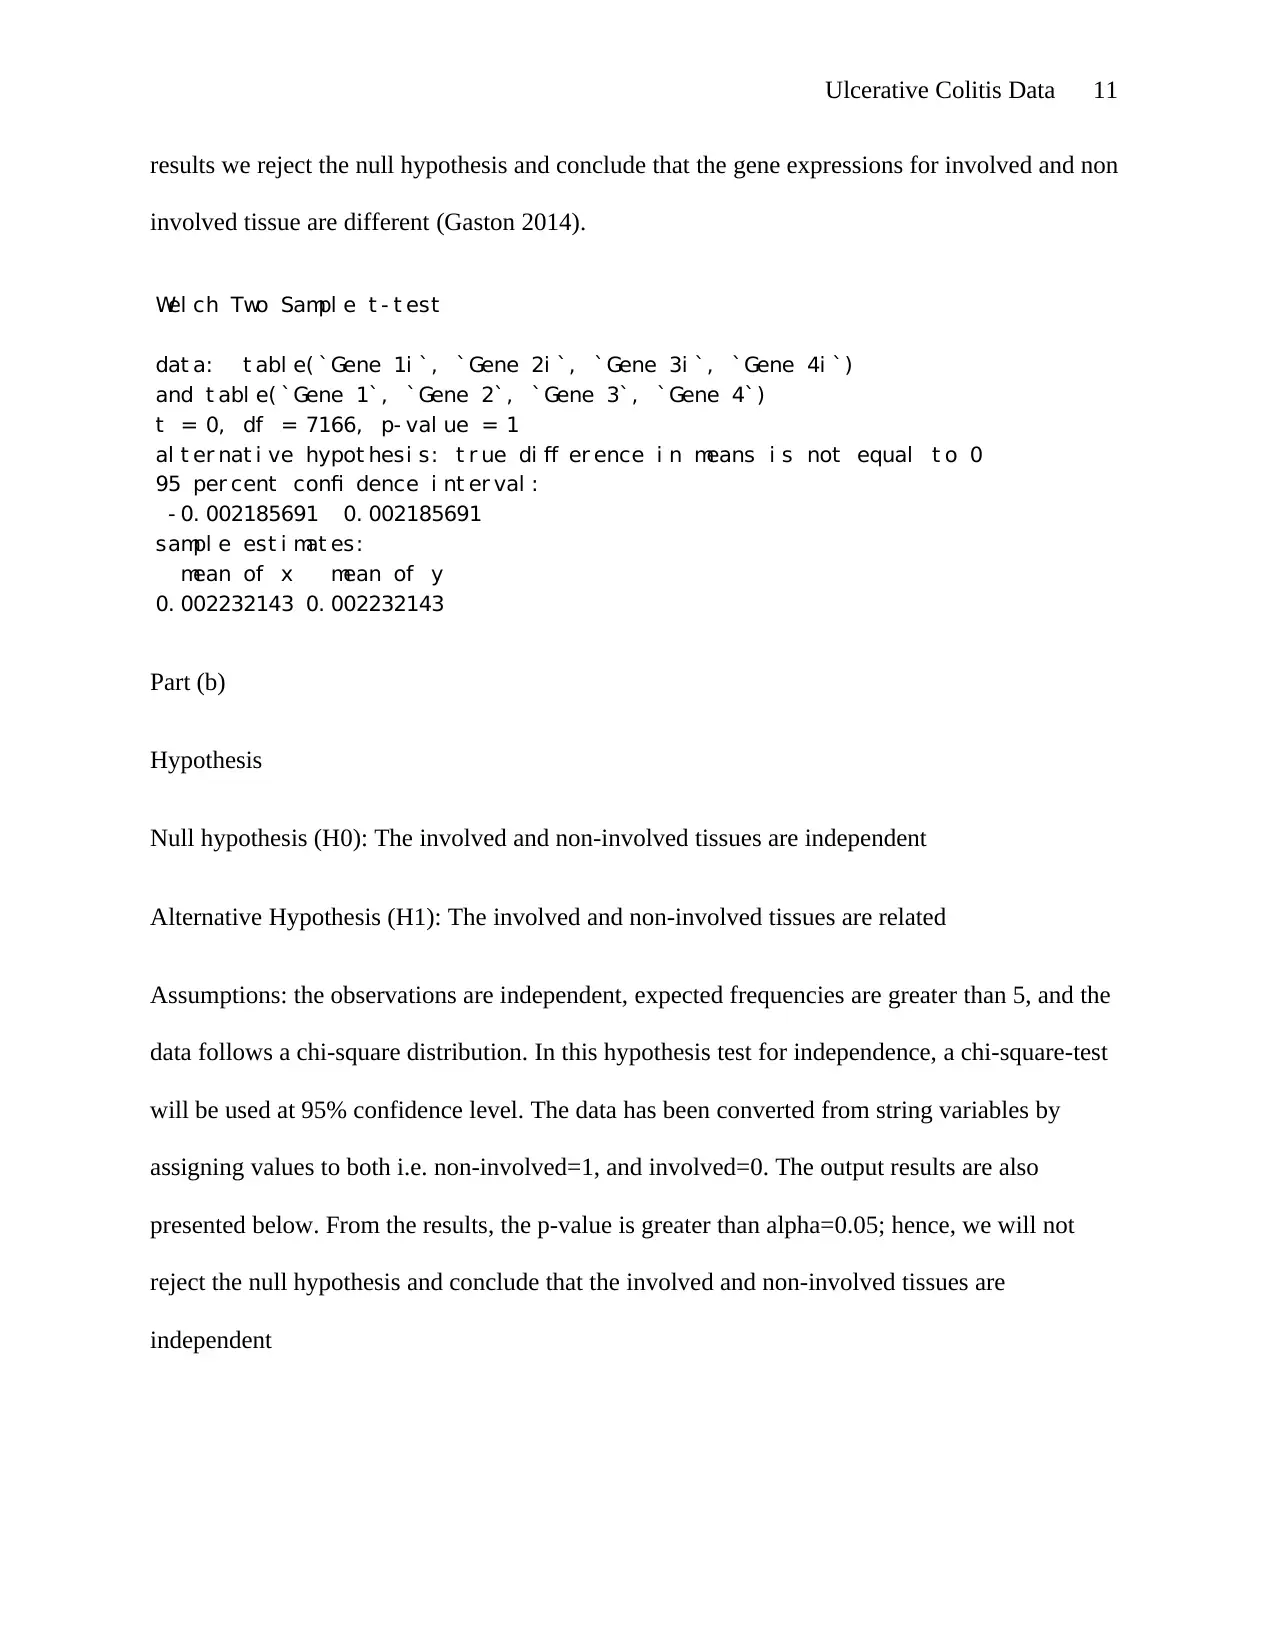
Ulcerative Colitis Data 11
results we reject the null hypothesis and conclude that the gene expressions for involved and non
involved tissue are different (Gaston 2014).
Wel ch Two Sampl e t - t est
dat a: t abl e( `Gene 1i `, ` Gene 2i `, ` Gene 3i `, `Gene 4i `)
and t abl e( `Gene 1`, ` Gene 2`, ` Gene 3`, `Gene 4` )
t = 0, df = 7166, p- val ue = 1
al t er nat i ve hypot hesi s: t r ue di ff er ence i n means i s not equal t o 0
95 per cent confi dence i nt er val :
- 0. 002185691 0. 002185691
sampl e est i mat es:
mean of x mean of y
0. 002232143 0. 002232143
Part (b)
Hypothesis
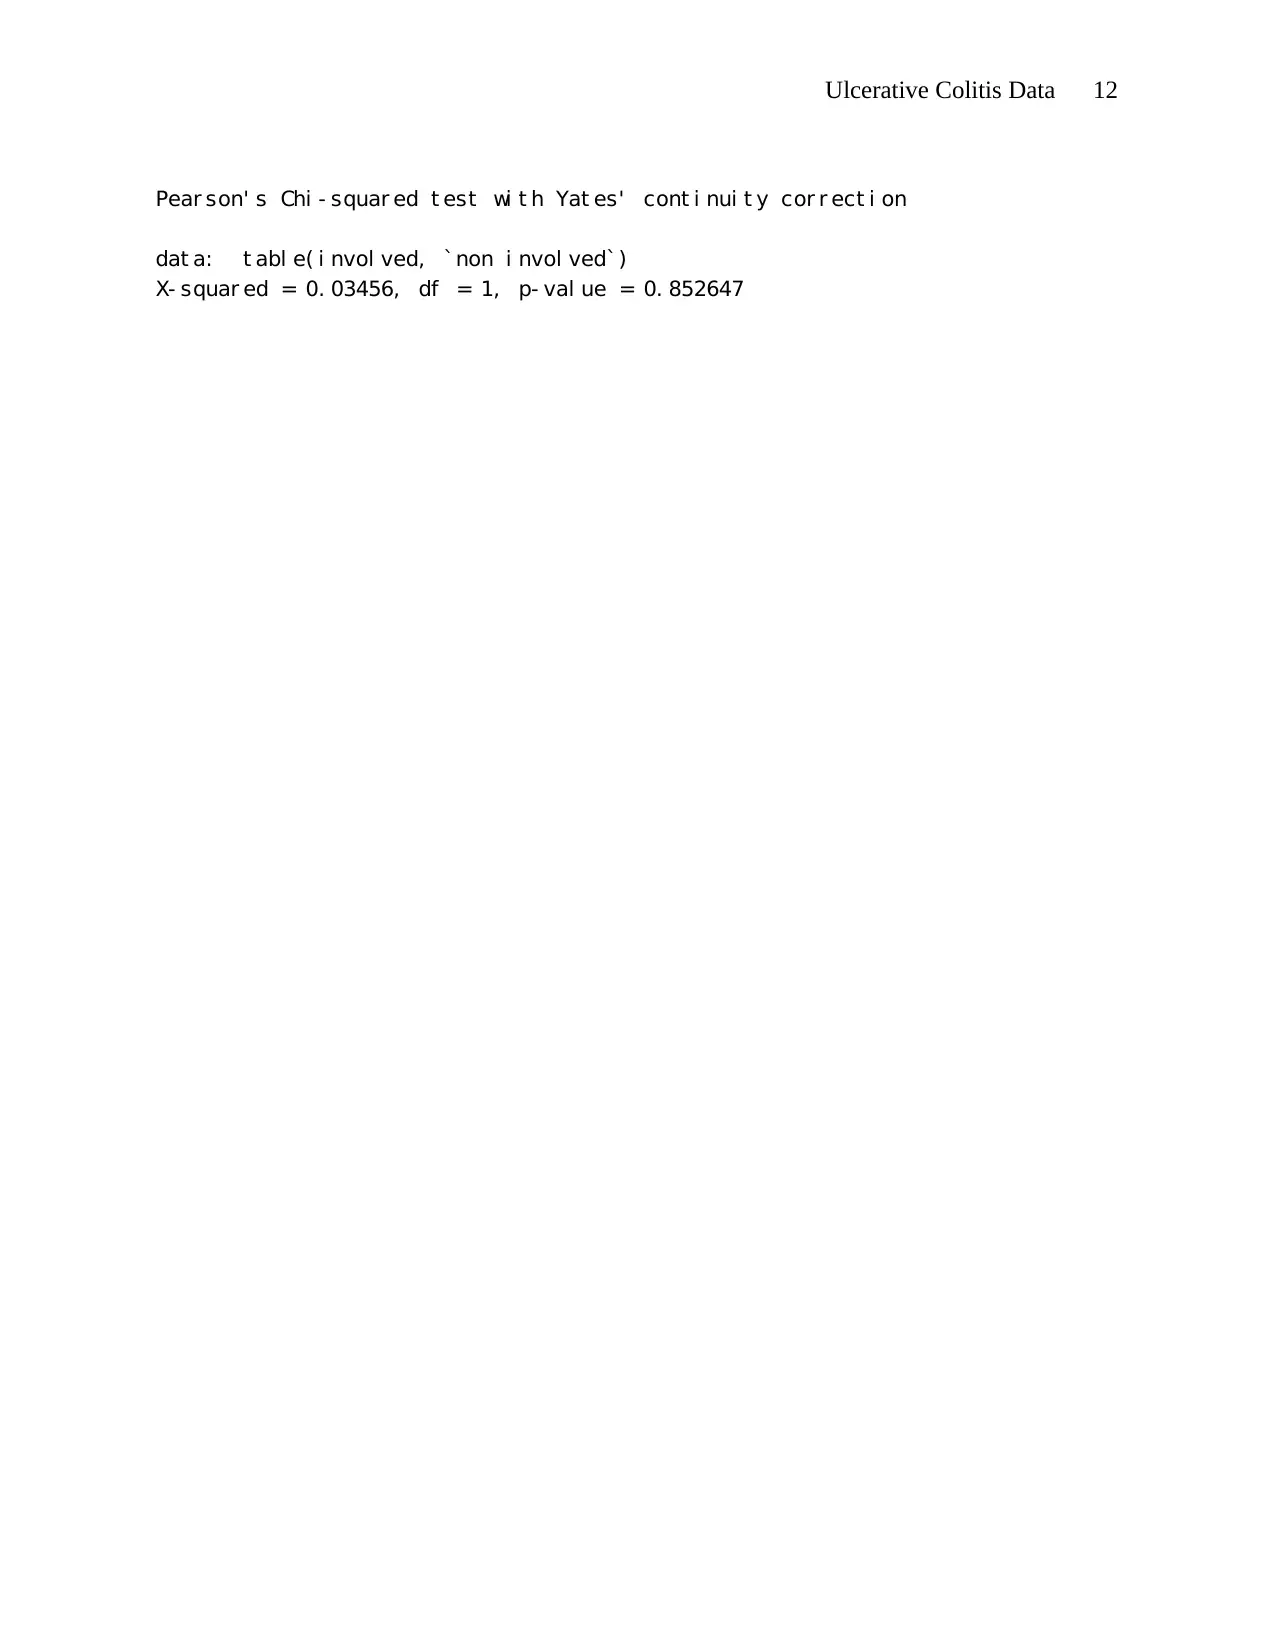
Null hypothesis (H0): The involved and non-involved tissues are independent
Alternative Hypothesis (H1): The involved and non-involved tissues are related
Assumptions: the observations are independent, expected frequencies are greater than 5, and the
data follows a chi-square distribution. In this hypothesis test for independence, a chi-square-test
will be used at 95% confidence level. The data has been converted from string variables by
assigning values to both i.e. non-involved=1, and involved=0. The output results are also
presented below. From the results, the p-value is greater than alpha=0.05; hence, we will not
reject the null hypothesis and conclude that the involved and non-involved tissues are
independent
results we reject the null hypothesis and conclude that the gene expressions for involved and non
involved tissue are different (Gaston 2014).
Wel ch Two Sampl e t - t est
dat a: t abl e( `Gene 1i `, ` Gene 2i `, ` Gene 3i `, `Gene 4i `)
and t abl e( `Gene 1`, ` Gene 2`, ` Gene 3`, `Gene 4` )
t = 0, df = 7166, p- val ue = 1
al t er nat i ve hypot hesi s: t r ue di ff er ence i n means i s not equal t o 0
95 per cent confi dence i nt er val :
- 0. 002185691 0. 002185691
sampl e est i mat es:
mean of x mean of y
0. 002232143 0. 002232143
Part (b)
Hypothesis
Null hypothesis (H0): The involved and non-involved tissues are independent
Alternative Hypothesis (H1): The involved and non-involved tissues are related
Assumptions: the observations are independent, expected frequencies are greater than 5, and the
data follows a chi-square distribution. In this hypothesis test for independence, a chi-square-test
will be used at 95% confidence level. The data has been converted from string variables by
assigning values to both i.e. non-involved=1, and involved=0. The output results are also
presented below. From the results, the p-value is greater than alpha=0.05; hence, we will not
reject the null hypothesis and conclude that the involved and non-involved tissues are
independent
Ulcerative Colitis Data 12
Pear son' s Chi - squar ed t est wi t h Yat es' cont i nui t y cor r ect i on
dat a: t abl e( i nvol ved, `non i nvol ved`)
X- squar ed = 0. 03456, df = 1, p- val ue = 0. 852647
Pear son' s Chi - squar ed t est wi t h Yat es' cont i nui t y cor r ect i on
dat a: t abl e( i nvol ved, `non i nvol ved`)
X- squar ed = 0. 03456, df = 1, p- val ue = 0. 852647
Ulcerative Colitis Data 13
References
Gaston L., 2014. Hypothesis Testing Made Simple, New York: Leonard Gaston.
Hartshorn S., 2017. Hypothesis Testing: A Visual Introduction to Statistical Significance, ,
London: Independently Published.
Appendix
References
Gaston L., 2014. Hypothesis Testing Made Simple, New York: Leonard Gaston.
Hartshorn S., 2017. Hypothesis Testing: A Visual Introduction to Statistical Significance, ,
London: Independently Published.
Appendix
Paraphrase This Document
Need a fresh take? Get an instant paraphrase of this document with our AI Paraphraser
Ulcerative Colitis Data 14
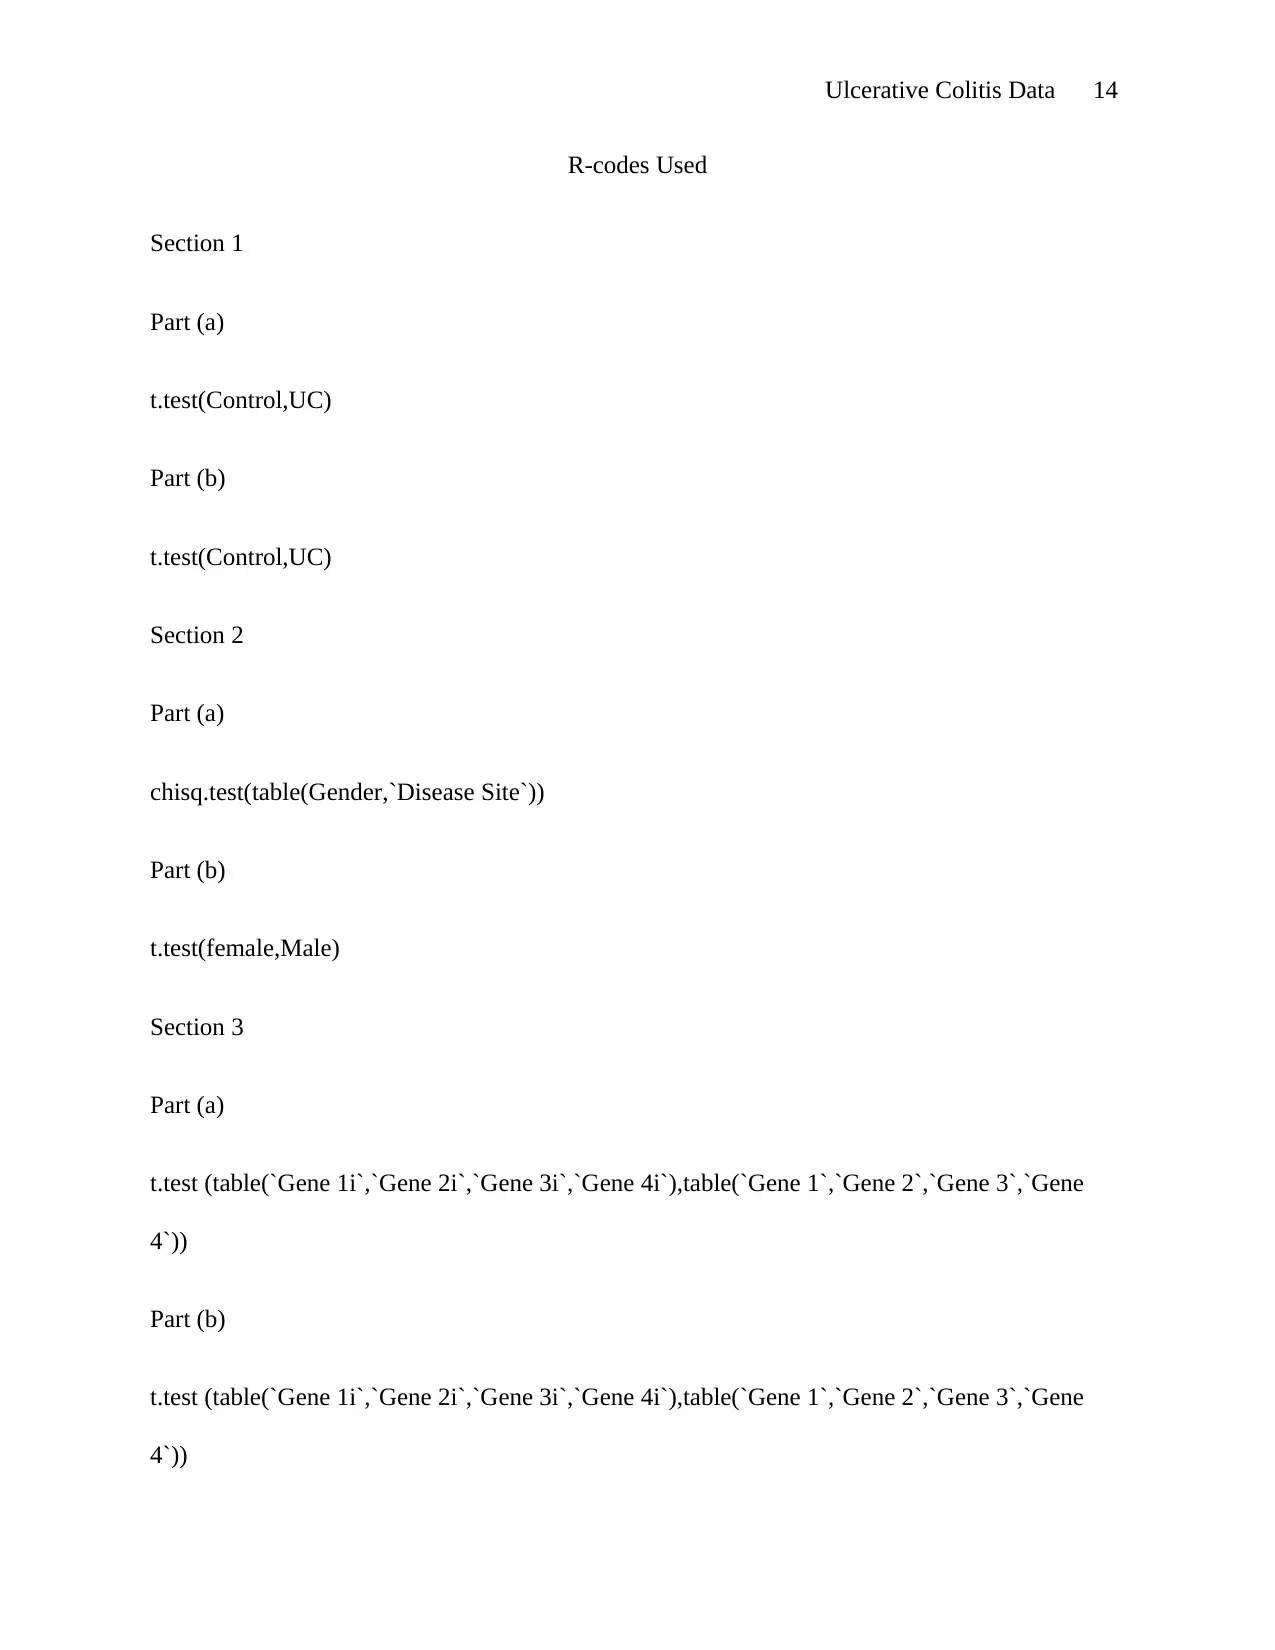
R-codes Used
Section 1
Part (a)
t.test(Control,UC)
Part (b)
t.test(Control,UC)
Section 2
Part (a)
chisq.test(table(Gender,`Disease Site`))
Part (b)
t.test(female,Male)
Section 3
Part (a)
t.test (table(`Gene 1i`,`Gene 2i`,`Gene 3i`,`Gene 4i`),table(`Gene 1`,`Gene 2`,`Gene 3`,`Gene
4`))
Part (b)
t.test (table(`Gene 1i`,`Gene 2i`,`Gene 3i`,`Gene 4i`),table(`Gene 1`,`Gene 2`,`Gene 3`,`Gene
4`))
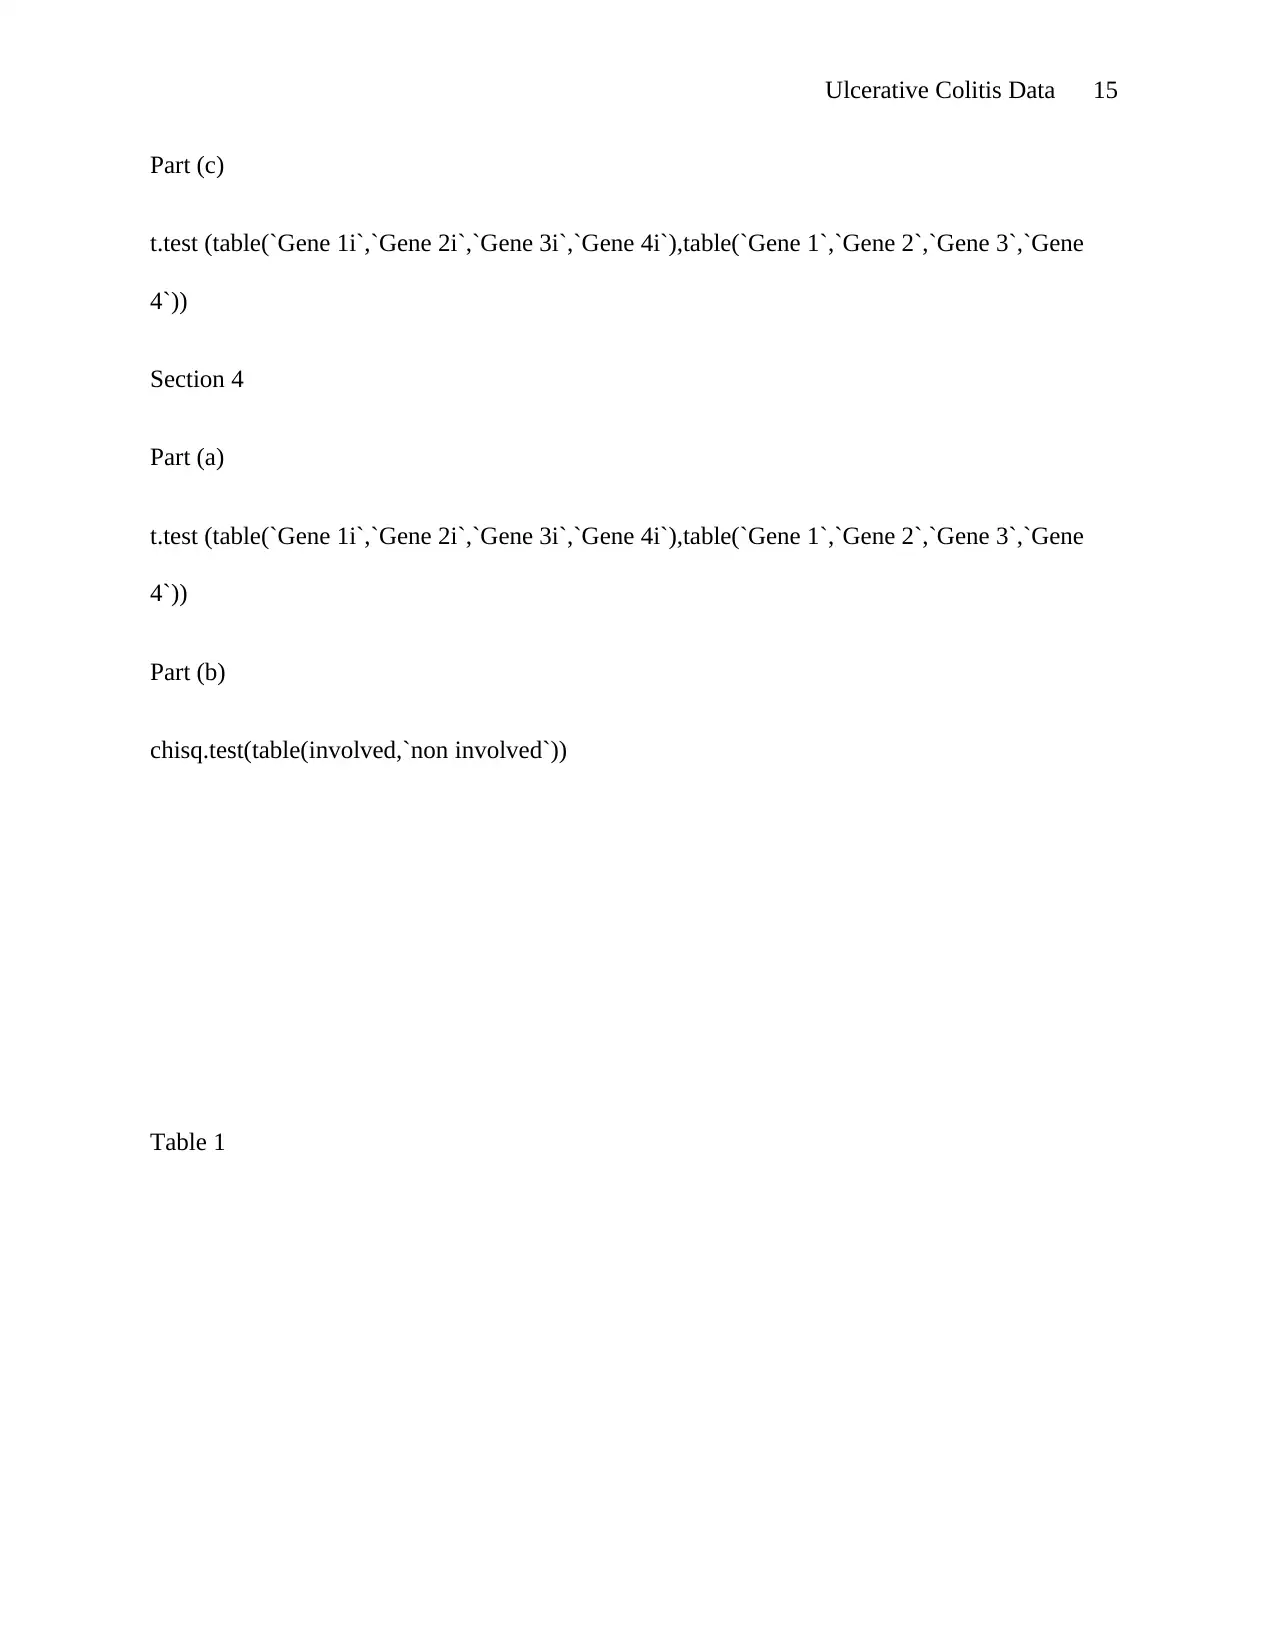
Ulcerative Colitis Data 15
Part (c)
t.test (table(`Gene 1i`,`Gene 2i`,`Gene 3i`,`Gene 4i`),table(`Gene 1`,`Gene 2`,`Gene 3`,`Gene
4`))
Section 4
Part (a)
t.test (table(`Gene 1i`,`Gene 2i`,`Gene 3i`,`Gene 4i`),table(`Gene 1`,`Gene 2`,`Gene 3`,`Gene
4`))
Part (b)
chisq.test(table(involved,`non involved`))
Table 1
Part (c)
t.test (table(`Gene 1i`,`Gene 2i`,`Gene 3i`,`Gene 4i`),table(`Gene 1`,`Gene 2`,`Gene 3`,`Gene
4`))
Section 4
Part (a)
t.test (table(`Gene 1i`,`Gene 2i`,`Gene 3i`,`Gene 4i`),table(`Gene 1`,`Gene 2`,`Gene 3`,`Gene
4`))
Part (b)
chisq.test(table(involved,`non involved`))
Table 1
Ulcerative Colitis Data 16
Gene 1i Gene 2i Gene 3i Gene 4i Gene 1 Gene 2 Gene 3 Gene 4
9.489699623 6.892245887 2.762007025 4.054070545 9.24246493 7.293338473 2.866985508 4.199098061
9.621262158 6.462598255 2.741077673 4.082663038 8.598978967 7.144382725 3.827215492 3.076999474
9.690866714 6.969376094 2.713375331 4.141933236 9.513800054 6.872177751 2.747222409 4.073789789
9.602138714 6.904274607 2.757377495 4.062844663 8.894354329 7.73695105 2.817356493 4.013929262
9.467397911 6.655617184 2.841879146 4.028622572 9.825976953 7.364722013 2.682776089 4.212957513
9.317857205 6.561254636 2.745403349 4.1459973 9.096082311 6.967043921 3.255102162 4.089158478
9.423082582 6.532538152 2.705541963 4.157154862 9.575329903 6.863426328 2.702276571 4.046509402
9.92829223 6.711141318 2.644966236 4.148580732 10.01916744 6.797236141 4.048452558 4.012268702
9.503869375 6.577203887 2.643727227 4.121958651
8.563112683 6.921693616 4.071322972 4.138259253
9.543061474 6.958454145 4.444785583 3.466645349
9.35337957 7.460282229 2.682660542 4.125693105
8.68579545 6.96712686 2.733244626 4.068672893
9.449733709 7.553031536 2.681218667 5.344150716
8.406895213 6.549566468 5.562670417 4.12511036
Table 2
Gene 1i Gene 2i Gene 3i Gene 4i Gene 1 Gene 2 Gene 3 Gene 4
9.735873709 7.40304634 2.670556911 4.118984086 9.24246493 7.293338473 2.866985508 4.199098061
9.271059898 7.7519903 2.677983068 4.211328716 8.598978967 7.144382725 3.827215492 3.076999474
9.885801457 7.579299809 2.758533305 4.787707524 9.513800054 6.872177751 2.747222409 4.073789789
9.306323968 5.986060767 2.720663495 4.141340896 8.894354329 7.73695105 2.817356493 4.013929262
9.647252231 7.546979378 2.683420794 5.057431683 9.825976953 7.364722013 2.682776089 4.212957513
9.969860398 7.461793291 2.707283177 5.427692489 9.096082311 6.967043921 3.255102162 4.089158478
9.837899384 6.547621041 2.676415955 4.357803064 9.575329903 6.863426328 2.702276571 4.046509402
9.833693263 6.409739182 2.674364156 4.132759937 10.01916744 6.797236141 4.048452558 4.012268702
9.853392763 7.295616512 2.681356888 4.187083111 9.503869375 6.577203887 2.643727227 4.121958651
9.919695438 6.877093768 2.693301274 5.080102931 8.563112683 6.921693616 4.071322972 4.138259253
9.981394812 6.877983307 2.673752398 4.142906326 9.543061474 6.958454145 4.444785583 3.466645349
9.484592724 6.991958303 2.719762053 4.776481548 9.35337957 7.460282229 2.682660542 4.125693105
9.740886726 6.057826446 2.774986141 4.160002895 8.68579545 6.96712686 2.733244626 4.068672893
9.449733709 7.553031536 2.681218667 5.344150716
8.406895213 6.549566468 5.562670417 4.12511036
Table 3
Gene 1i Gene 2i Gene 3i Gene 4i Gene 1 Gene 2 Gene 3 Gene 4
9.489699623 6.892245887 2.762007025 4.054070545 9.489699623 6.892245887 2.762007025 4.054070545
9.621262158 6.462598255 2.741077673 4.082663038 9.621262158 6.462598255 2.741077673 4.082663038
9.690866714 6.969376094 2.713375331 4.141933236 9.690866714 6.969376094 2.713375331 4.141933236
9.602138714 6.904274607 2.757377495 4.062844663 9.602138714 6.904274607 2.757377495 4.062844663
9.467397911 6.655617184 2.841879146 4.028622572 9.467397911 6.655617184 2.841879146 4.028622572
9.317857205 6.561254636 2.745403349 4.1459973 9.317857205 6.561254636 2.745403349 4.1459973
9.423082582 6.532538152 2.705541963 4.157154862 9.423082582 6.532538152 2.705541963 4.157154862
9.92829223 6.711141318 2.644966236 4.148580732 9.92829223 6.711141318 2.644966236 4.148580732
Gene 1i Gene 2i Gene 3i Gene 4i Gene 1 Gene 2 Gene 3 Gene 4
9.489699623 6.892245887 2.762007025 4.054070545 9.24246493 7.293338473 2.866985508 4.199098061
9.621262158 6.462598255 2.741077673 4.082663038 8.598978967 7.144382725 3.827215492 3.076999474
9.690866714 6.969376094 2.713375331 4.141933236 9.513800054 6.872177751 2.747222409 4.073789789
9.602138714 6.904274607 2.757377495 4.062844663 8.894354329 7.73695105 2.817356493 4.013929262
9.467397911 6.655617184 2.841879146 4.028622572 9.825976953 7.364722013 2.682776089 4.212957513
9.317857205 6.561254636 2.745403349 4.1459973 9.096082311 6.967043921 3.255102162 4.089158478
9.423082582 6.532538152 2.705541963 4.157154862 9.575329903 6.863426328 2.702276571 4.046509402
9.92829223 6.711141318 2.644966236 4.148580732 10.01916744 6.797236141 4.048452558 4.012268702
9.503869375 6.577203887 2.643727227 4.121958651
8.563112683 6.921693616 4.071322972 4.138259253
9.543061474 6.958454145 4.444785583 3.466645349
9.35337957 7.460282229 2.682660542 4.125693105
8.68579545 6.96712686 2.733244626 4.068672893
9.449733709 7.553031536 2.681218667 5.344150716
8.406895213 6.549566468 5.562670417 4.12511036
Table 2
Gene 1i Gene 2i Gene 3i Gene 4i Gene 1 Gene 2 Gene 3 Gene 4
9.735873709 7.40304634 2.670556911 4.118984086 9.24246493 7.293338473 2.866985508 4.199098061
9.271059898 7.7519903 2.677983068 4.211328716 8.598978967 7.144382725 3.827215492 3.076999474
9.885801457 7.579299809 2.758533305 4.787707524 9.513800054 6.872177751 2.747222409 4.073789789
9.306323968 5.986060767 2.720663495 4.141340896 8.894354329 7.73695105 2.817356493 4.013929262
9.647252231 7.546979378 2.683420794 5.057431683 9.825976953 7.364722013 2.682776089 4.212957513
9.969860398 7.461793291 2.707283177 5.427692489 9.096082311 6.967043921 3.255102162 4.089158478
9.837899384 6.547621041 2.676415955 4.357803064 9.575329903 6.863426328 2.702276571 4.046509402
9.833693263 6.409739182 2.674364156 4.132759937 10.01916744 6.797236141 4.048452558 4.012268702
9.853392763 7.295616512 2.681356888 4.187083111 9.503869375 6.577203887 2.643727227 4.121958651
9.919695438 6.877093768 2.693301274 5.080102931 8.563112683 6.921693616 4.071322972 4.138259253
9.981394812 6.877983307 2.673752398 4.142906326 9.543061474 6.958454145 4.444785583 3.466645349
9.484592724 6.991958303 2.719762053 4.776481548 9.35337957 7.460282229 2.682660542 4.125693105
9.740886726 6.057826446 2.774986141 4.160002895 8.68579545 6.96712686 2.733244626 4.068672893
9.449733709 7.553031536 2.681218667 5.344150716
8.406895213 6.549566468 5.562670417 4.12511036
Table 3
Gene 1i Gene 2i Gene 3i Gene 4i Gene 1 Gene 2 Gene 3 Gene 4
9.489699623 6.892245887 2.762007025 4.054070545 9.489699623 6.892245887 2.762007025 4.054070545
9.621262158 6.462598255 2.741077673 4.082663038 9.621262158 6.462598255 2.741077673 4.082663038
9.690866714 6.969376094 2.713375331 4.141933236 9.690866714 6.969376094 2.713375331 4.141933236
9.602138714 6.904274607 2.757377495 4.062844663 9.602138714 6.904274607 2.757377495 4.062844663
9.467397911 6.655617184 2.841879146 4.028622572 9.467397911 6.655617184 2.841879146 4.028622572
9.317857205 6.561254636 2.745403349 4.1459973 9.317857205 6.561254636 2.745403349 4.1459973
9.423082582 6.532538152 2.705541963 4.157154862 9.423082582 6.532538152 2.705541963 4.157154862
9.92829223 6.711141318 2.644966236 4.148580732 9.92829223 6.711141318 2.644966236 4.148580732
1 out of 16
Your All-in-One AI-Powered Toolkit for Academic Success.
+13062052269
info@desklib.com
Available 24*7 on WhatsApp / Email
![[object Object]](/_next/static/media/star-bottom.7253800d.svg)
Unlock your academic potential
© 2024 | Zucol Services PVT LTD | All rights reserved.