Finance Report: Concordia University Finance Module Stock Analysis
VerifiedAdded on 2022/11/13
|14
|2235
|401
Report
AI Summary
This finance report provides a comprehensive analysis of Universal Electronics (UEIC), examining its stock price performance from September 2017 to September 2019, and assessing its financial health through various ratios. The report delves into liquidity, leverage, activity, and profitability ratios, comparing UEIC's performance to Semtech. Key findings include the impact of macroeconomic and business factors on stock price, changes in current and quick ratios, debt and debt-to-equity ratios, inventory turnover, collection periods, and asset turnover. The profitability analysis reveals trends in gross profit, net profit margin, return on assets, and return on equity. A SWOT analysis highlights UEIC's strengths, weaknesses, opportunities, and threats. The report also includes a summary of financial strengths and weaknesses, along with references to relevant sources.
Running head: FINANCE
Finance
Name of the Student:
Name of the University:
Author’s Note:
Finance
Name of the Student:
Name of the University:
Author’s Note:
Paraphrase This Document
Need a fresh take? Get an instant paraphrase of this document with our AI Paraphraser
1FINANCE
Table of Contents
Stock Price Performance..................................................................................................................2
Ratio Analysis..................................................................................................................................2
Leverage Ratio.............................................................................................................................4
Activity Ratio...............................................................................................................................5
Profitability Ratio........................................................................................................................7
Summary of Financial Strengths and Weakness.........................................................................9
SWOT Analysis.........................................................................................................................10
References......................................................................................................................................11
2FINANCE
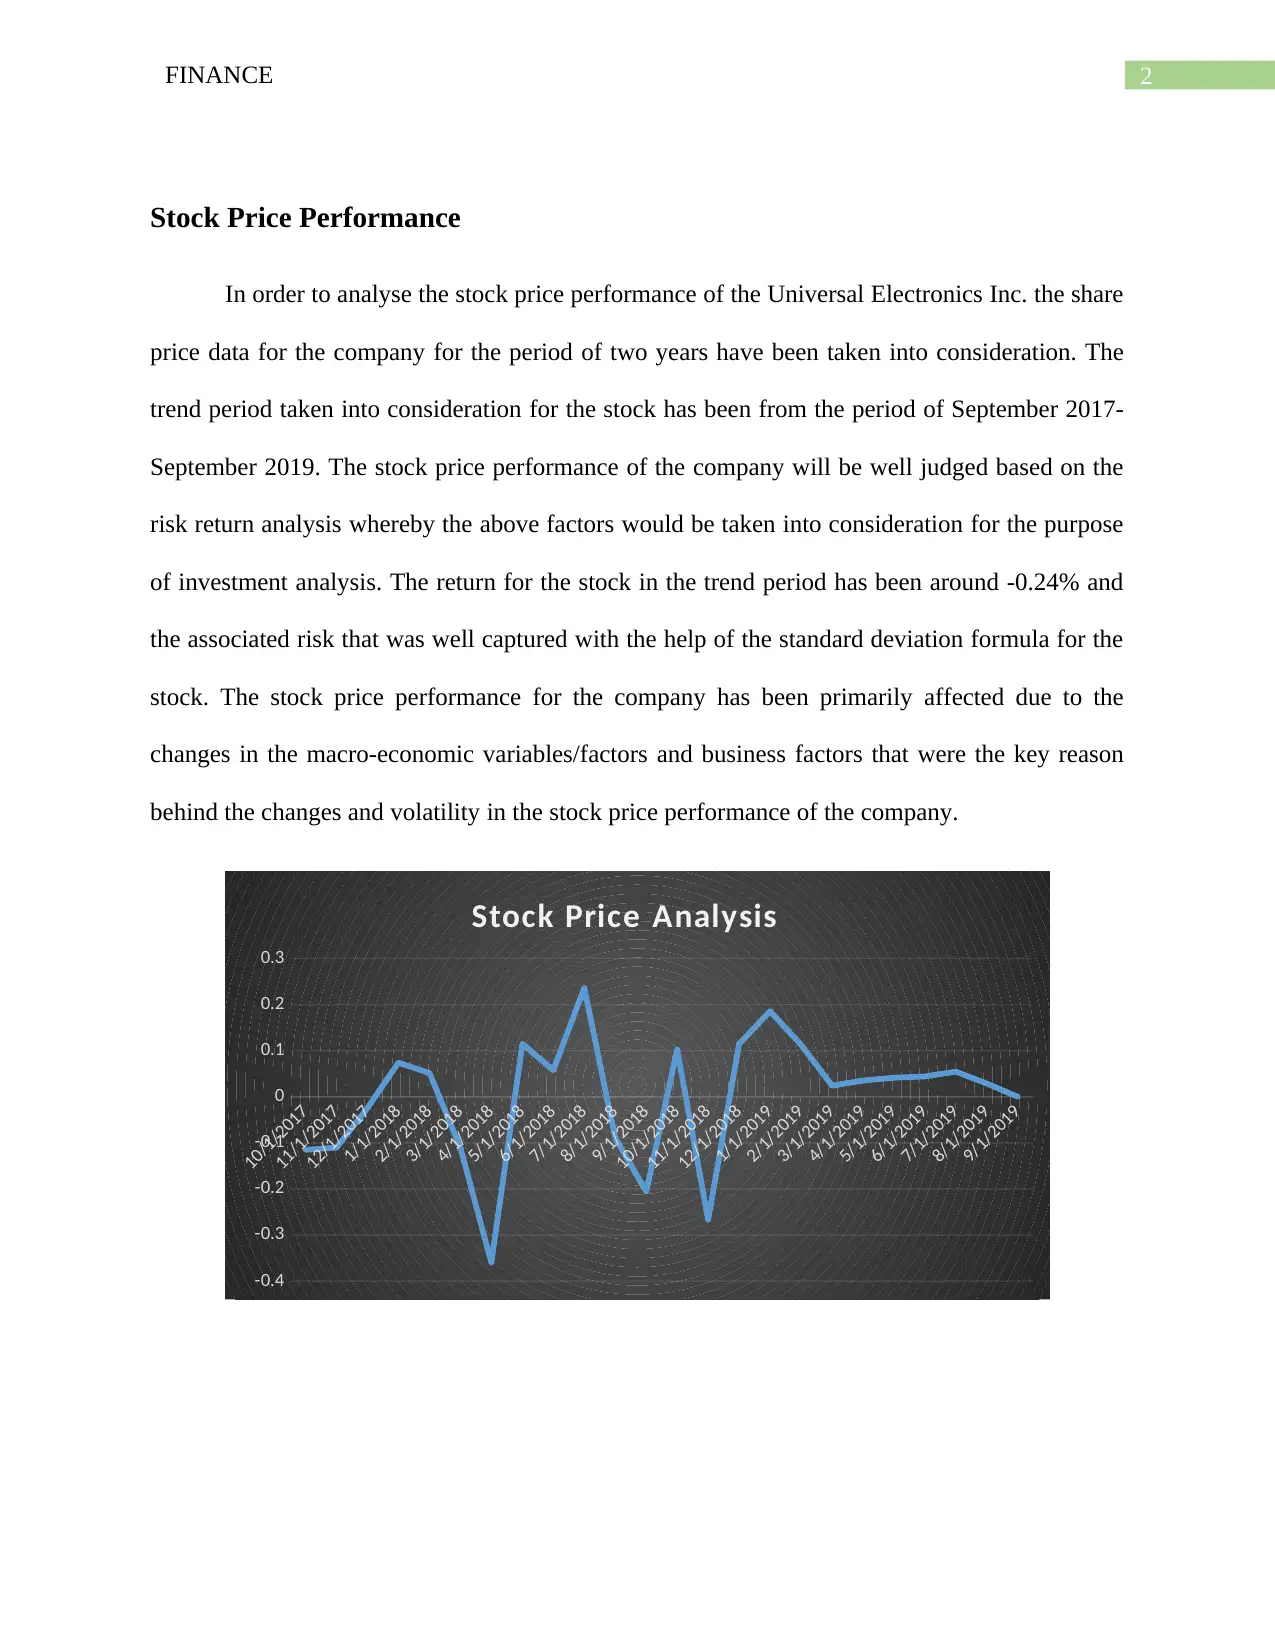
Stock Price Performance
In order to analyse the stock price performance of the Universal Electronics Inc. the share
price data for the company for the period of two years have been taken into consideration. The
trend period taken into consideration for the stock has been from the period of September 2017-
September 2019. The stock price performance of the company will be well judged based on the
risk return analysis whereby the above factors would be taken into consideration for the purpose
of investment analysis. The return for the stock in the trend period has been around -0.24% and
the associated risk that was well captured with the help of the standard deviation formula for the
stock. The stock price performance for the company has been primarily affected due to the
changes in the macro-economic variables/factors and business factors that were the key reason
behind the changes and volatility in the stock price performance of the company.
10/1/2017
11/1/2017
12/1/2017
1/1/2018
2/1/2018
3/1/2018
4/1/2018
5/1/2018
6/1/2018
7/1/2018
8/1/2018
9/1/2018
10/1/2018
11/1/2018
12/1/2018
1/1/2019
2/1/2019
3/1/2019
4/1/2019
5/1/2019
6/1/2019
7/1/2019
8/1/2019
9/1/2019
-0.4
-0.3
-0.2
-0.1
0
0.1
0.2
0.3
Stock Price Analysis
⊘ This is a preview!⊘
Do you want full access?
Subscribe today to unlock all pages.
Trusted by 1+ million students worldwide
3FINANCE
Ratio Analysis
Liquidity Ratio
The liquidity ratio for the company indicates the coverage of the current/liquid assets
with respect to the current liabilities of the company (Robinson et al., 2015).
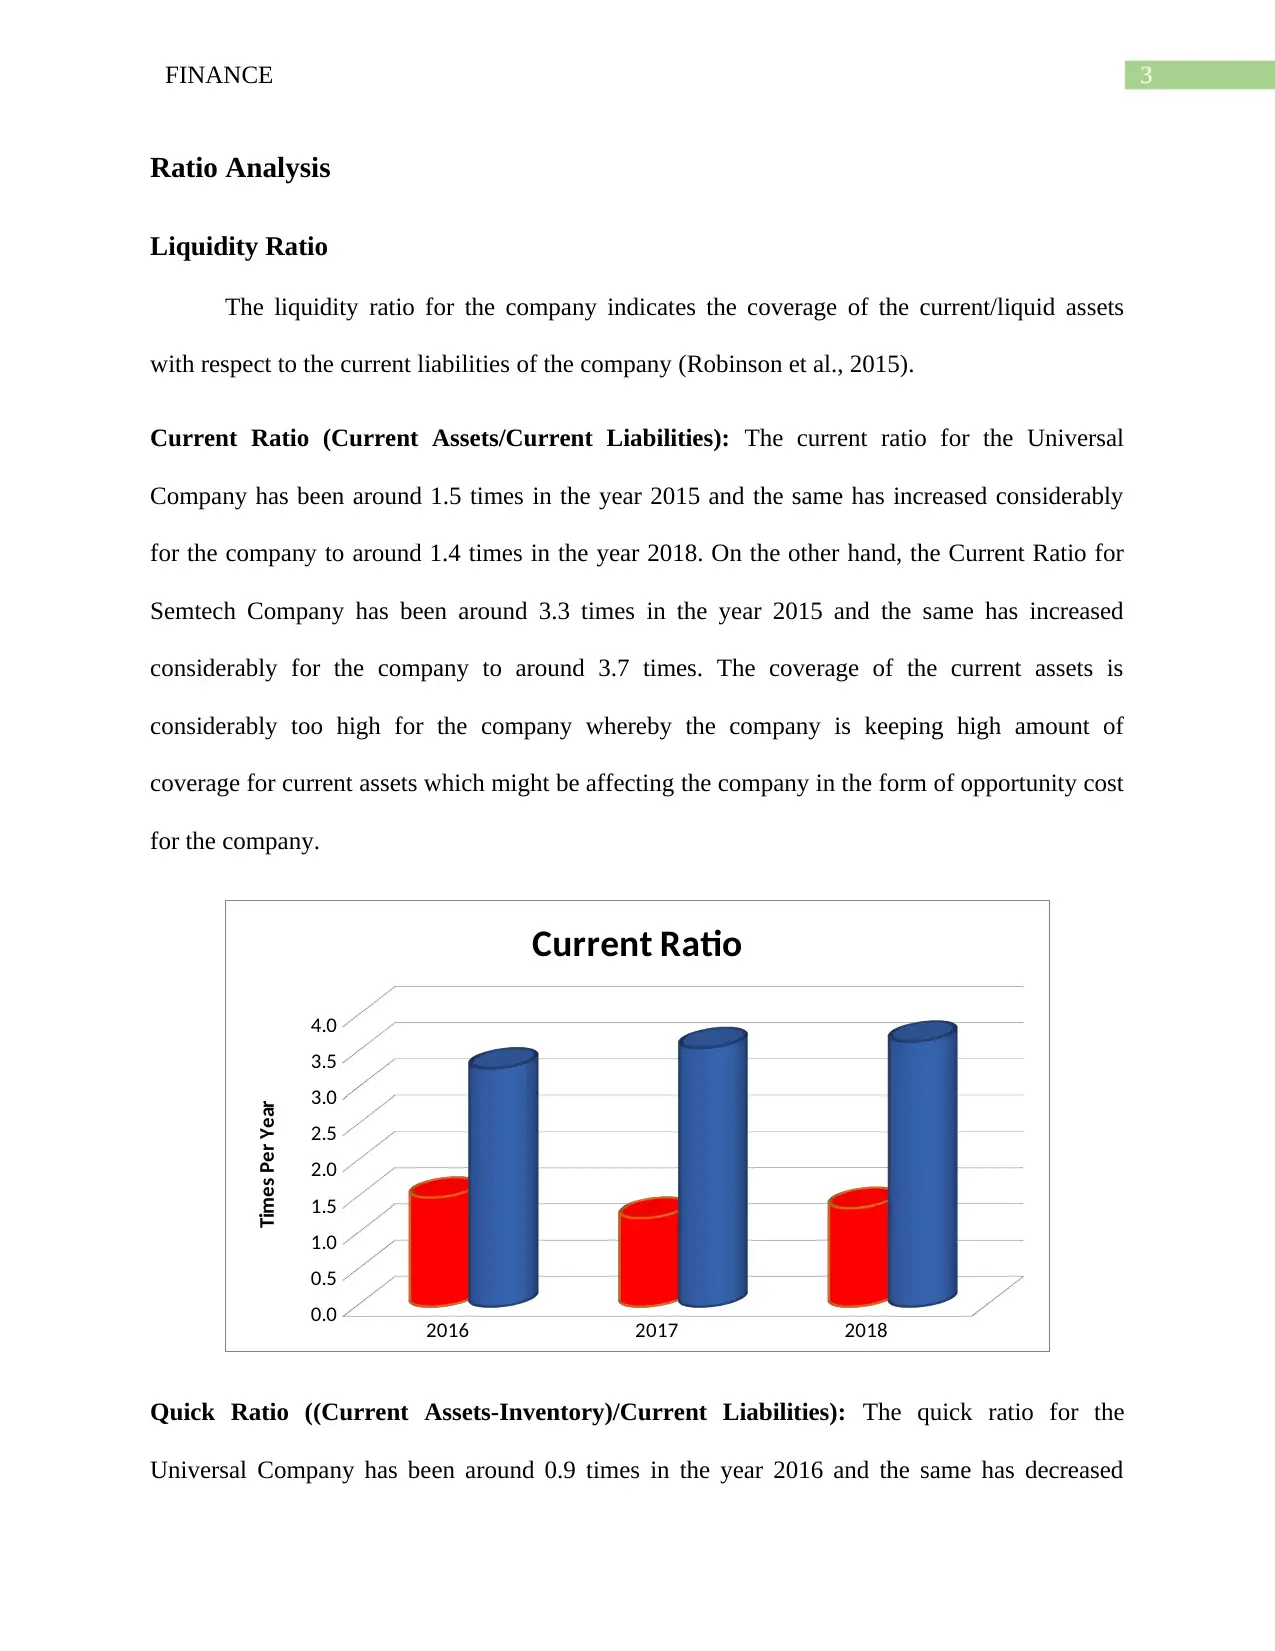
Current Ratio (Current Assets/Current Liabilities): The current ratio for the Universal
Company has been around 1.5 times in the year 2015 and the same has increased considerably
for the company to around 1.4 times in the year 2018. On the other hand, the Current Ratio for
Semtech Company has been around 3.3 times in the year 2015 and the same has increased
considerably for the company to around 3.7 times. The coverage of the current assets is
considerably too high for the company whereby the company is keeping high amount of
coverage for current assets which might be affecting the company in the form of opportunity cost
for the company.
2016 2017 2018
0.0
0.5
1.0
1.5
2.0
2.5
3.0
3.5
4.0
Current Ratio
Times Per Year
Quick Ratio ((Current Assets-Inventory)/Current Liabilities): The quick ratio for the
Universal Company has been around 0.9 times in the year 2016 and the same has decreased
Ratio Analysis
Liquidity Ratio
The liquidity ratio for the company indicates the coverage of the current/liquid assets
with respect to the current liabilities of the company (Robinson et al., 2015).
Current Ratio (Current Assets/Current Liabilities): The current ratio for the Universal
Company has been around 1.5 times in the year 2015 and the same has increased considerably
for the company to around 1.4 times in the year 2018. On the other hand, the Current Ratio for
Semtech Company has been around 3.3 times in the year 2015 and the same has increased
considerably for the company to around 3.7 times. The coverage of the current assets is
considerably too high for the company whereby the company is keeping high amount of
coverage for current assets which might be affecting the company in the form of opportunity cost
for the company.
2016 2017 2018
0.0
0.5
1.0
1.5
2.0
2.5
3.0
3.5
4.0
Current Ratio
Times Per Year
Quick Ratio ((Current Assets-Inventory)/Current Liabilities): The quick ratio for the
Universal Company has been around 0.9 times in the year 2016 and the same has decreased
Paraphrase This Document
Need a fresh take? Get an instant paraphrase of this document with our AI Paraphraser
4FINANCE
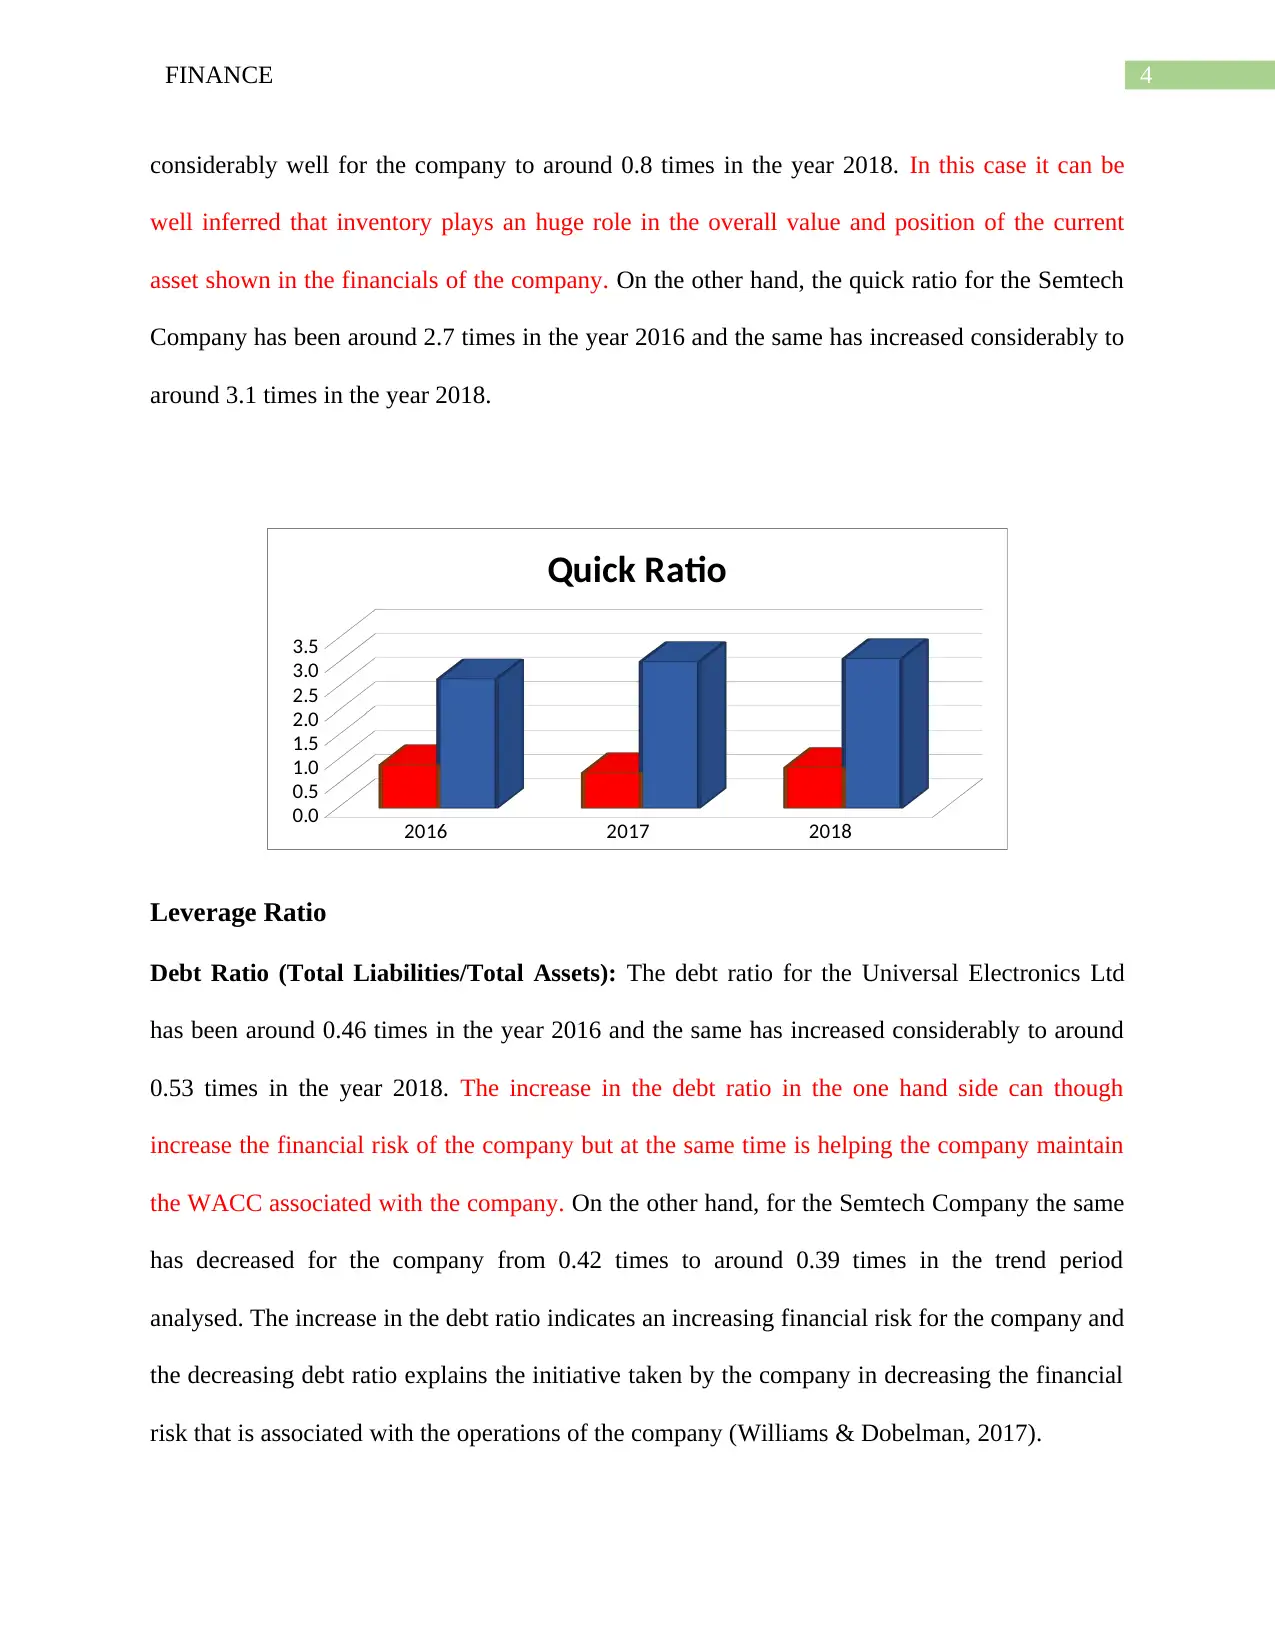
considerably well for the company to around 0.8 times in the year 2018. In this case it can be
well inferred that inventory plays an huge role in the overall value and position of the current
asset shown in the financials of the company. On the other hand, the quick ratio for the Semtech
Company has been around 2.7 times in the year 2016 and the same has increased considerably to
around 3.1 times in the year 2018.
2016 2017 2018
0.0
0.5
1.0
1.5
2.0
2.5
3.0
3.5
Quick Ratio
Leverage Ratio
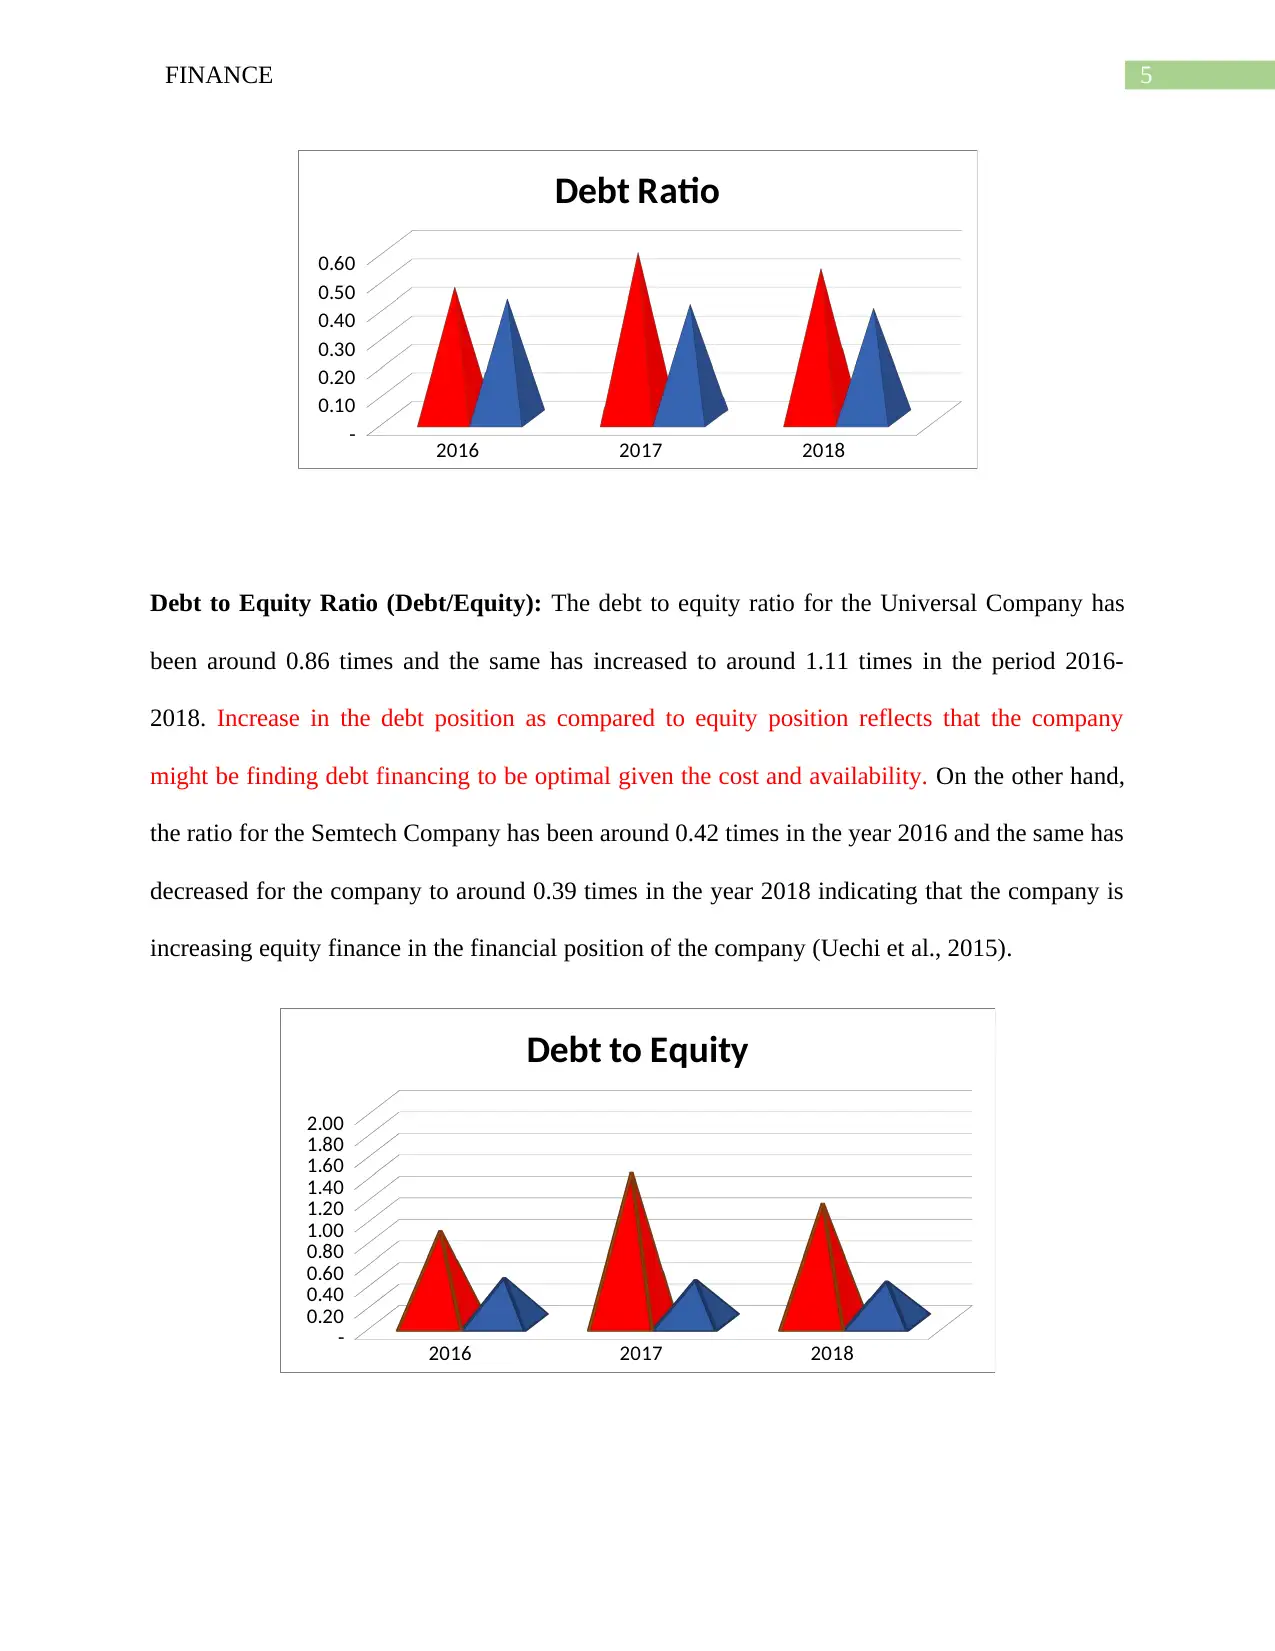
Debt Ratio (Total Liabilities/Total Assets): The debt ratio for the Universal Electronics Ltd
has been around 0.46 times in the year 2016 and the same has increased considerably to around
0.53 times in the year 2018. The increase in the debt ratio in the one hand side can though
increase the financial risk of the company but at the same time is helping the company maintain
the WACC associated with the company. On the other hand, for the Semtech Company the same
has decreased for the company from 0.42 times to around 0.39 times in the trend period
analysed. The increase in the debt ratio indicates an increasing financial risk for the company and
the decreasing debt ratio explains the initiative taken by the company in decreasing the financial
risk that is associated with the operations of the company (Williams & Dobelman, 2017).
considerably well for the company to around 0.8 times in the year 2018. In this case it can be
well inferred that inventory plays an huge role in the overall value and position of the current
asset shown in the financials of the company. On the other hand, the quick ratio for the Semtech
Company has been around 2.7 times in the year 2016 and the same has increased considerably to
around 3.1 times in the year 2018.
2016 2017 2018
0.0
0.5
1.0
1.5
2.0
2.5
3.0
3.5
Quick Ratio
Leverage Ratio
Debt Ratio (Total Liabilities/Total Assets): The debt ratio for the Universal Electronics Ltd
has been around 0.46 times in the year 2016 and the same has increased considerably to around
0.53 times in the year 2018. The increase in the debt ratio in the one hand side can though
increase the financial risk of the company but at the same time is helping the company maintain
the WACC associated with the company. On the other hand, for the Semtech Company the same
has decreased for the company from 0.42 times to around 0.39 times in the trend period
analysed. The increase in the debt ratio indicates an increasing financial risk for the company and
the decreasing debt ratio explains the initiative taken by the company in decreasing the financial
risk that is associated with the operations of the company (Williams & Dobelman, 2017).
5FINANCE
2016 2017 2018
-
0.10
0.20
0.30
0.40
0.50
0.60
Debt Ratio
Debt to Equity Ratio (Debt/Equity): The debt to equity ratio for the Universal Company has
been around 0.86 times and the same has increased to around 1.11 times in the period 2016-
2018. Increase in the debt position as compared to equity position reflects that the company
might be finding debt financing to be optimal given the cost and availability. On the other hand,
the ratio for the Semtech Company has been around 0.42 times in the year 2016 and the same has
decreased for the company to around 0.39 times in the year 2018 indicating that the company is
increasing equity finance in the financial position of the company (Uechi et al., 2015).
2016 2017 2018
-
0.20
0.40
0.60
0.80
1.00
1.20
1.40
1.60
1.80
2.00
Debt to Equity
2016 2017 2018
-
0.10
0.20
0.30
0.40
0.50
0.60
Debt Ratio
Debt to Equity Ratio (Debt/Equity): The debt to equity ratio for the Universal Company has
been around 0.86 times and the same has increased to around 1.11 times in the period 2016-
2018. Increase in the debt position as compared to equity position reflects that the company
might be finding debt financing to be optimal given the cost and availability. On the other hand,
the ratio for the Semtech Company has been around 0.42 times in the year 2016 and the same has
decreased for the company to around 0.39 times in the year 2018 indicating that the company is
increasing equity finance in the financial position of the company (Uechi et al., 2015).
2016 2017 2018
-
0.20
0.40
0.60
0.80
1.00
1.20
1.40
1.60
1.80
2.00
Debt to Equity
⊘ This is a preview!⊘
Do you want full access?
Subscribe today to unlock all pages.
Trusted by 1+ million students worldwide
6FINANCE
Activity Ratio
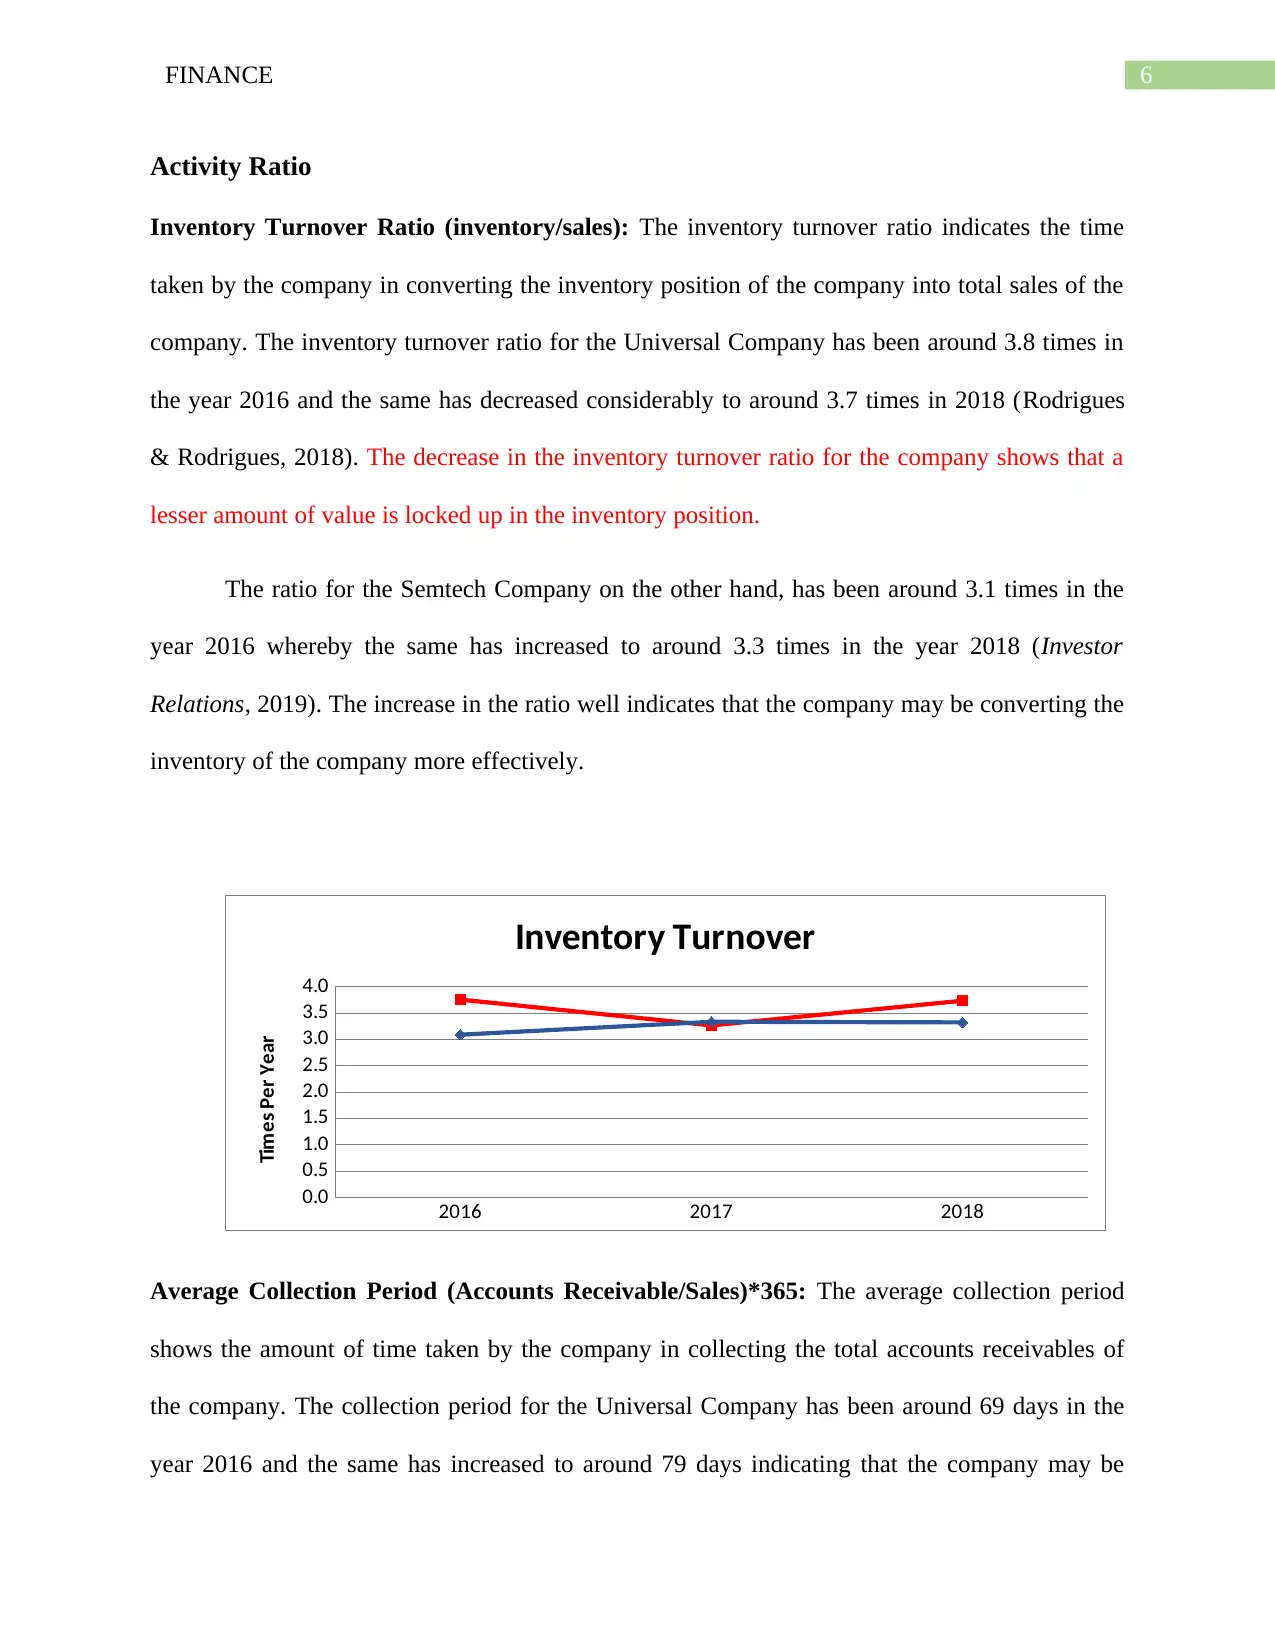
Inventory Turnover Ratio (inventory/sales): The inventory turnover ratio indicates the time
taken by the company in converting the inventory position of the company into total sales of the
company. The inventory turnover ratio for the Universal Company has been around 3.8 times in
the year 2016 and the same has decreased considerably to around 3.7 times in 2018 (Rodrigues
& Rodrigues, 2018). The decrease in the inventory turnover ratio for the company shows that a
lesser amount of value is locked up in the inventory position.
The ratio for the Semtech Company on the other hand, has been around 3.1 times in the
year 2016 whereby the same has increased to around 3.3 times in the year 2018 (Investor
Relations, 2019). The increase in the ratio well indicates that the company may be converting the
inventory of the company more effectively.
2016 2017 2018
0.0
0.5
1.0
1.5
2.0
2.5
3.0
3.5
4.0
Inventory Turnover
Times Per Year
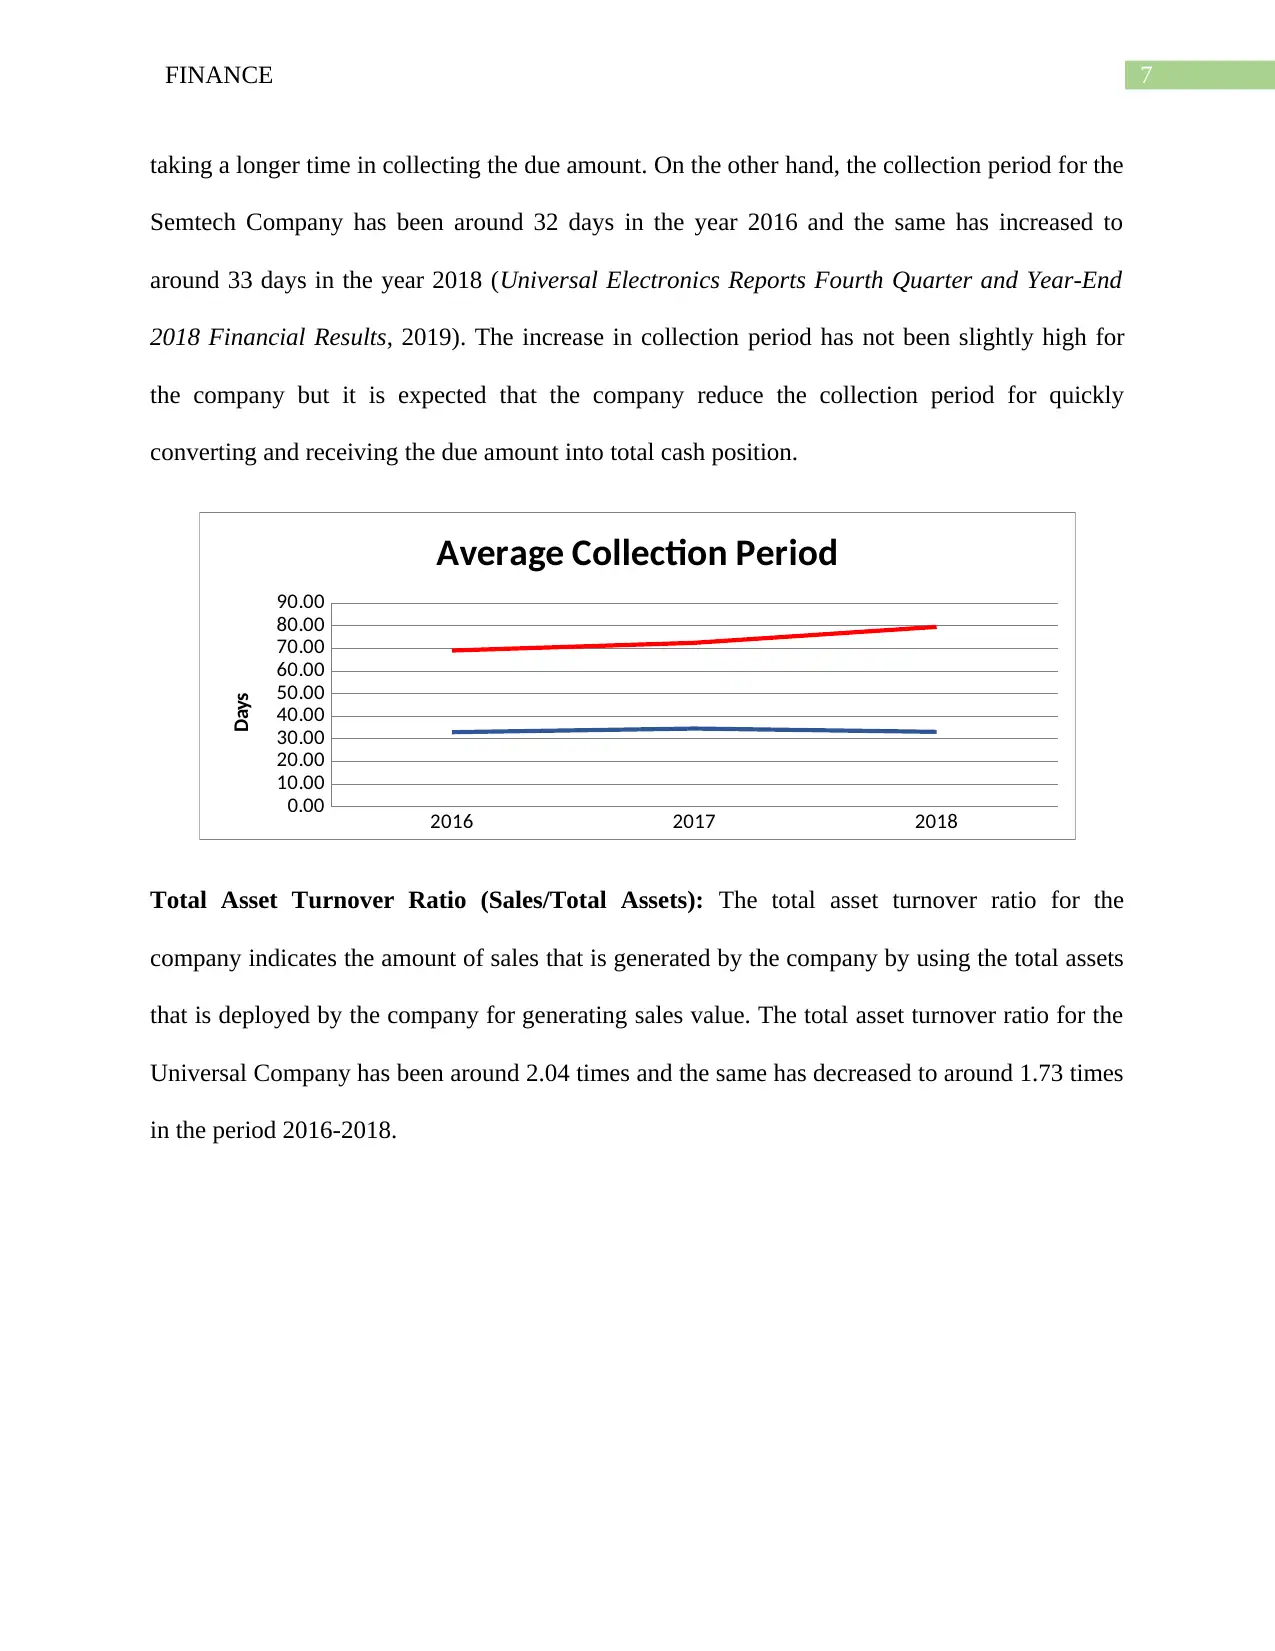
Average Collection Period (Accounts Receivable/Sales)*365: The average collection period
shows the amount of time taken by the company in collecting the total accounts receivables of
the company. The collection period for the Universal Company has been around 69 days in the
year 2016 and the same has increased to around 79 days indicating that the company may be
Activity Ratio
Inventory Turnover Ratio (inventory/sales): The inventory turnover ratio indicates the time
taken by the company in converting the inventory position of the company into total sales of the
company. The inventory turnover ratio for the Universal Company has been around 3.8 times in
the year 2016 and the same has decreased considerably to around 3.7 times in 2018 (Rodrigues
& Rodrigues, 2018). The decrease in the inventory turnover ratio for the company shows that a
lesser amount of value is locked up in the inventory position.
The ratio for the Semtech Company on the other hand, has been around 3.1 times in the
year 2016 whereby the same has increased to around 3.3 times in the year 2018 (Investor
Relations, 2019). The increase in the ratio well indicates that the company may be converting the
inventory of the company more effectively.
2016 2017 2018
0.0
0.5
1.0
1.5
2.0
2.5
3.0
3.5
4.0
Inventory Turnover
Times Per Year
Average Collection Period (Accounts Receivable/Sales)*365: The average collection period
shows the amount of time taken by the company in collecting the total accounts receivables of
the company. The collection period for the Universal Company has been around 69 days in the
year 2016 and the same has increased to around 79 days indicating that the company may be
Paraphrase This Document
Need a fresh take? Get an instant paraphrase of this document with our AI Paraphraser
7FINANCE
taking a longer time in collecting the due amount. On the other hand, the collection period for the
Semtech Company has been around 32 days in the year 2016 and the same has increased to
around 33 days in the year 2018 (Universal Electronics Reports Fourth Quarter and Year-End
2018 Financial Results, 2019). The increase in collection period has not been slightly high for
the company but it is expected that the company reduce the collection period for quickly
converting and receiving the due amount into total cash position.
2016 2017 2018
0.00
10.00
20.00
30.00
40.00
50.00
60.00
70.00
80.00
90.00
Average Collection Period
Days
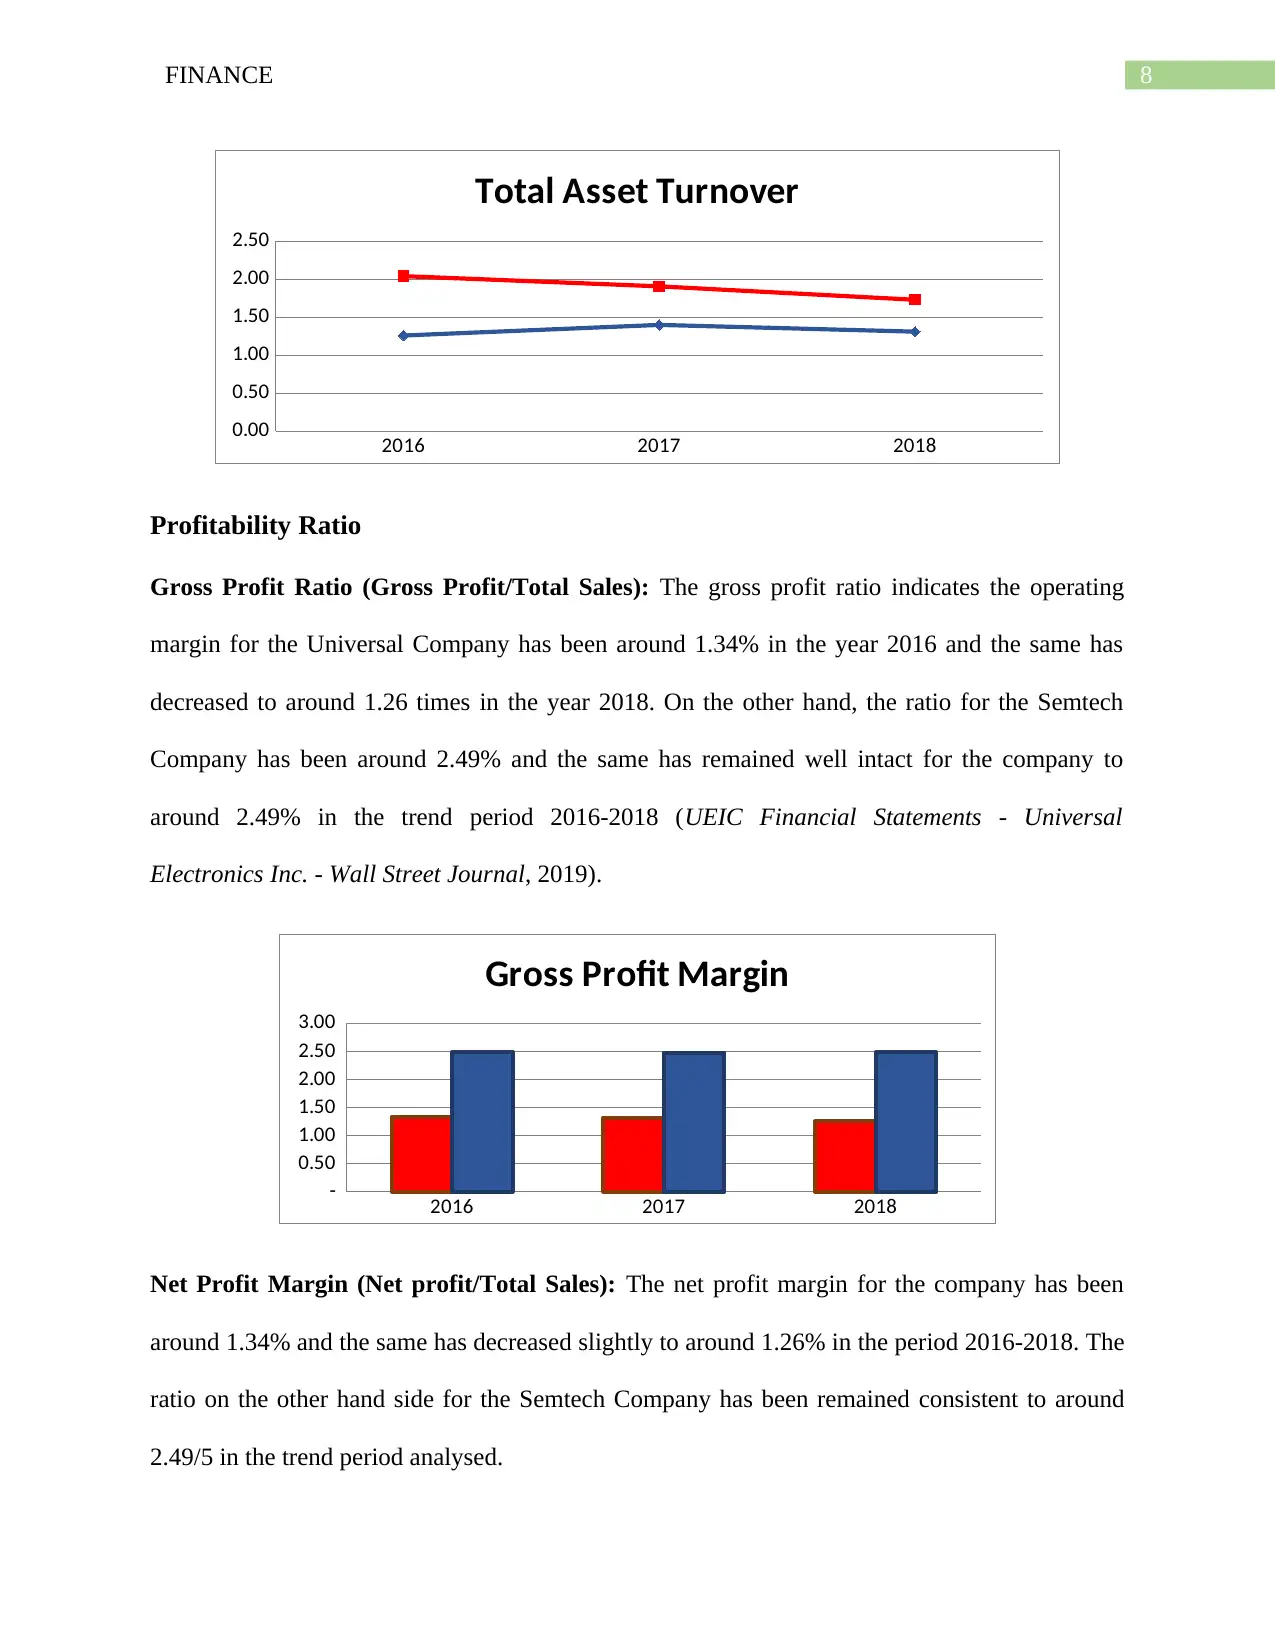
Total Asset Turnover Ratio (Sales/Total Assets): The total asset turnover ratio for the
company indicates the amount of sales that is generated by the company by using the total assets
that is deployed by the company for generating sales value. The total asset turnover ratio for the
Universal Company has been around 2.04 times and the same has decreased to around 1.73 times
in the period 2016-2018.
taking a longer time in collecting the due amount. On the other hand, the collection period for the
Semtech Company has been around 32 days in the year 2016 and the same has increased to
around 33 days in the year 2018 (Universal Electronics Reports Fourth Quarter and Year-End
2018 Financial Results, 2019). The increase in collection period has not been slightly high for
the company but it is expected that the company reduce the collection period for quickly
converting and receiving the due amount into total cash position.
2016 2017 2018
0.00
10.00
20.00
30.00
40.00
50.00
60.00
70.00
80.00
90.00
Average Collection Period
Days
Total Asset Turnover Ratio (Sales/Total Assets): The total asset turnover ratio for the
company indicates the amount of sales that is generated by the company by using the total assets
that is deployed by the company for generating sales value. The total asset turnover ratio for the
Universal Company has been around 2.04 times and the same has decreased to around 1.73 times
in the period 2016-2018.
8FINANCE
2016 2017 2018
0.00
0.50
1.00
1.50
2.00
2.50
Total Asset Turnover
Profitability Ratio
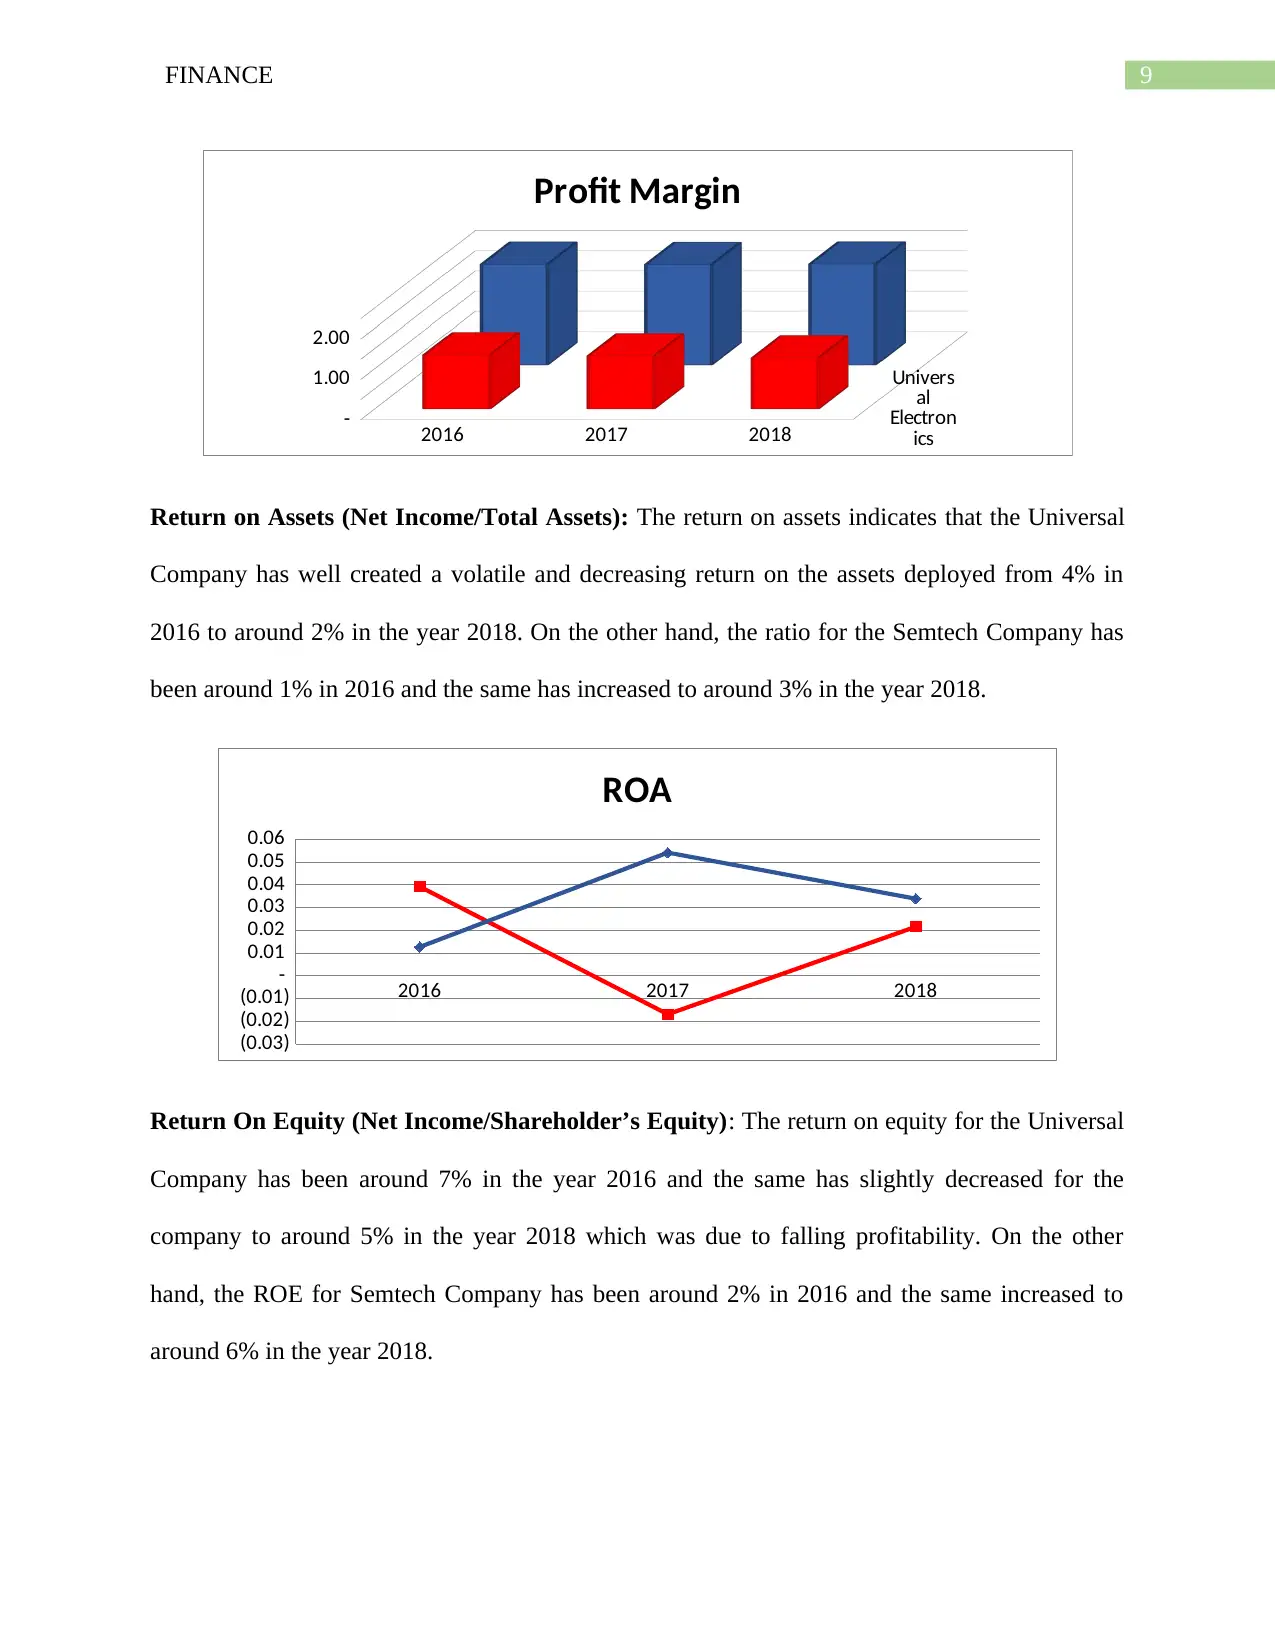
Gross Profit Ratio (Gross Profit/Total Sales): The gross profit ratio indicates the operating
margin for the Universal Company has been around 1.34% in the year 2016 and the same has
decreased to around 1.26 times in the year 2018. On the other hand, the ratio for the Semtech
Company has been around 2.49% and the same has remained well intact for the company to
around 2.49% in the trend period 2016-2018 (UEIC Financial Statements - Universal
Electronics Inc. - Wall Street Journal, 2019).
2016 2017 2018
-
0.50
1.00
1.50
2.00
2.50
3.00
Gross Profit Margin
Net Profit Margin (Net profit/Total Sales): The net profit margin for the company has been
around 1.34% and the same has decreased slightly to around 1.26% in the period 2016-2018. The
ratio on the other hand side for the Semtech Company has been remained consistent to around
2.49/5 in the trend period analysed.
2016 2017 2018
0.00
0.50
1.00
1.50
2.00
2.50
Total Asset Turnover
Profitability Ratio
Gross Profit Ratio (Gross Profit/Total Sales): The gross profit ratio indicates the operating
margin for the Universal Company has been around 1.34% in the year 2016 and the same has
decreased to around 1.26 times in the year 2018. On the other hand, the ratio for the Semtech
Company has been around 2.49% and the same has remained well intact for the company to
around 2.49% in the trend period 2016-2018 (UEIC Financial Statements - Universal
Electronics Inc. - Wall Street Journal, 2019).
2016 2017 2018
-
0.50
1.00
1.50
2.00
2.50
3.00
Gross Profit Margin
Net Profit Margin (Net profit/Total Sales): The net profit margin for the company has been
around 1.34% and the same has decreased slightly to around 1.26% in the period 2016-2018. The
ratio on the other hand side for the Semtech Company has been remained consistent to around
2.49/5 in the trend period analysed.
⊘ This is a preview!⊘
Do you want full access?
Subscribe today to unlock all pages.
Trusted by 1+ million students worldwide
9FINANCE
2016 2017 2018
-
1.00
2.00
Univers
al
Electron
ics
Profit Margin
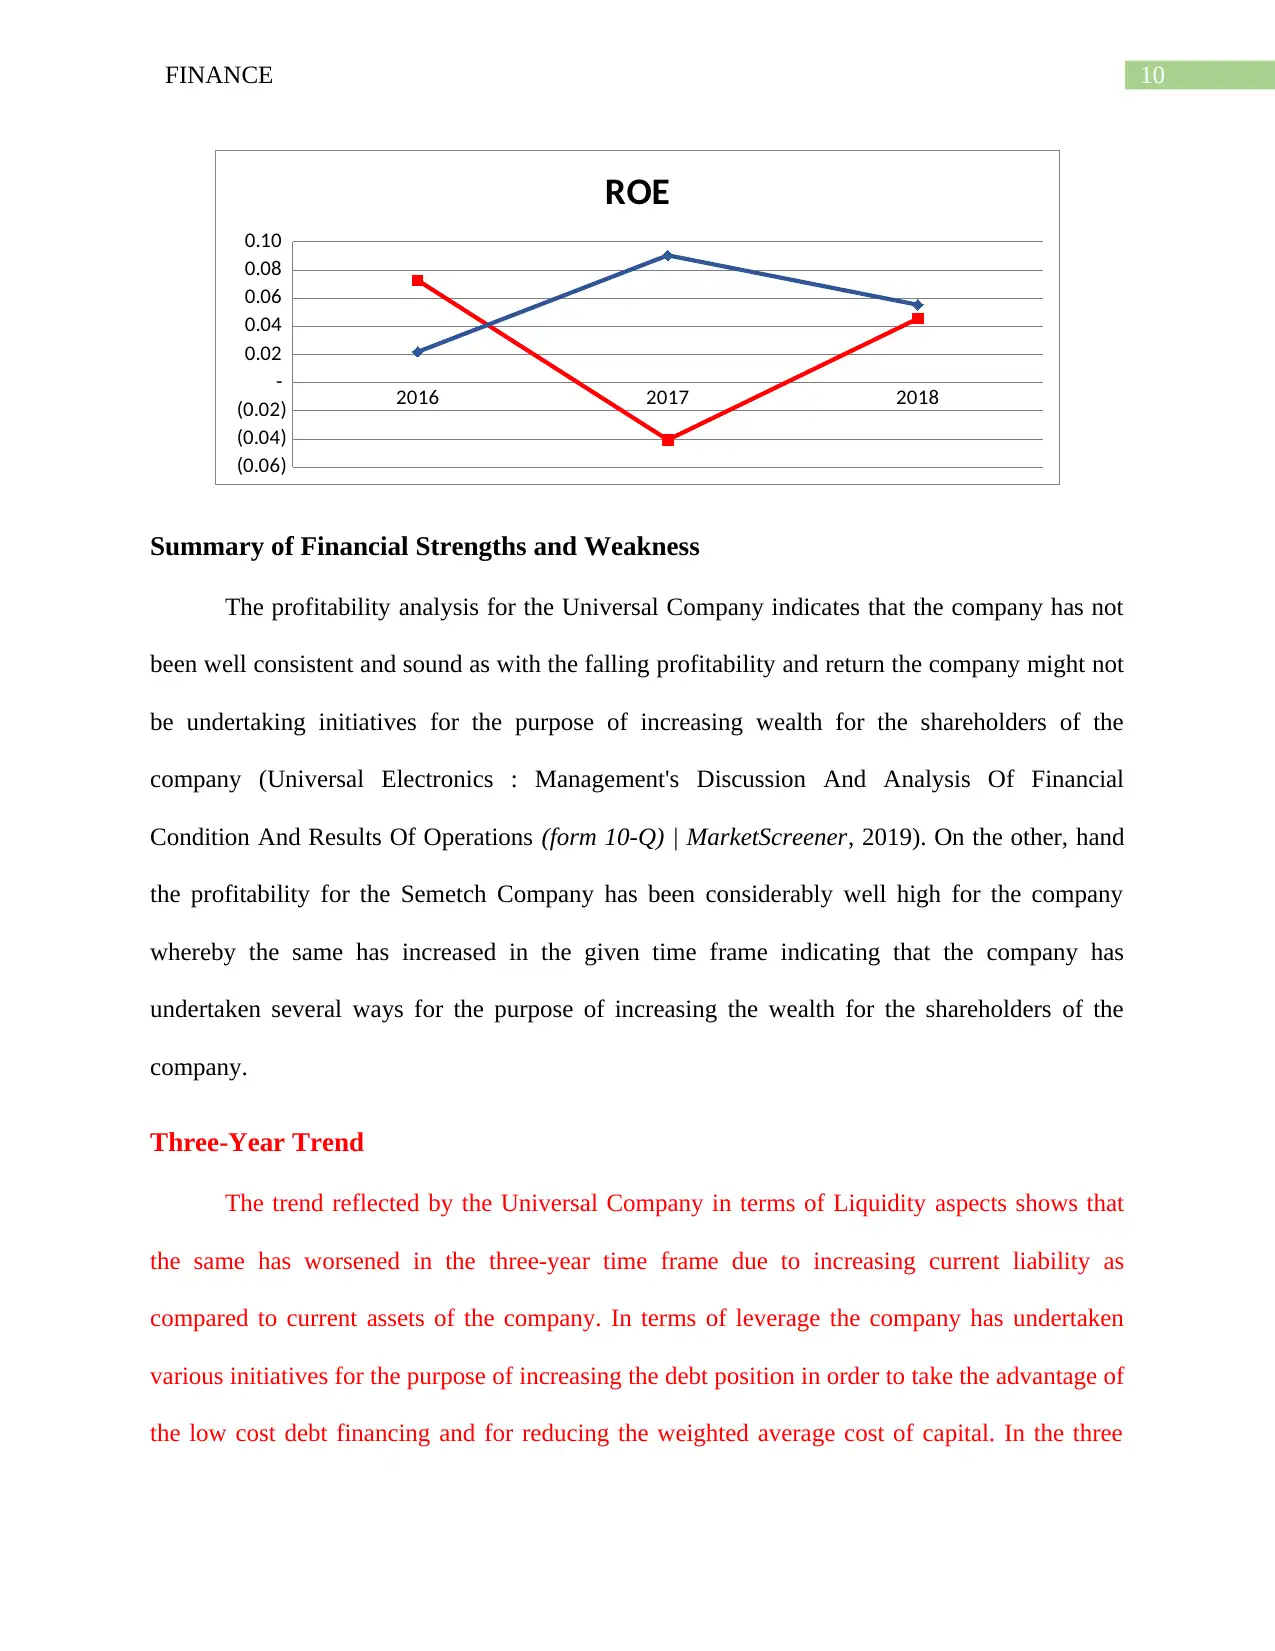
Return on Assets (Net Income/Total Assets): The return on assets indicates that the Universal
Company has well created a volatile and decreasing return on the assets deployed from 4% in
2016 to around 2% in the year 2018. On the other hand, the ratio for the Semtech Company has
been around 1% in 2016 and the same has increased to around 3% in the year 2018.
2016 2017 2018
(0.03)
(0.02)
(0.01)
-
0.01
0.02
0.03
0.04
0.05
0.06
ROA
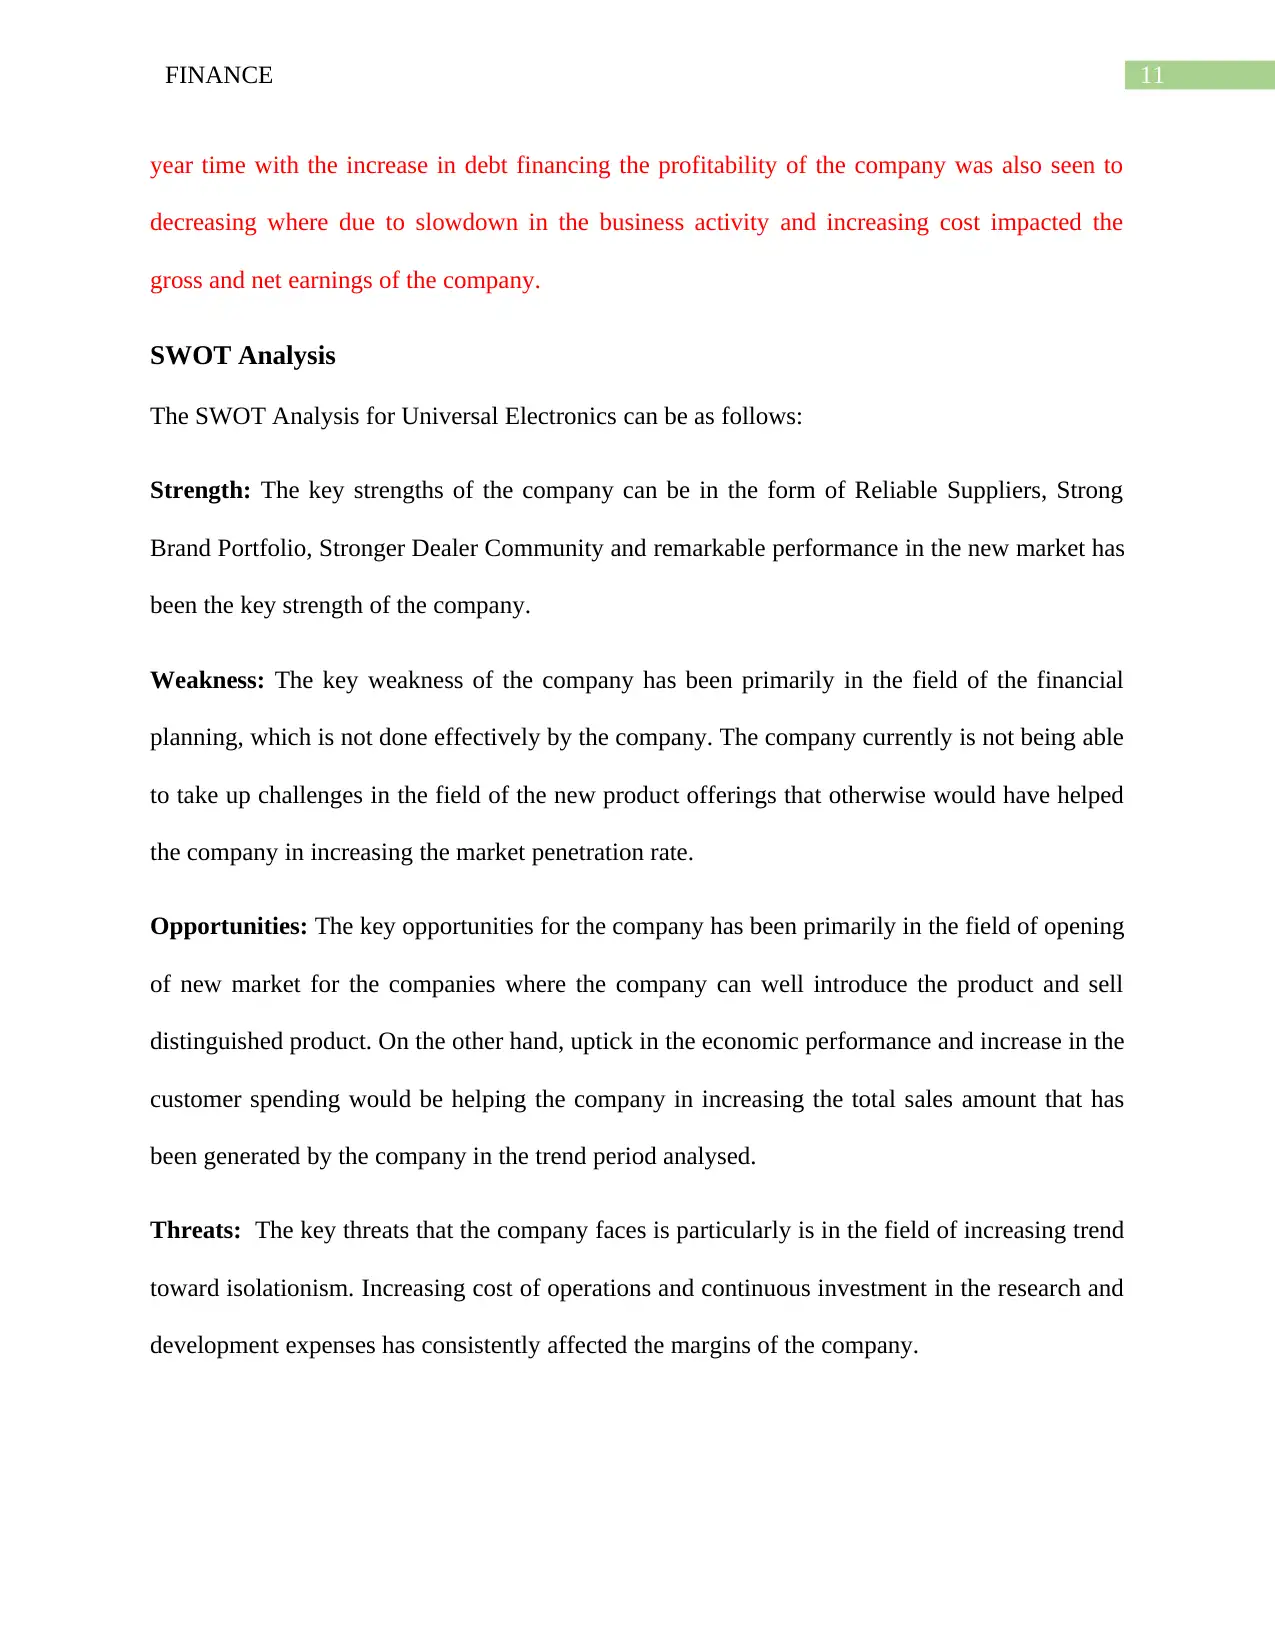
Return On Equity (Net Income/Shareholder’s Equity): The return on equity for the Universal
Company has been around 7% in the year 2016 and the same has slightly decreased for the
company to around 5% in the year 2018 which was due to falling profitability. On the other
hand, the ROE for Semtech Company has been around 2% in 2016 and the same increased to
around 6% in the year 2018.
2016 2017 2018
-
1.00
2.00
Univers
al
Electron
ics
Profit Margin
Return on Assets (Net Income/Total Assets): The return on assets indicates that the Universal
Company has well created a volatile and decreasing return on the assets deployed from 4% in
2016 to around 2% in the year 2018. On the other hand, the ratio for the Semtech Company has
been around 1% in 2016 and the same has increased to around 3% in the year 2018.
2016 2017 2018
(0.03)
(0.02)
(0.01)
-
0.01
0.02
0.03
0.04
0.05
0.06
ROA
Return On Equity (Net Income/Shareholder’s Equity): The return on equity for the Universal
Company has been around 7% in the year 2016 and the same has slightly decreased for the
company to around 5% in the year 2018 which was due to falling profitability. On the other
hand, the ROE for Semtech Company has been around 2% in 2016 and the same increased to
around 6% in the year 2018.
Paraphrase This Document
Need a fresh take? Get an instant paraphrase of this document with our AI Paraphraser
10FINANCE
2016 2017 2018
(0.06)
(0.04)
(0.02)
-
0.02
0.04
0.06
0.08
0.10
ROE
Summary of Financial Strengths and Weakness
The profitability analysis for the Universal Company indicates that the company has not
been well consistent and sound as with the falling profitability and return the company might not
be undertaking initiatives for the purpose of increasing wealth for the shareholders of the
company (Universal Electronics : Management's Discussion And Analysis Of Financial
Condition And Results Of Operations (form 10-Q) | MarketScreener, 2019). On the other, hand
the profitability for the Semetch Company has been considerably well high for the company
whereby the same has increased in the given time frame indicating that the company has
undertaken several ways for the purpose of increasing the wealth for the shareholders of the
company.
Three-Year Trend
The trend reflected by the Universal Company in terms of Liquidity aspects shows that
the same has worsened in the three-year time frame due to increasing current liability as
compared to current assets of the company. In terms of leverage the company has undertaken
various initiatives for the purpose of increasing the debt position in order to take the advantage of
the low cost debt financing and for reducing the weighted average cost of capital. In the three
11FINANCE
year time with the increase in debt financing the profitability of the company was also seen to
decreasing where due to slowdown in the business activity and increasing cost impacted the
gross and net earnings of the company.
SWOT Analysis
The SWOT Analysis for Universal Electronics can be as follows:
Strength: The key strengths of the company can be in the form of Reliable Suppliers, Strong
Brand Portfolio, Stronger Dealer Community and remarkable performance in the new market has
been the key strength of the company.
Weakness: The key weakness of the company has been primarily in the field of the financial
planning, which is not done effectively by the company. The company currently is not being able
to take up challenges in the field of the new product offerings that otherwise would have helped
the company in increasing the market penetration rate.
Opportunities: The key opportunities for the company has been primarily in the field of opening
of new market for the companies where the company can well introduce the product and sell
distinguished product. On the other hand, uptick in the economic performance and increase in the
customer spending would be helping the company in increasing the total sales amount that has
been generated by the company in the trend period analysed.
Threats: The key threats that the company faces is particularly is in the field of increasing trend
toward isolationism. Increasing cost of operations and continuous investment in the research and
development expenses has consistently affected the margins of the company.
⊘ This is a preview!⊘
Do you want full access?
Subscribe today to unlock all pages.
Trusted by 1+ million students worldwide
1 out of 14
Related Documents


Your All-in-One AI-Powered Toolkit for Academic Success.
+13062052269
info@desklib.com
Available 24*7 on WhatsApp / Email
![[object Object]](/_next/static/media/star-bottom.7253800d.svg)
Unlock your academic potential
Copyright © 2020–2026 A2Z Services. All Rights Reserved. Developed and managed by ZUCOL.