UK CBC Business Development Module: Charts, Graphs, and Interpretation
VerifiedAdded on 2023/03/21
|12
|618
|37
Homework Assignment
AI Summary
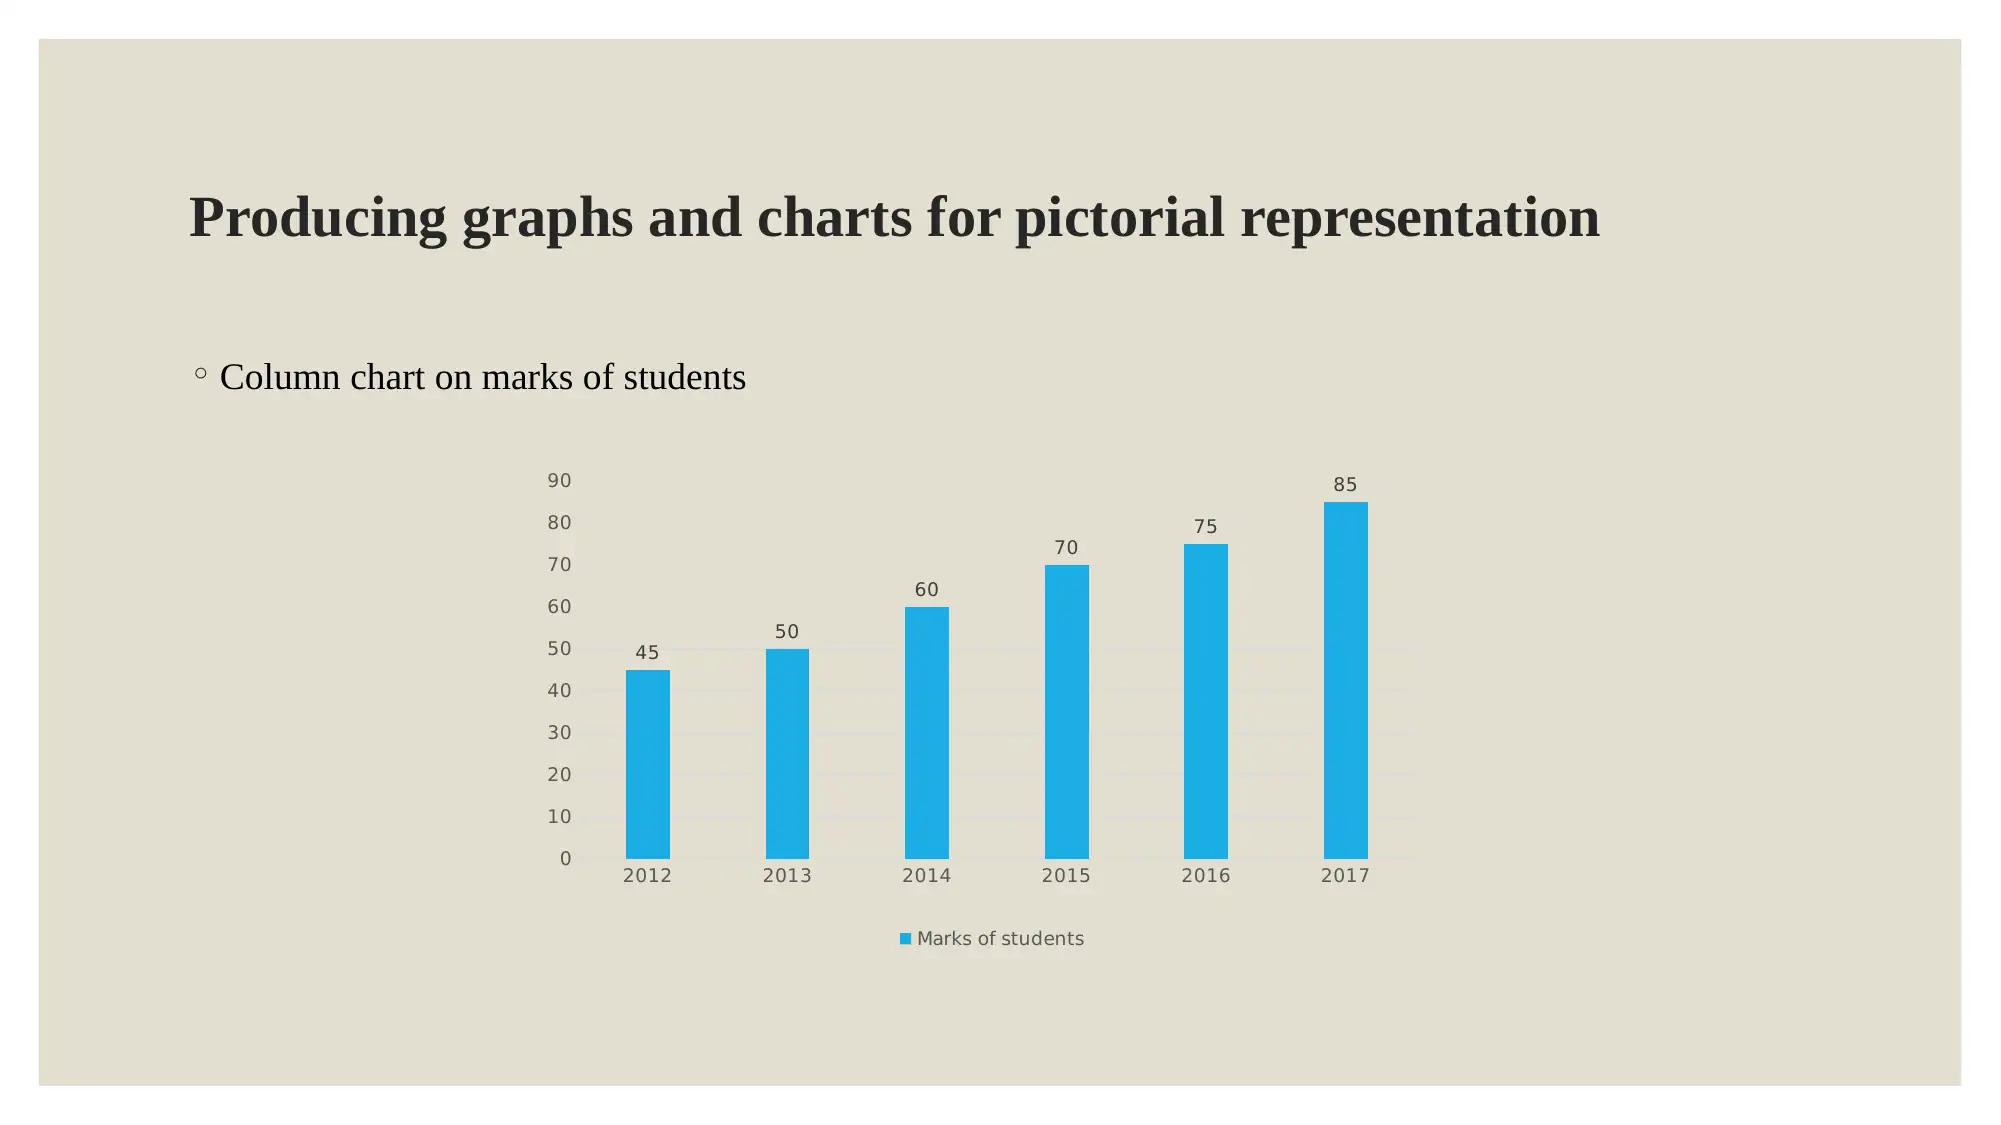
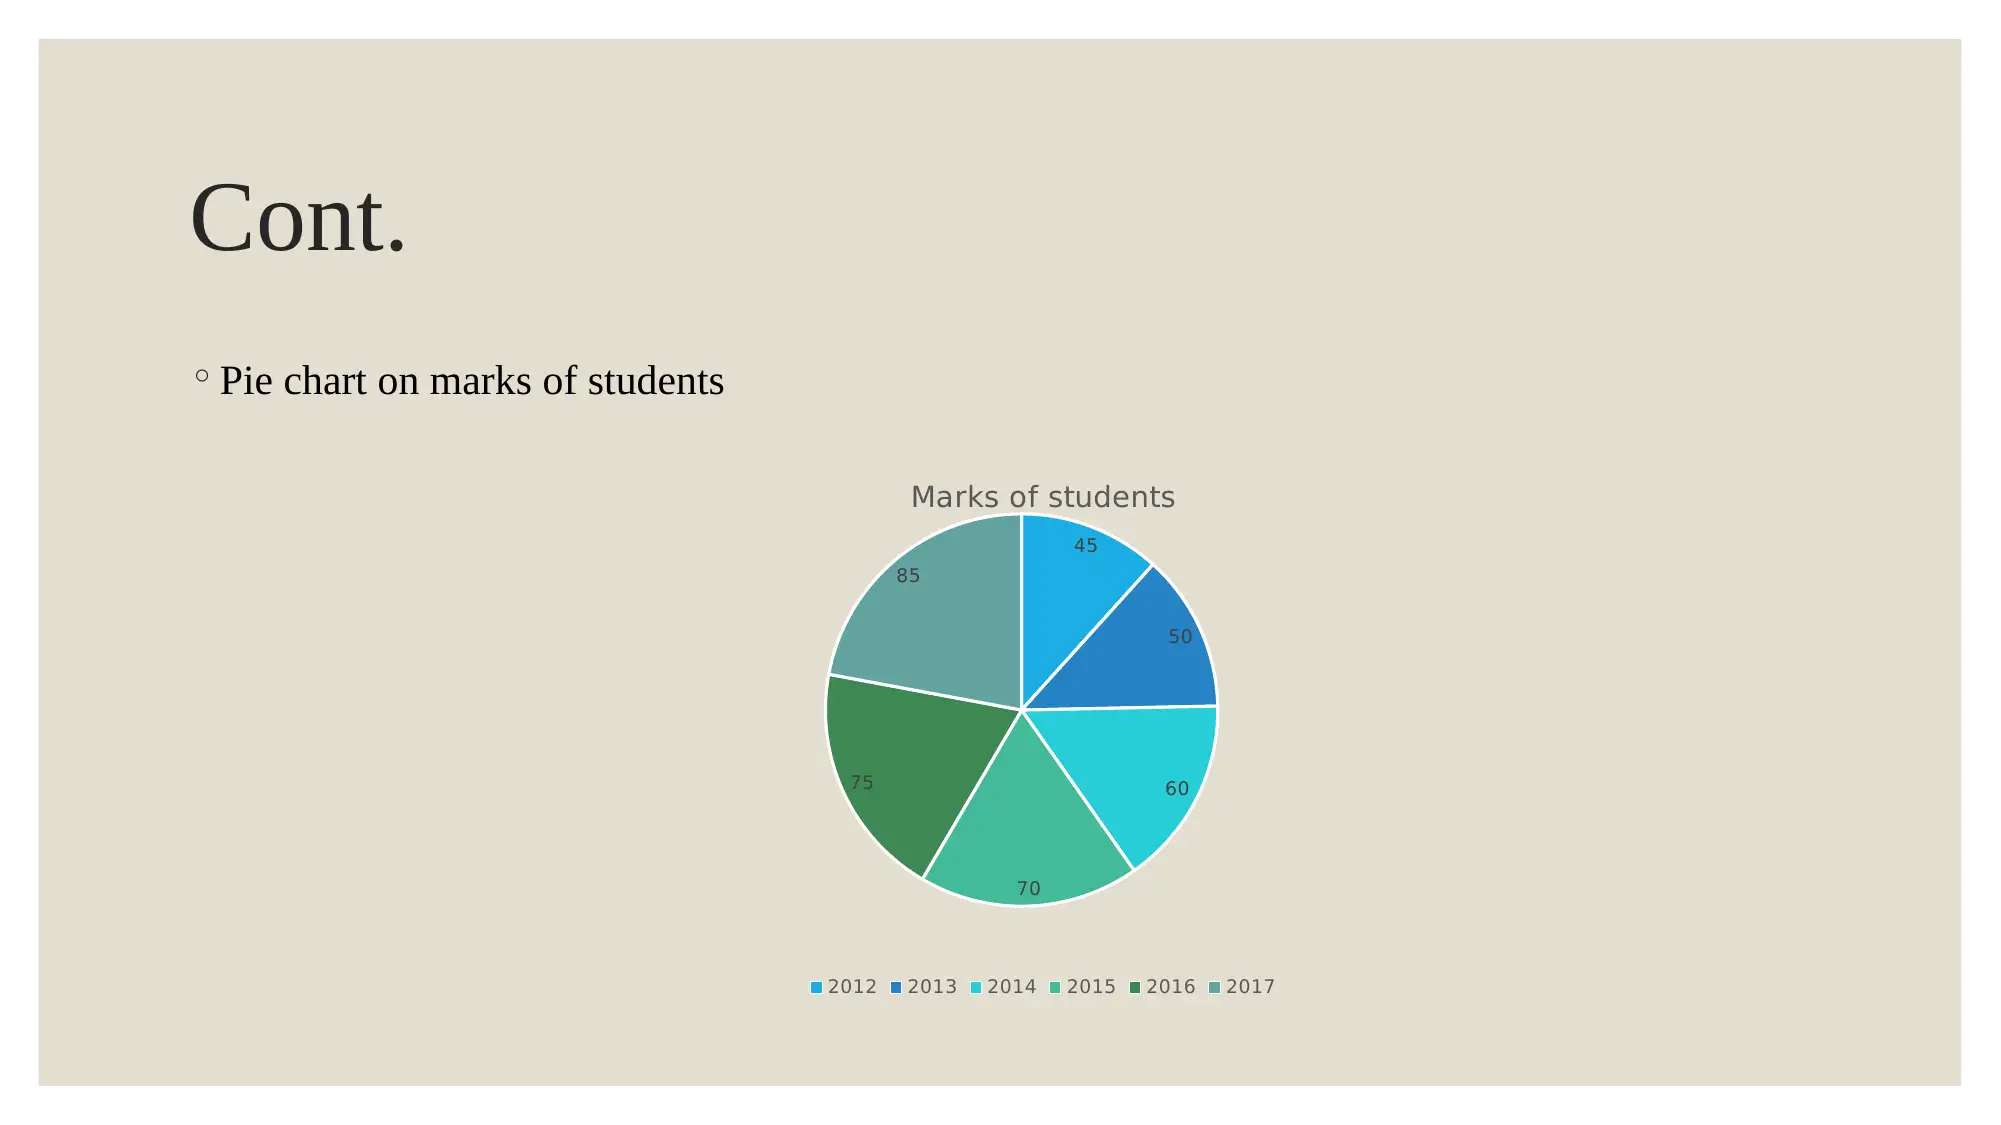
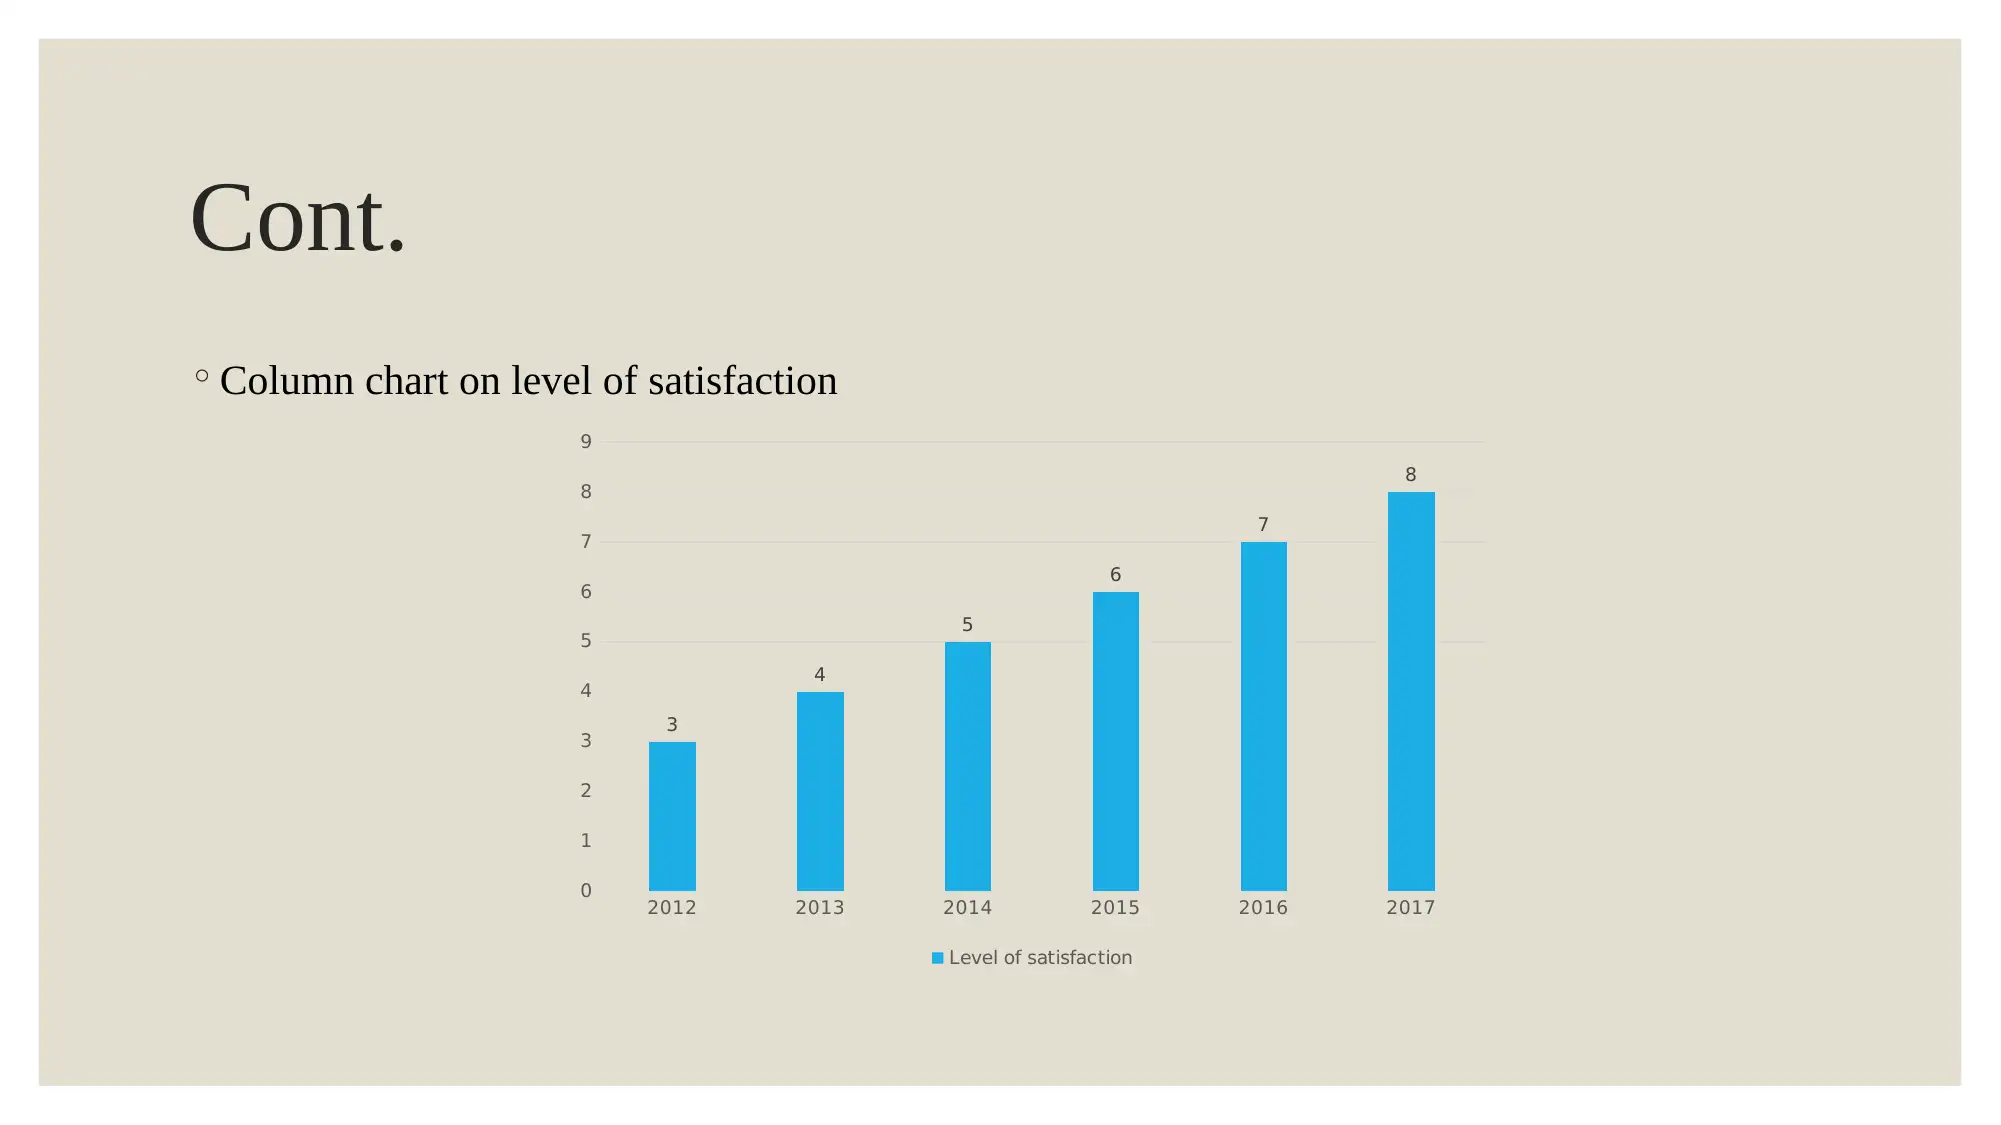
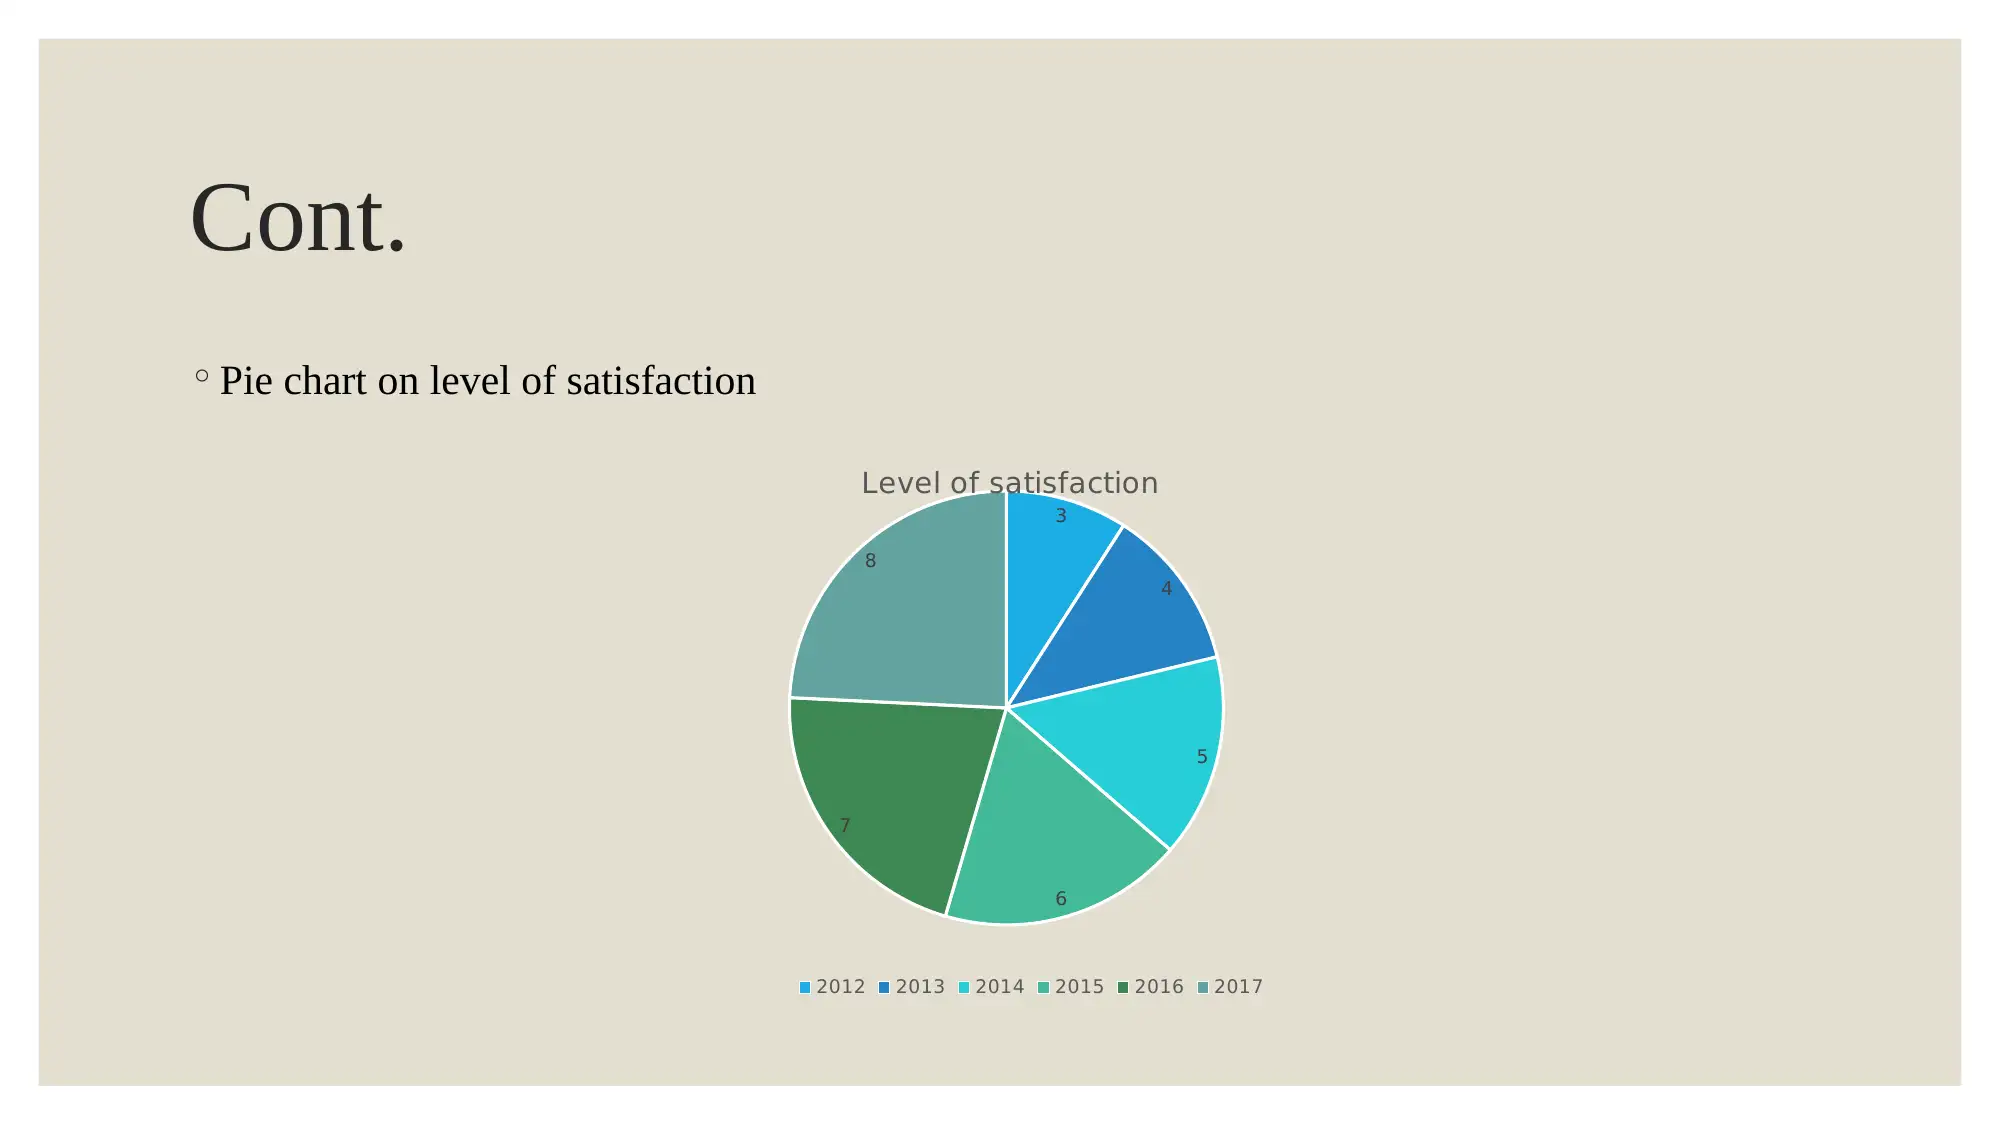
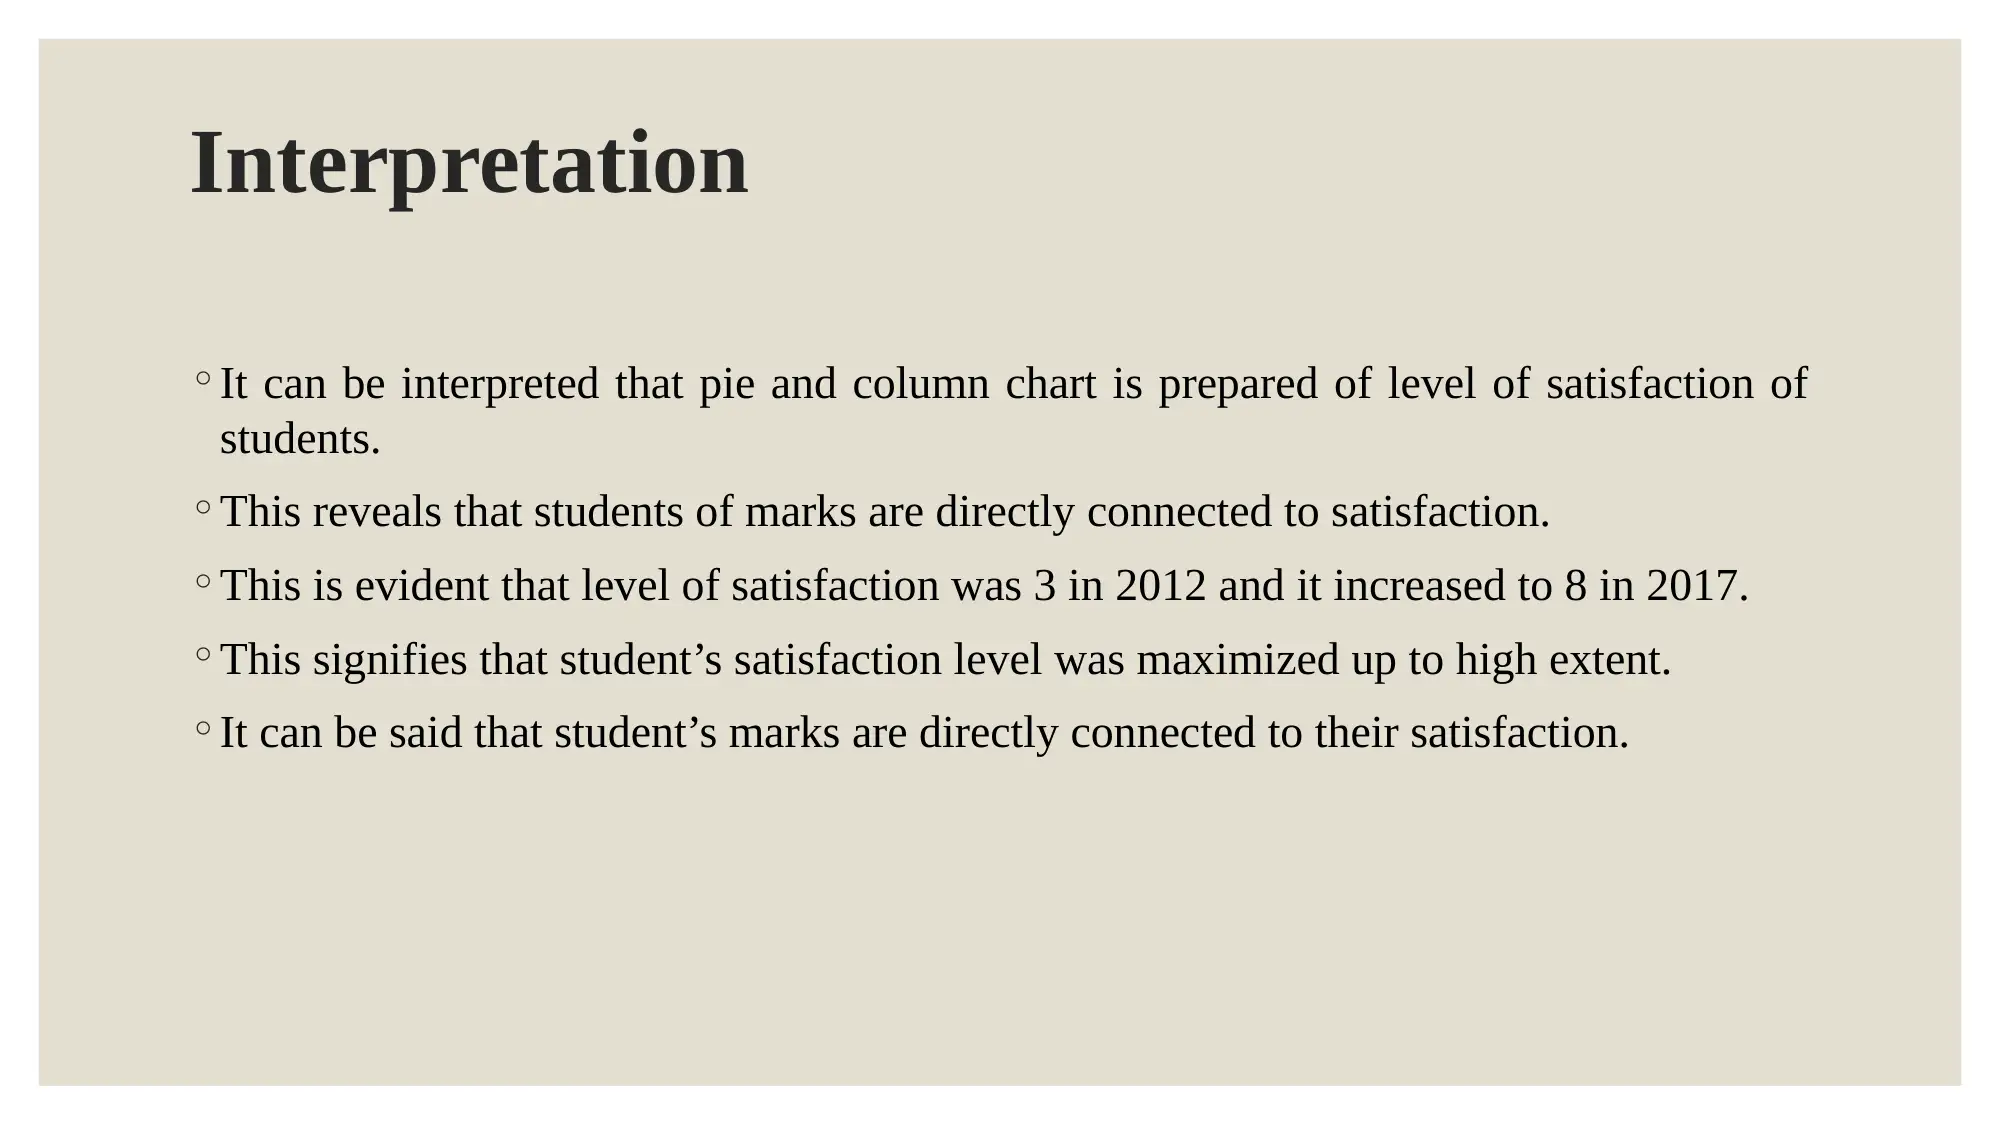
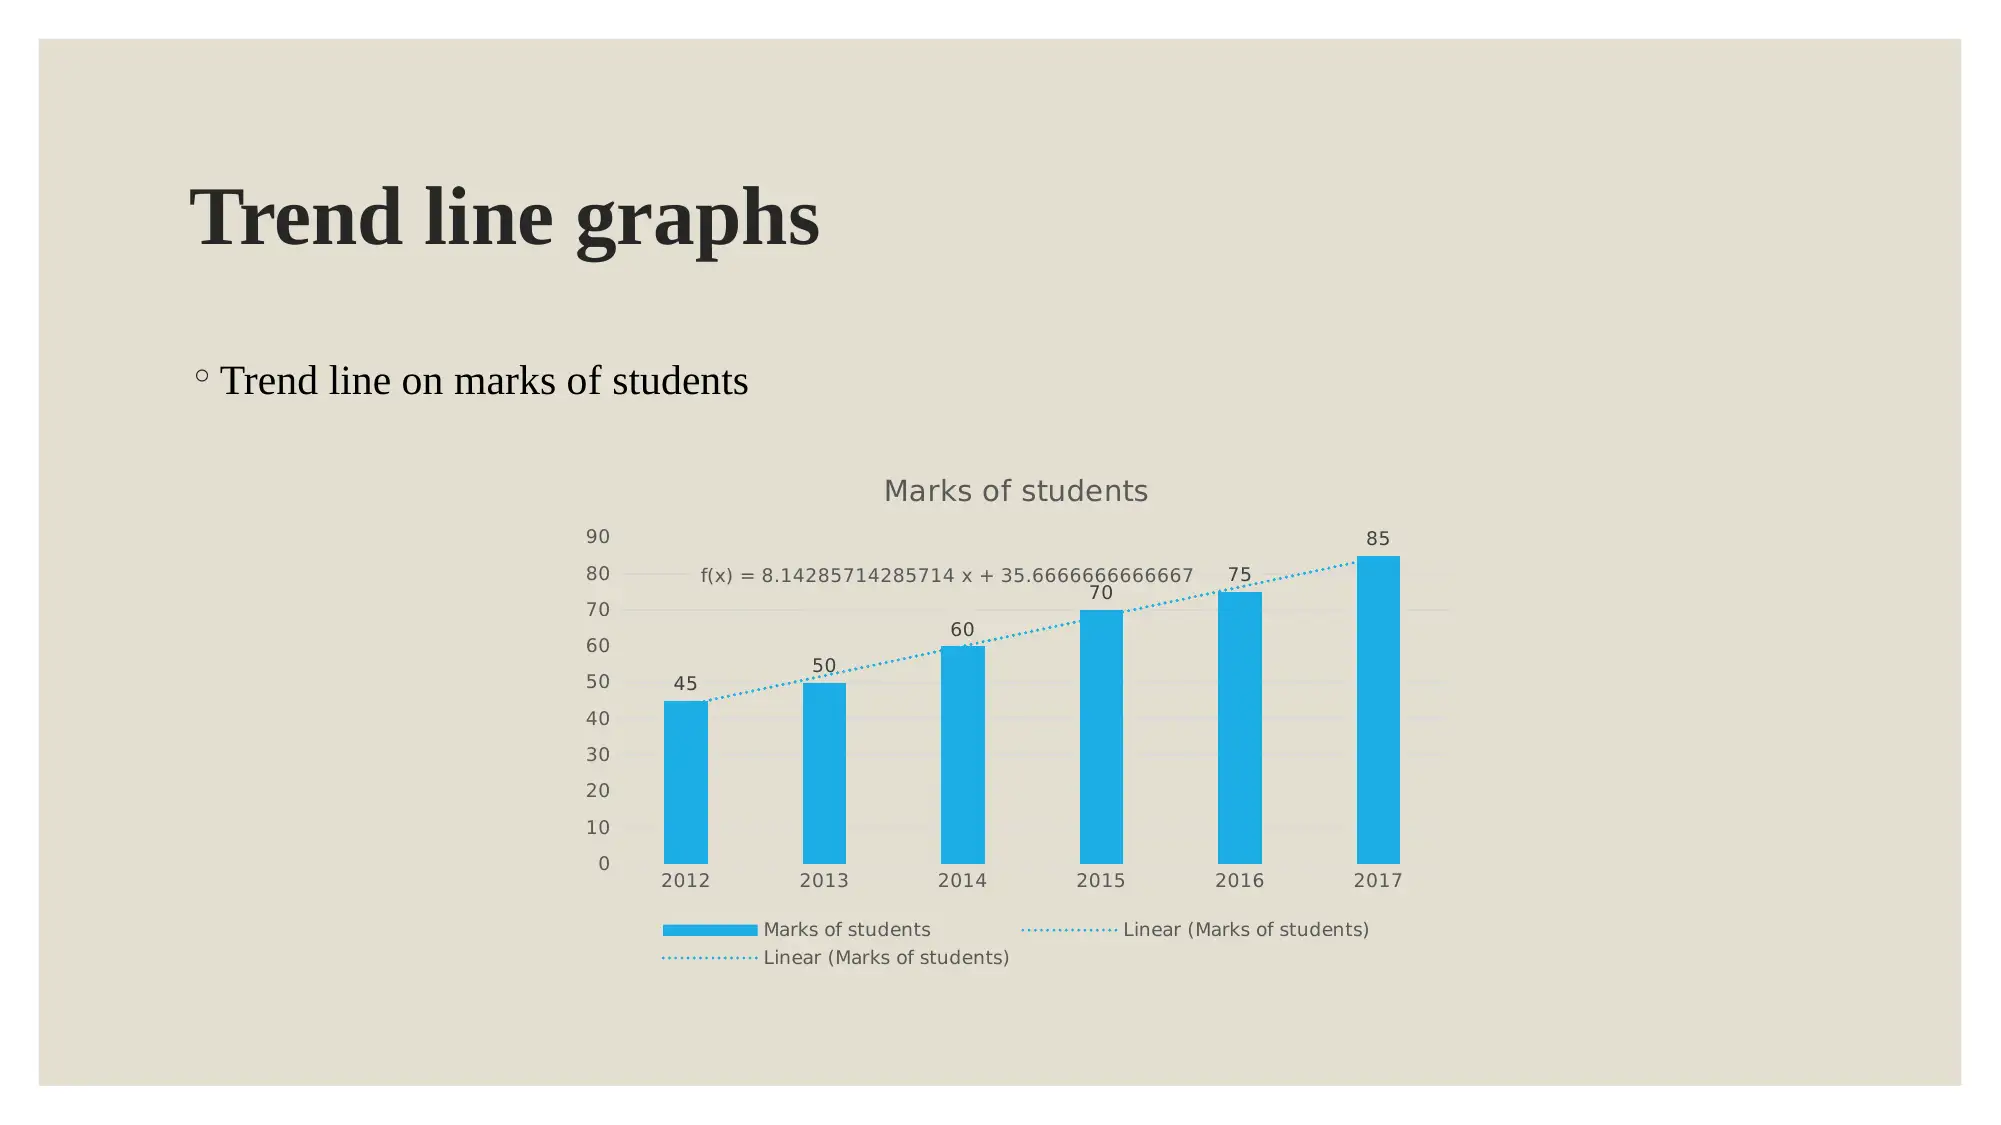
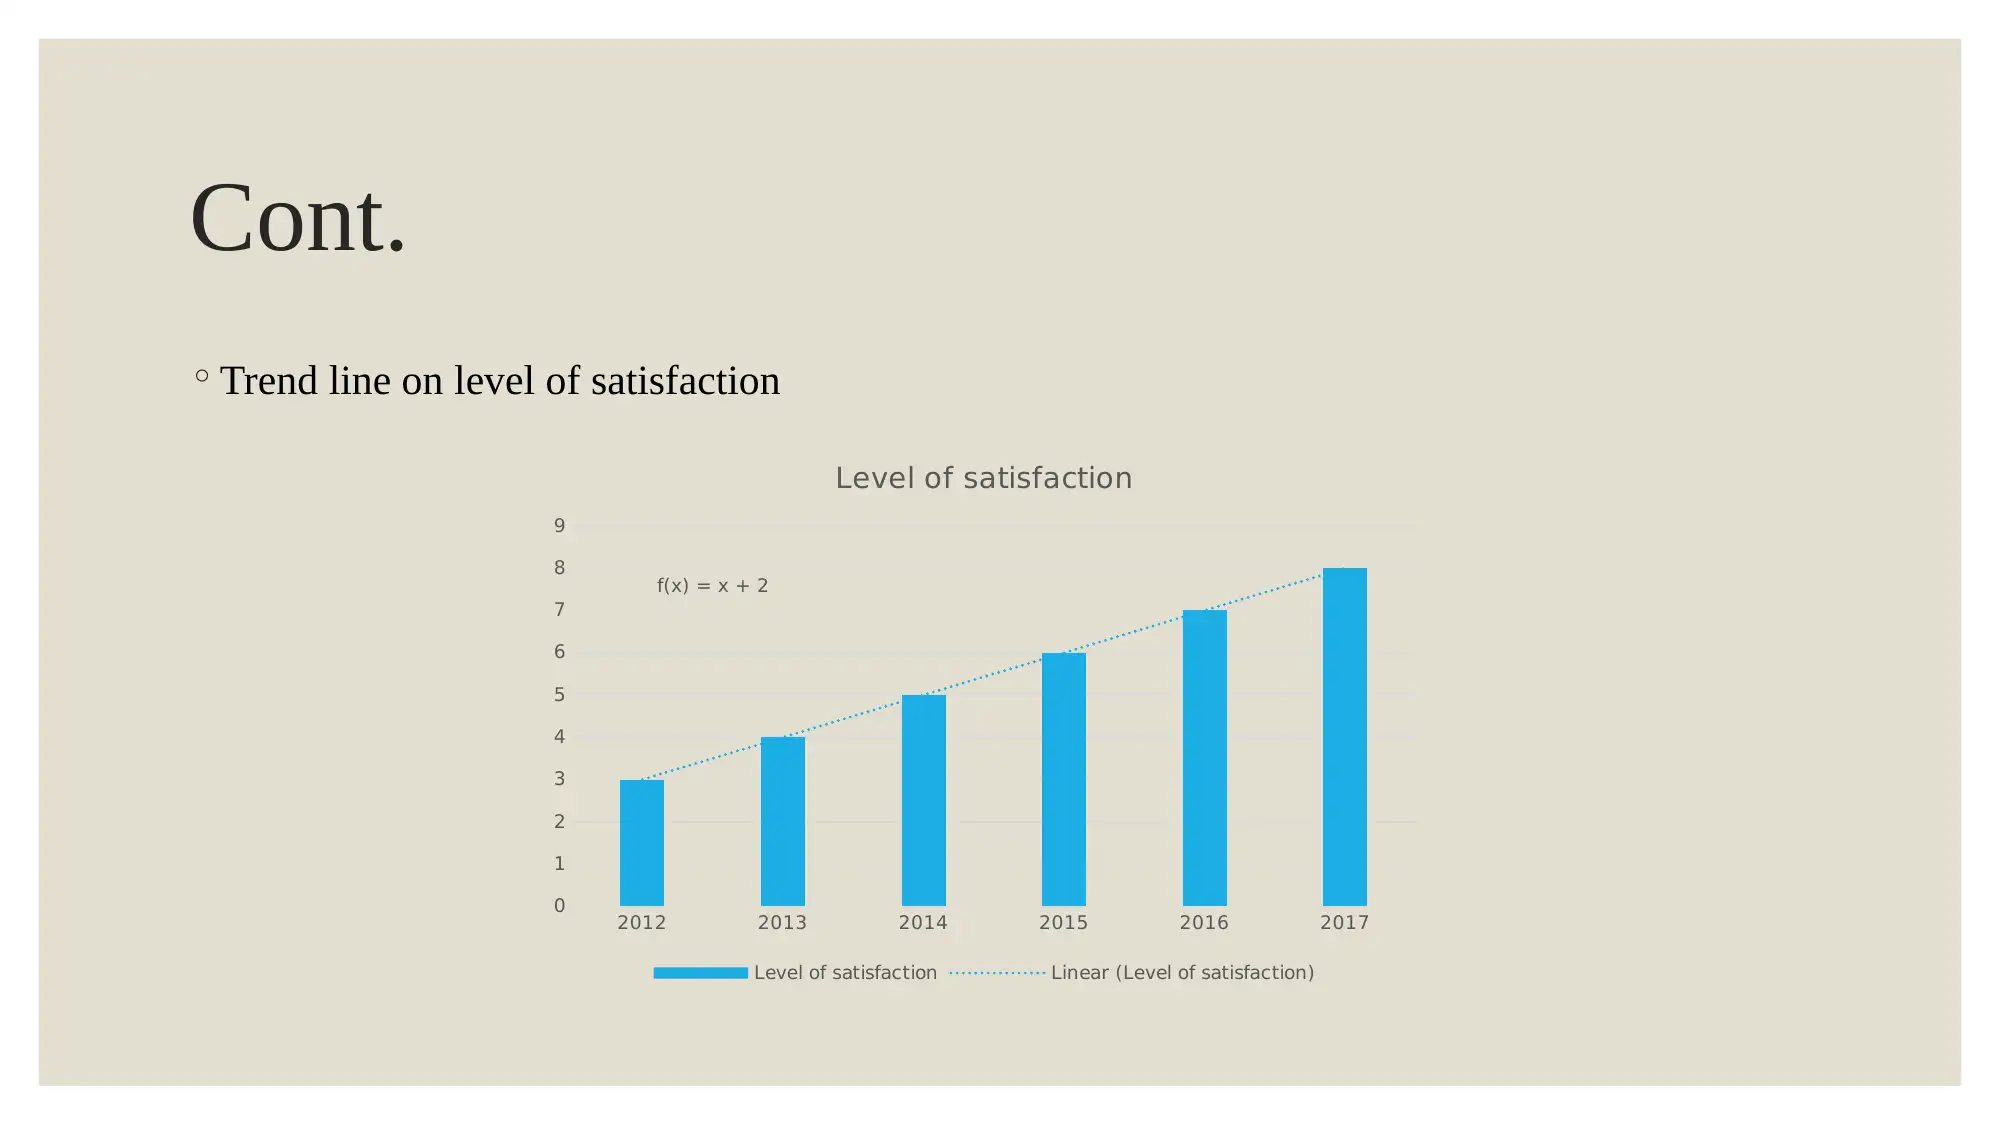
This assignment focuses on the creation and interpretation of various charts and graphs to analyze student performance and satisfaction within a business context. The solution includes column charts and pie charts illustrating marks and satisfaction levels over several years, along with interpretations of the trends observed. Trend line graphs are also provided to visualize the progression of marks and satisfaction over time, further clarifying the relationship between the two factors. The assignment references relevant academic sources, demonstrating a comprehensive approach to data visualization and analysis in business development. The assignment is designed to provide clarity to UK CBC on student performance and satisfaction. This document is available on Desklib, a platform offering study resources.


1 out of 12
Related Documents


Your All-in-One AI-Powered Toolkit for Academic Success.
+13062052269
info@desklib.com
Available 24*7 on WhatsApp / Email
![[object Object]](/_next/static/media/star-bottom.7253800d.svg)
Copyright © 2020–2026 A2Z Services. All Rights Reserved. Developed and managed by ZUCOL.