Business Decision Making Report: UK CBC Student Satisfaction Analysis
VerifiedAdded on 2020/06/06
|18
|3476
|37
Report
AI Summary
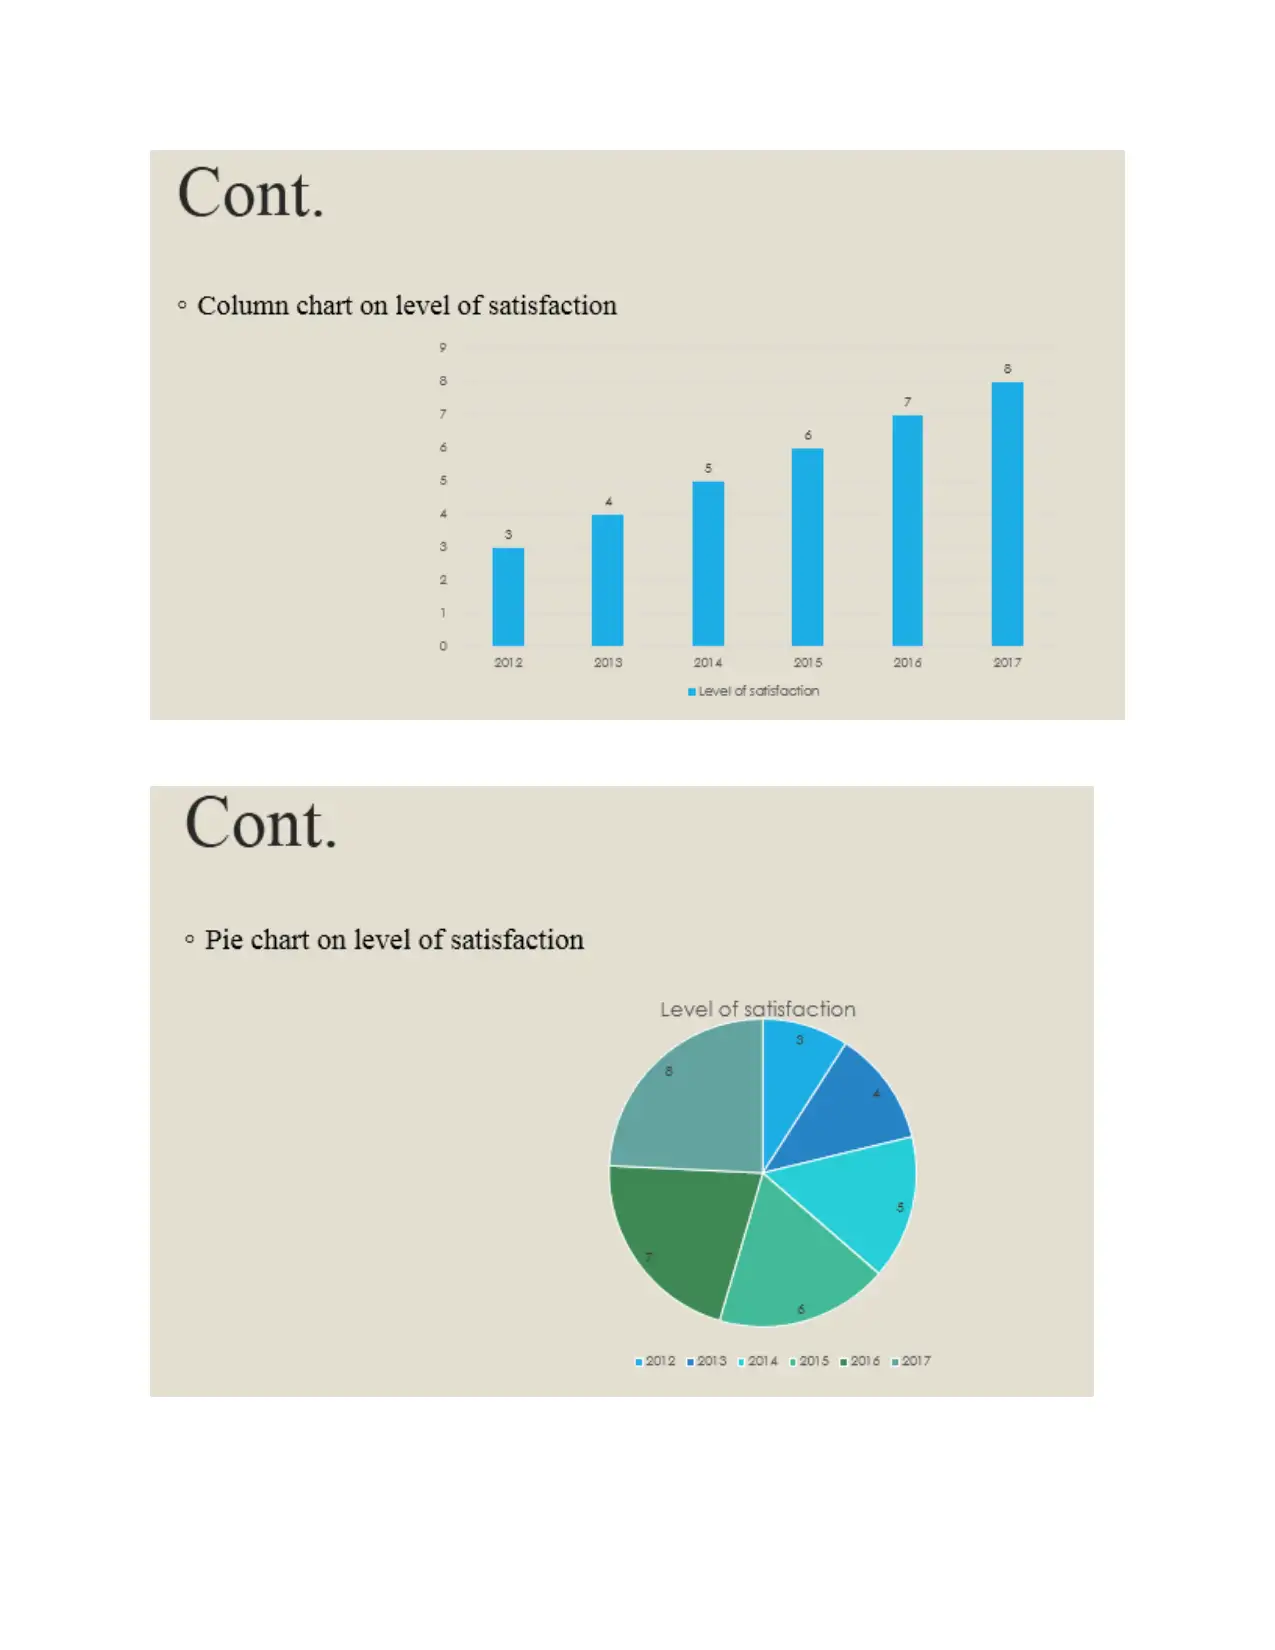
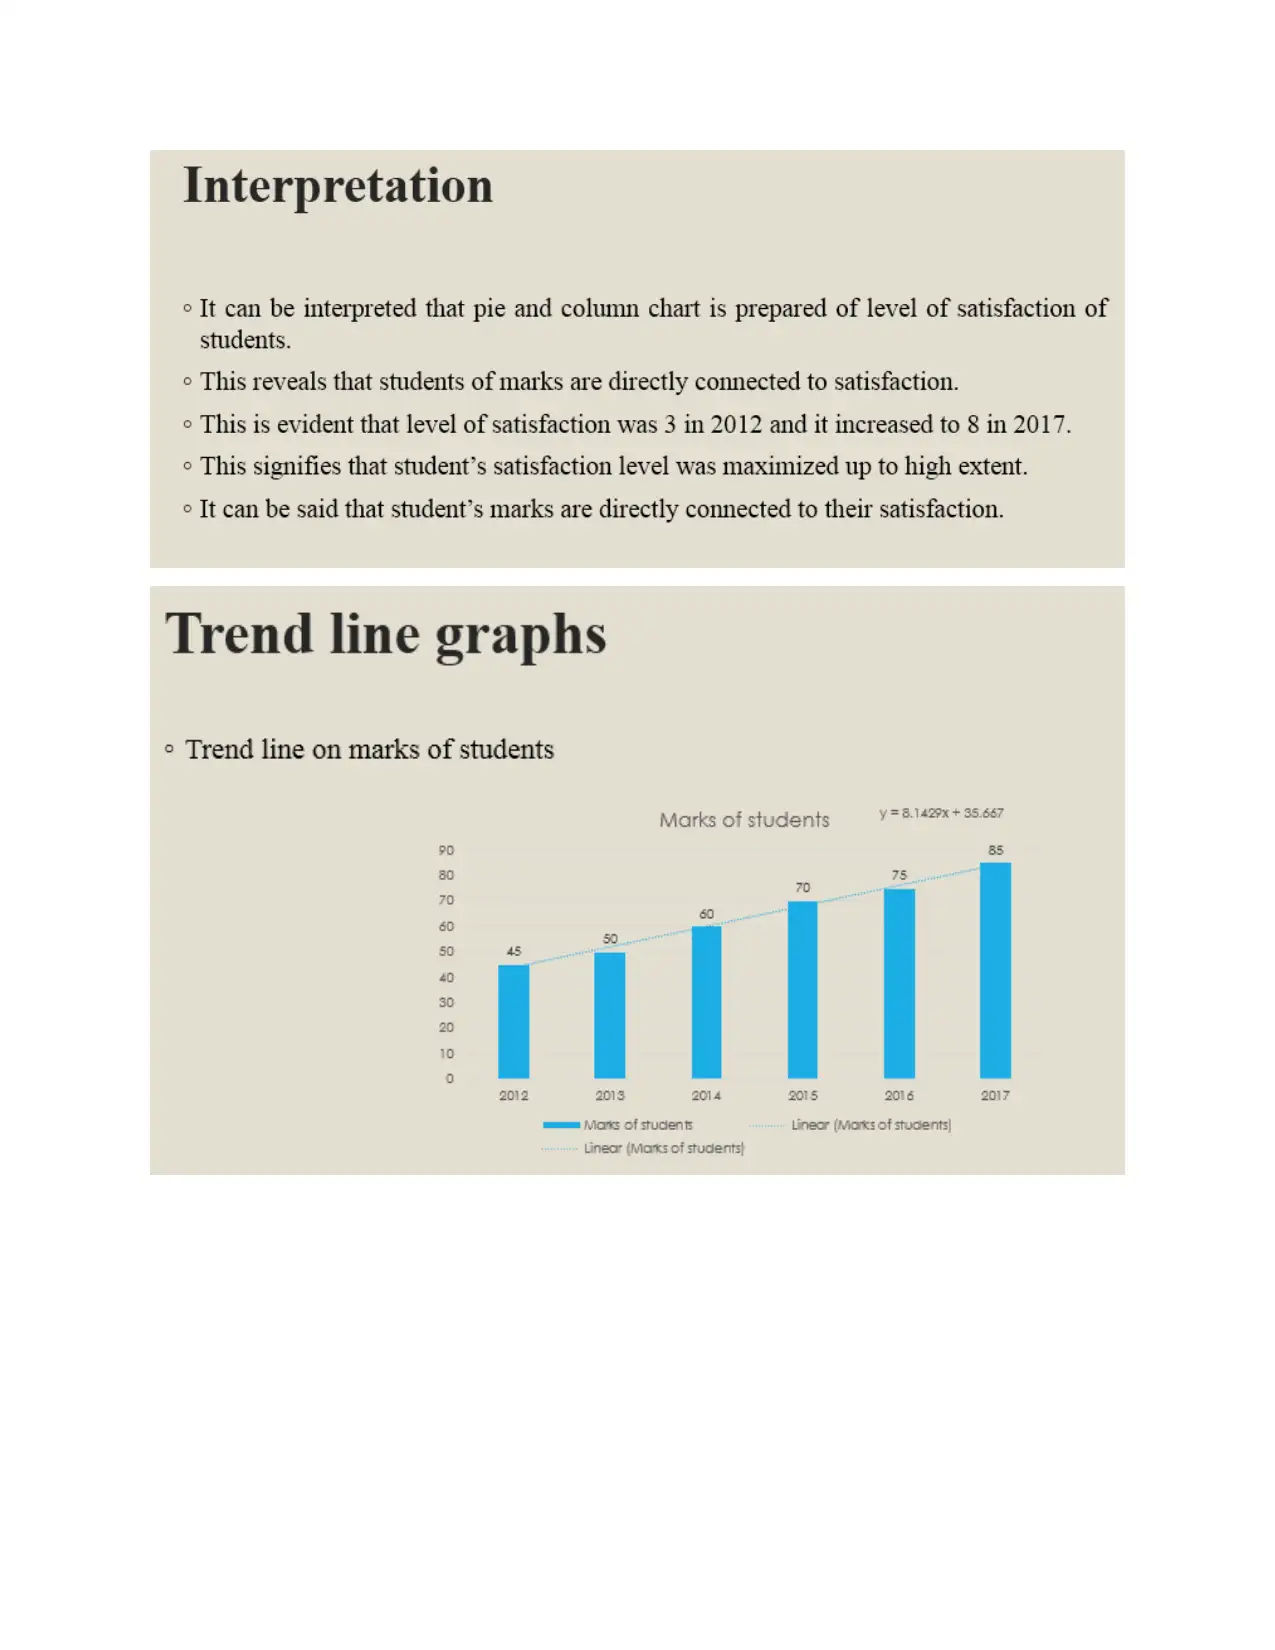
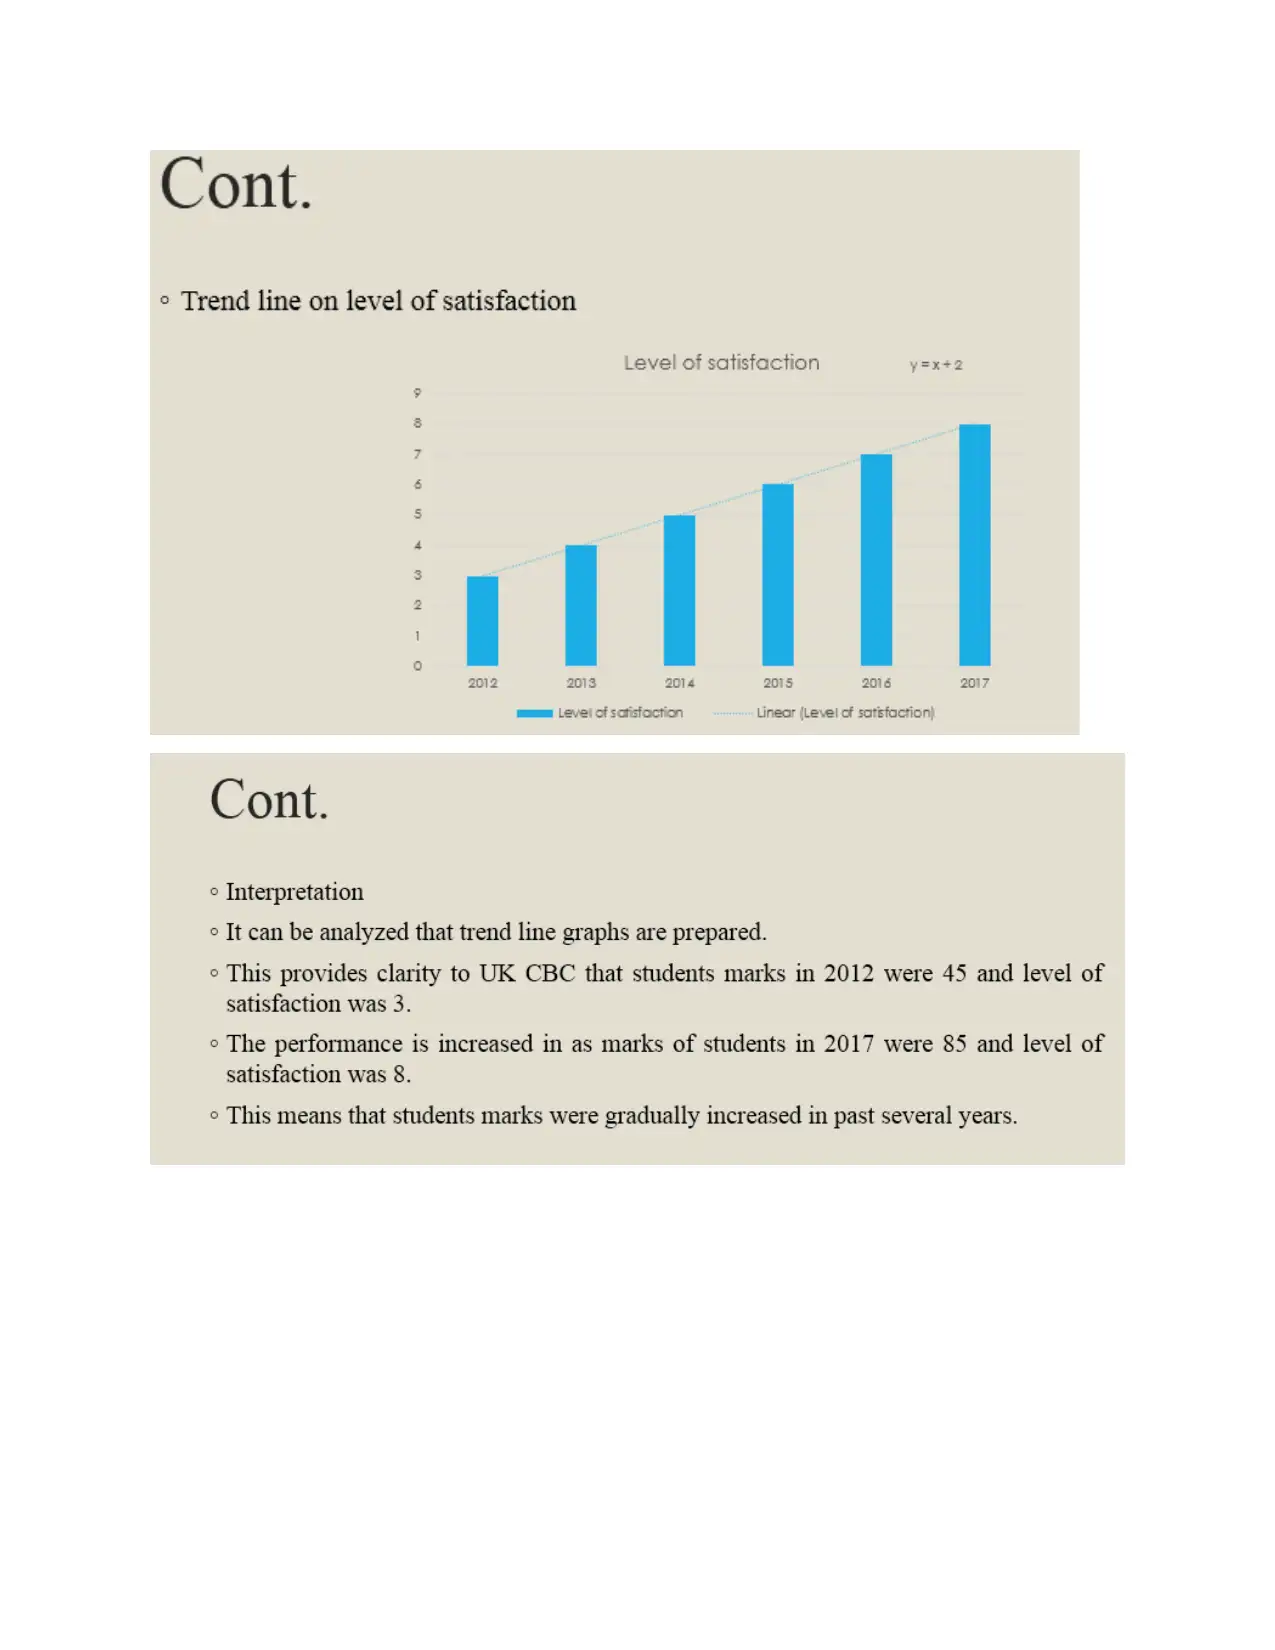
This report provides a comprehensive analysis of business decision-making at UK CBC, focusing on student satisfaction. The research employs a mixed-methods approach, utilizing both primary and secondary data. Primary data was collected through online questionnaires distributed to a sample of students, while secondary data was gathered from published journals and books. The report details the planning and execution of data collection, including the formulation of a sampling frame and survey methodology. Statistical techniques, such as descriptive statistics (mean, median, mode, standard deviation), quartiles, percentiles, and correlation, are applied to analyze the collected data. The findings reveal insights into student perceptions regarding the impact of exam marks on their careers and their overall satisfaction levels with the institution. The report also incorporates visual representations of data through graphs and charts, alongside a formal business report format. Furthermore, it explores information processing tools, including Gantt charts and critical path analysis for project management, and evaluates capital investment techniques. The report concludes with recommendations based on the analysis and findings.

Business Decision Making
Paraphrase This Document
Need a fresh take? Get an instant paraphrase of this document with our AI Paraphraser

Table of Contents
INTRODUCTION.......................................................................................................................................3
TASK 1.......................................................................................................................................................3
1.1 Plan for collection of primary and secondary data.......................................................................3
1.2 Formulating sampling frame and survey methodology......................................................................3
1.3 Questionnaire.....................................................................................................................................4
TASK 2.......................................................................................................................................................5
2.1 Descriptive statistics..........................................................................................................................5
2.2 Providing summary of information gathered from questionnaire......................................................6
2.3 Providing measures of dispersion......................................................................................................6
2.4 Quartile, percentile and correlation....................................................................................................7
TASK 3.......................................................................................................................................................7
3.1 Producing graphs and charts for pictorial representation...................................................................7
3.2 Trend line graph................................................................................................................................9
3.3 Information......................................................................................................................................10
3.4 Formal business report.....................................................................................................................10
TASK 4.....................................................................................................................................................11
4.1 Information processing tools for enhanced decision making...........................................................11
4.2 Gantt chart and critical path of project.............................................................................................12
4.3 Capital investment techniques for evaluating project.......................................................................13
CONCLUSION.........................................................................................................................................14
REFERENCES..........................................................................................................................................14

INTRODUCTION
Business decision making plays crucial role in every company. Present report deals with research
of UK CBC, which is large institution providing advanced knowledge to students. QAA (Quality Assurance
Agency) is provided with report regarding quality of education imparted by UK CBC and satisfaction level
attained by the students. The report also focuses on various statistical techniques to assess belief of
students. Moreover, questionnaires are prepared for collecting primary data and for secondary data,
journals are taken. Furthermore, investment appraisal techniques are also explained in effective way.
Thus, overall research is being carried out by analyzing satisfaction level of students with high grades in
effectual manner. Moreover, themes are made in order to assess correlation of marks of students with
that of level of satisfaction in the best possible way.
TASK 1
1.1 Plan for collection of primary and secondary data
The data is required to be gathered in order to identify the satisfaction level of students of
UK CBC in effective way so that college may be able to analyze things in the best possible
way. This will help university to take better and effective steps in order to provide best
services to students and attain their level of satisfaction as well. The primary data is termed
as first-handed data, which is gathered for the first time by the researcher. This data is
required by UK CBC so that it may be able to solve issues of students and provide them
satisfaction level in the best possible way. Primary data will be gathered through online
questionnaires and students will be asked to respond within stipulated time. This would
extract meaningful information quite effectively. Survey will be conducted to assess and
identify expectation of students and satisfaction level of them (Stine and Foster, 2017).
The respondents will be 20 through which research will be conducted and simple random
sampling will be used. Moreover, secondary data is that which is already used for previous
research and can be used by another researcher. This data will be collected through books,
journals that are published on internet and then meaningful information can be gathered with
much ease. Thus, by collecting primary data through questionnaires and secondary data
through published journals, UK CBC can easily carry out research in effectual manner.
1.2 Formulating sampling frame and survey methodology
Survey methodology- This is essentially required in order to conduct survey in the best
possible way. Survey methodology used in this research will be providing online questionnaires
to students and then information can be gathered from them in effective way. This will help UK
CBC to have effective information about several issues of students and then steps can be taken to
improve the same. Online questionnaires are fast and useful method which can be gathered quite
easily. Moreover, this method saves time of researcher and results can be attained with much
ease. For issuing online questionnaires, it is required researcher will contact administration unit
of college and then respective mail id of students will be taken. Thus, questionnaires will be send
and information can be gathered quite effectually.
⊘ This is a preview!⊘
Do you want full access?
Subscribe today to unlock all pages.

Trusted by 1+ million students worldwide

Sampling frame- in order to conduct any research, sampling frame is required firstly. In
this research, simple random sampling will be used in effective manner. This method is
appropriate as it is quite difficult to include each and every data to initiate research and as such,
sample of 20 students will be used which will be representative all the students of UK CBC. This
will help researcher to have adequate information and time will also be saved by using this
method. Thus, both survey methodology and sampling frame will help UK CBC to gather
required information with much ease (Thirumalai and Senthilkumar, 2017).
1.3 Questionnaire
Questionnaire
Demographic information
Age
Name
Q1. From the following associations, how you are connected to UK CBC?
Domestic Student
International Student
Others
Q2. How long you are linked to the institution?
0-1 year
1-4 years
4-8 years
8 years or more
Q3. Are you satisfied with the guidance given by experienced staff of UK CBC?
Yes
No
Q4. Are you satisfied with teaching environment of college?
Highly satisfied
Moderately satisfied
Dissatisfied
Highly dissatisfied
Q5. Do you think UK CBC’s teaching staff give quality education?
Agree
Disagree
Q6. Will you propose other students to take admission in the institution as it imparts advanced
technical education?
Yes
No
Probably
Others
Q7. Do up to date books and journals are provided in the library of UK CBC?
Yes
No
Q8. Do you think that marks obtained in exams affect your career?
Yes
No
Paraphrase This Document
Need a fresh take? Get an instant paraphrase of this document with our AI Paraphraser

Q9. Are teachers effectively resolving your problems?
Yes
No
Q10. Provide your satisfaction level with the college?
Negative
Positive
Neutral
Q11. Please share your valuable suggestions for improving college activities and to impart
advanced knowledge and quality education…
TASK 2
2.1 Descriptive statistics
Descriptive statistics are provided which help to analyze gathered data in effective
manner. In this regard, mean, median and mode are calculated to assess information. Mean is an
average value of whole data set. Whereas, median is the mid value of data set and mode is the
value which most of number of times in the data.
Respondents (in total)
Do you think
that marks
obtained in
exams affect
your career?
Provide your satisfaction level
with the college?
1 1 3
2 2 1
3 1 2
4 2 1
5 1 3
6 1 1
7 1 1
8 1 1
9 1 3
10 2 3
11 2 1
12 1 2
13 2 1
14 2 1
15 1 1
16 1 1
17 1 3
18 2 3
19 1 1

20 2 2
Mean value 1.4 1.75
Median value 1 1
Mode 1 1
Standard deviation 0.50 0.91
2.2 Providing summary of information gathered from questionnaire
Theme 1- Marks obtained in exams affects career
It can be interpreted from the statistical techniques that students believe that marks
attained in exams are in direct relation to their careers. They think that higher grades obtained
have more enhanced career growth and as such, advanced knowledge needs to be imparted to
them in order to attain efficiency for scoring high marks. This is evident from the fact that
median value extracted out is 1 which means that almost half of student’s population think that
higher grades are required for successful growth. Moreover, mode value is also 1 which indicates
that they are much satisfied when high marks are attained. UK CBC is required to implement
well-structured strategies such as weekly class test and many other to help students in scoring
good grades (Wei, 2016).
Theme 2- Level of satisfaction
Students’ level of satisfaction as obtained by the descriptive statistics is overall neutral.
This is evident from the fact that mean value extracted is 1.75 which clarifies students have
neutral experiences. This implies that they have neither positive nor negative views about the
institution. Moreover, value of median is one, which implies that students have positive views
about UK CBC and is quite good for the college. In relation to this, mode highlights value of 1
which also signifies that UK CBC is esteemed institution and imparting quality education to
students in maximizing their level of satisfaction level up to high extent.
2.3 Providing measures of dispersion
Particulars Theme 1 Theme 2
Standard deviation 0.50 0.91
Measures of dispersion is quite useful in evaluating relationship between variables in the
best possible way. UK CBC can evaluate student’s preferences and as such, research can be
accomplished quite effectually (Zeng, Chen and Li, 2016). It can be analyzed from the data that
standard deviation calculated for both the themes is .50 for first one and .91 for next question.
This implies that mean will deviate by .50 in the future. On the other hand, it can be analyzed
that standard deviation obtained is .91 for second theme which is level of satisfaction of students.
It implies that level of satisfaction is much higher than other theme. This signifies that UK CBC
is required to entail extra curriculum in syllabus so that students may attain higher grades and
advanced knowledge may be imparted as well.
⊘ This is a preview!⊘
Do you want full access?
Subscribe today to unlock all pages.

Trusted by 1+ million students worldwide

2.4 Quartile, percentile and correlation
Computation of Quartile
Particulars
(Quartile) Theme 1 Theme
2
1 1 1
2 1 1
3 1.75 2.75
Computation of Percentile
Particulars
(Percentile) Theme 1 Theme
2
1 1 1
2 1 1
3 1.75 2.75
Correlation, percentile and quartile are effective techniques in assessing variability
among data in the best possible way. Quartile is a method, which divides data in three equal parts
and as such, provides variability with much ease. It can be seen that quartile has been calculated
for various themes and it can be analyzed difference between the same. On the other hand,
percentile is also carried out by various percentages such as 25, 50 and 75 to assess collected
data in the best possible way (Rao and Tilt, 2016).
Correlation is another useful statistical technique, which assess relation between two
variables under the study. This is effectual technique, which is used to analyze whether there is
relation between variables, or not. In this manner, correlation can be categorized into positive or
negative correlation. Positive correlation means that there is perfect and positive correlation
between variables and have significant. On the other hand, negative correlation states that there
is no correlation between variables and if one factor increases, other will decrease. Thus, it can
be said that correlation does not exist in this study.
TASK 3
3.1 Producing graphs and charts for pictorial representation
3.2 Trend line graph
3.3 Information
Paraphrase This Document
Need a fresh take? Get an instant paraphrase of this document with our AI Paraphraser


⊘ This is a preview!⊘
Do you want full access?
Subscribe today to unlock all pages.

Trusted by 1+ million students worldwide

Paraphrase This Document
Need a fresh take? Get an instant paraphrase of this document with our AI Paraphraser


⊘ This is a preview!⊘
Do you want full access?
Subscribe today to unlock all pages.

Trusted by 1+ million students worldwide
1 out of 18
Related Documents

Your All-in-One AI-Powered Toolkit for Academic Success.
+13062052269
info@desklib.com
Available 24*7 on WhatsApp / Email
Unlock your academic potential
Copyright © 2020–2025 A2Z Services. All Rights Reserved. Developed and managed by ZUCOL.