Detailed Report: Economic Impact of COVID-19 Pandemic in the UK
VerifiedAdded on 2023/06/12
|5
|1204
|179
Report
AI Summary
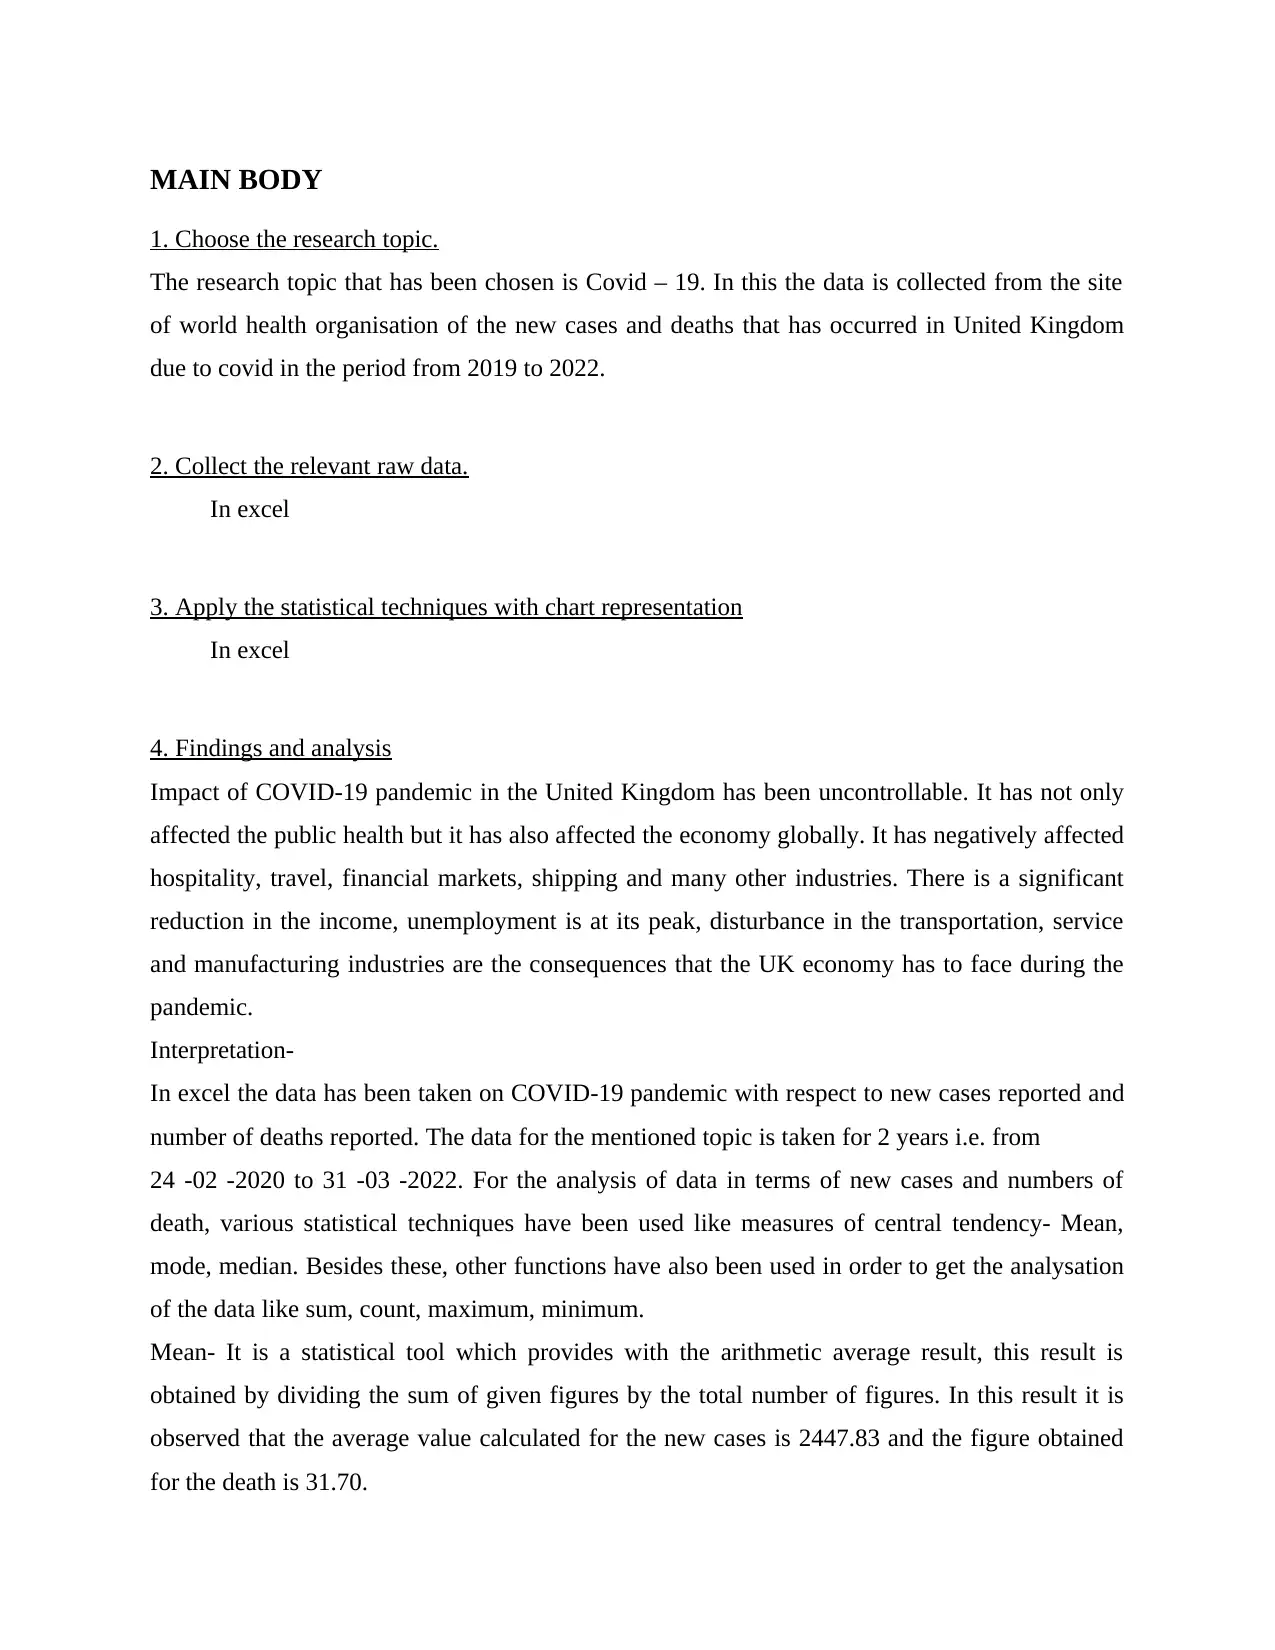
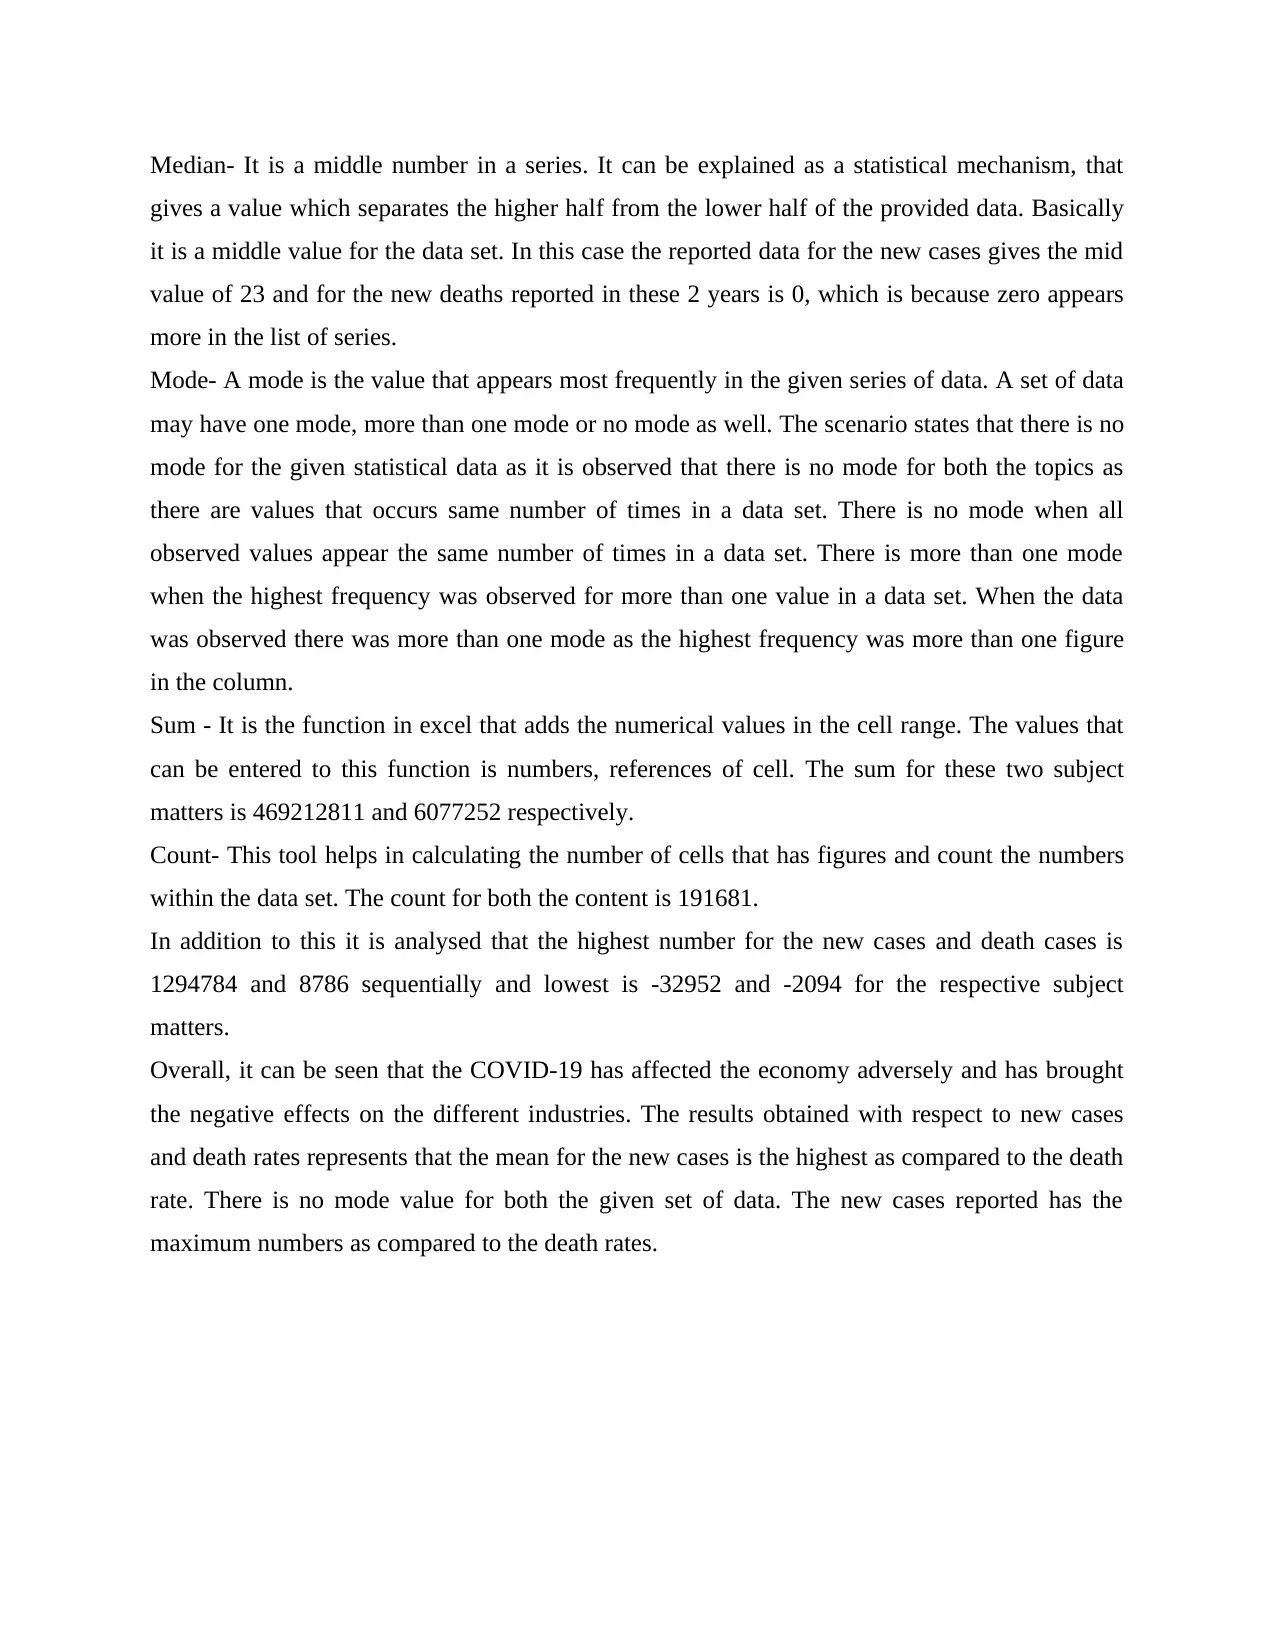
This report analyzes the impact of the COVID-19 pandemic on the United Kingdom's economy using statistical techniques. Data from the World Health Organization on new cases and deaths in the UK from 2019 to 2022 was analyzed using measures of central tendency such as mean, median, and mode, along with other functions like sum, count, minimum, and maximum in Excel. The findings reveal that the pandemic has adversely affected various sectors, including hospitality, travel, and financial markets, leading to reduced income, increased unemployment, and disruptions in transportation, service, and manufacturing industries. The analysis of new cases and death rates indicates that the mean for new cases is significantly higher than the death rate, with no mode value for either dataset. Desklib provides access to this report along with a wide array of study tools and solved assignments for students.

DHICT BA30589E
Paraphrase This Document
Need a fresh take? Get an instant paraphrase of this document with our AI Paraphraser

Contents
MAIN BODY..................................................................................................................................3
1. Choose the research topic........................................................................................................3
2. Collect the relevant raw data...................................................................................................3
3. Apply the statistical techniques with chart representation......................................................3
4. Findings and analysis...............................................................................................................3
REFERENCES................................................................................................................................5

MAIN BODY
1. Choose the research topic.
The research topic that has been chosen is Covid – 19. In this the data is collected from the site
of world health organisation of the new cases and deaths that has occurred in United Kingdom
due to covid in the period from 2019 to 2022.
2. Collect the relevant raw data.
In excel
3. Apply the statistical techniques with chart representation
In excel
4. Findings and analysis
Impact of COVID-19 pandemic in the United Kingdom has been uncontrollable. It has not only
affected the public health but it has also affected the economy globally. It has negatively affected
hospitality, travel, financial markets, shipping and many other industries. There is a significant
reduction in the income, unemployment is at its peak, disturbance in the transportation, service
and manufacturing industries are the consequences that the UK economy has to face during the
pandemic.
Interpretation-
In excel the data has been taken on COVID-19 pandemic with respect to new cases reported and
number of deaths reported. The data for the mentioned topic is taken for 2 years i.e. from
24 -02 -2020 to 31 -03 -2022. For the analysis of data in terms of new cases and numbers of
death, various statistical techniques have been used like measures of central tendency- Mean,
mode, median. Besides these, other functions have also been used in order to get the analysation
of the data like sum, count, maximum, minimum.
Mean- It is a statistical tool which provides with the arithmetic average result, this result is
obtained by dividing the sum of given figures by the total number of figures. In this result it is
observed that the average value calculated for the new cases is 2447.83 and the figure obtained
for the death is 31.70.
⊘ This is a preview!⊘
Do you want full access?
Subscribe today to unlock all pages.

Trusted by 1+ million students worldwide

Median- It is a middle number in a series. It can be explained as a statistical mechanism, that
gives a value which separates the higher half from the lower half of the provided data. Basically
it is a middle value for the data set. In this case the reported data for the new cases gives the mid
value of 23 and for the new deaths reported in these 2 years is 0, which is because zero appears
more in the list of series.
Mode- A mode is the value that appears most frequently in the given series of data. A set of data
may have one mode, more than one mode or no mode as well. The scenario states that there is no
mode for the given statistical data as it is observed that there is no mode for both the topics as
there are values that occurs same number of times in a data set. There is no mode when all
observed values appear the same number of times in a data set. There is more than one mode
when the highest frequency was observed for more than one value in a data set. When the data
was observed there was more than one mode as the highest frequency was more than one figure
in the column.
Sum - It is the function in excel that adds the numerical values in the cell range. The values that
can be entered to this function is numbers, references of cell. The sum for these two subject
matters is 469212811 and 6077252 respectively.
Count- This tool helps in calculating the number of cells that has figures and count the numbers
within the data set. The count for both the content is 191681.
In addition to this it is analysed that the highest number for the new cases and death cases is
1294784 and 8786 sequentially and lowest is -32952 and -2094 for the respective subject
matters.
Overall, it can be seen that the COVID-19 has affected the economy adversely and has brought
the negative effects on the different industries. The results obtained with respect to new cases
and death rates represents that the mean for the new cases is the highest as compared to the death
rate. There is no mode value for both the given set of data. The new cases reported has the
maximum numbers as compared to the death rates.
Paraphrase This Document
Need a fresh take? Get an instant paraphrase of this document with our AI Paraphraser

REFERENCES
Books and Journals
Choong, Y.Y., and et.al., 2018. Voices of First Responders–Identifying Public Safety
Communication Problems: Findings from User-Centered Interviews, Phase 1, Volume
1.
Danish, 2019. Effects of information and communication technology and real income on CO2
emissions: The experience of countries along Belt and Road. Telematics and
Informatics, 45.
Camacho, S., Hassanein, K. and Head, M., 2018. Cyberbullying impacts on victims’ satisfaction
with information and communication technologies: The role of perceived cyberbullying
severity. Information & Management, 55(4), pp.494-507.
Prasad, R. and Rohokale, V., 2020. Internet of Things (IoT) and machine to machine (M2M)
communication. In Cyber Security: The Lifeline of Information and Communication
Technology (pp. 125-141). Springer, Cham.
Ferrell, J. and Kline, K., 2018. Facilitating trust and communication in virtual teams. People &
Strategy, 41(2), pp.30-36.
Kumar, V. and Nanda, P., 2019. Social media in higher education: A framework for continuous
engagement. International Journal of Information and Communication Technology
Education (IJICTE), 15(1), pp.97-108.
Arokiasamy, L., Kwaider, S. and Balaraman, R.A., 2019. Best Practices for Crisis
Communication: A Qualitative Study. Global Business & Management Research, 11(2).
Peraković, D., Periša, M. and Sente, R.E., 2018, June. Information and communication
technologies within industry 4.0 concept. In Design, Simulation, Manufacturing: The
Innovation Exchange (pp. 127-134). Springer, Cham.
Romanyshyn, Y. and et.al., 2019, September. Social-communication web technologies in the
higher education as means of knowledge transfer. In 2019 IEEE 14th International
Conference on Computer Sciences and Information Technologies (CSIT) (Vol. 3, pp.
35-38). IEEE.
De, S. and Raj, A.B., 2020, November. Experimental study of sand-storm effect on digital fso
communication link. In 2020 International Conference on Recent Trends on
Electronics, Information, Communication & Technology (RTEICT) (pp. 35-40). IEEE.
1 out of 5
Related Documents

Your All-in-One AI-Powered Toolkit for Academic Success.
+13062052269
info@desklib.com
Available 24*7 on WhatsApp / Email
Unlock your academic potential
Copyright © 2020–2025 A2Z Services. All Rights Reserved. Developed and managed by ZUCOL.