Impact of Farm Type on Business Income: UK Farm Survey Report
VerifiedAdded on 2021/01/02
|21
|2042
|18
Report
AI Summary
This report presents an analysis of a Farm Business Survey conducted in the UK, examining the relationships between farm business income and various factors including expenses, labour hours, farm type, and farm size. The study employs statistical methods such as descriptive analysis, t-tests, ANOVA, correlation, regression, and cluster analysis using SPSS to identify significant relationships and patterns within the dataset. Key findings include positive correlations between cost of capital, farm size, and farm business income, as well as significant relationships between labour expenses, rent paid, and farm business income. The report concludes that various elements such as labour, size, area, and expenses have an impact on the income of farm businesses, as demonstrated by the statistical analyses performed. The study aims to provide insights into how different variables affect farm income, contributing to a better understanding of farm business management and financial performance.

SPSS
Paraphrase This Document
Need a fresh take? Get an instant paraphrase of this document with our AI Paraphraser
TABLE OF CONTENTS
INTRODUCTION...........................................................................................................................1
Background..................................................................................................................................1
Aim and Objectives.....................................................................................................................1
Research Hypothesis....................................................................................................................1
Literature review..........................................................................................................................2
MAIN BODY..................................................................................................................................2
1. Summary of all variable...........................................................................................................2
2. Histogram of farm business income........................................................................................4
3. Descriptive and T-test of hourly work done by farm household hourly work done by hired
labour...........................................................................................................................................5
4. Testing association with ANOVA and of farm business income and types of farm...............6
5. Analysing correlation of variables...........................................................................................9
6. Cluster analysis on several variables.....................................................................................10
7. Regression analysis on several variables...............................................................................13
CONCLUSION..............................................................................................................................18
REFERENCES..............................................................................................................................18
INTRODUCTION
Background
In the present report, there will be analysis made on variables based on Farm Business Survey in UK. Thus, it will be analysed
through considering the expenses, labour hour, types of farm and revenue generated by them. There will be implication of statistical
tools such as on which researcher will measure descriptive, Two tailed t-test, ANOVA, correlation, regression and cluster. However,
these tests have been used by scholar to generate accurate outcomes which will be reliable in assistive in terms of creating an effective
knowledge. This survey will be studied on the basis of various research questions
Aim and Objectives
Aim: “To investigate the impact of farm type on business income, expenses, labour hour and size of the farm- A study on Farm
Business UK”
Objectives:
To identify the changes in farm income due to various expenses involved in the business.
To demonstrate the changes in farm types affects the farm size and area of land owned.
Research Hypothesis
Hypothesis (1)
Null hypothesis: There is no mean significant differences between the working hours of casual workers and hired workers in farm
business
Alternative hypothesis: There is mean significant differences between the working hours of casual workers and hired workers in farm
business
Hypothesis (2)
Null hypothesis: There is no mean significant relationship between Farm business income and types of farm
Alternative Hypothesis: There is a mean significant relationship between Farm business income and types of farm
1
⊘ This is a preview!⊘
Do you want full access?
Subscribe today to unlock all pages.
Trusted by 1+ million students worldwide
Hypothesis (3):
H0: There is no mean significant relationship between labour expenses (both paid and casual), Rent paid and Farm business
income.
H1: There is a mean significant relationship between labour expenses (both paid and casual), Rent paid and Farm business
income.
Hypothesis (4):
H0: There is no mean significant relationship between farm size, land area owned and farm business income.
H1: There is a mean significant relationship between farm size, land area owned and farm business income.
Literature review
As introduced by Babbie, Wagner III and Zaino, (2018), there have been impacts of various variables on the farm’s income. It
includes several sources such as labour, size, land area as well as types of farm. It is required by the farmers in managing all the
elements as well as making adequate control over all the resources which will lead them in retaining the beneficiary success. Zhang,
and Li, (2018) stated that, impacts of such variations are mainly on the product in process and time for the completion of the job to be
done. Thus, the min factor is environment and labour force used in this process.
MAIN BODY
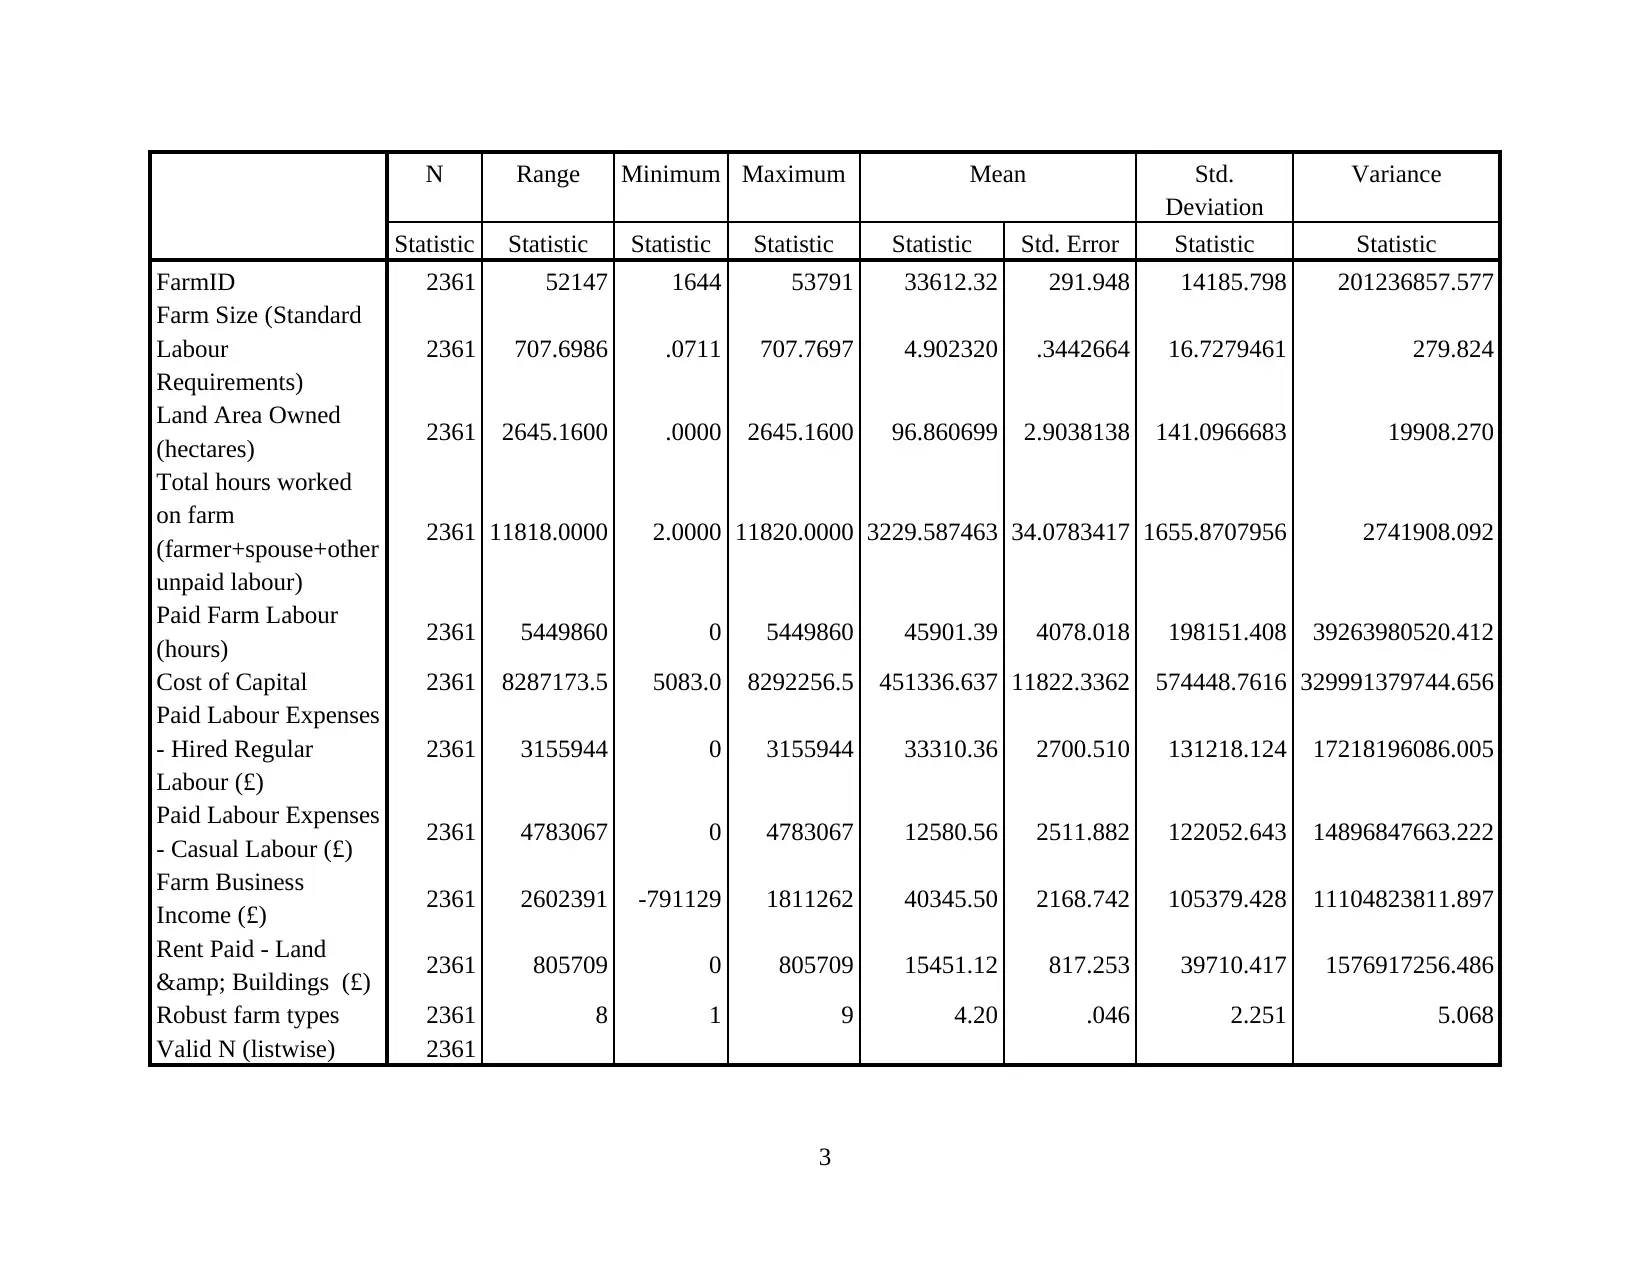
1. Summary of all variable
In accordance with analysing the summary of all the variables which has been used by the researchers there will be use of
Descriptive analysis (Wiedermann and Li, 2018). Thus, such analysis helps in identifying effective outcomes and summary of the data
set. Descriptive represent mean, mode, median and standard deviation of variables on which researchers will evaluate the summary of
all sources.
Descriptive Statistics
2
H0: There is no mean significant relationship between labour expenses (both paid and casual), Rent paid and Farm business
income.
H1: There is a mean significant relationship between labour expenses (both paid and casual), Rent paid and Farm business
income.
Hypothesis (4):
H0: There is no mean significant relationship between farm size, land area owned and farm business income.
H1: There is a mean significant relationship between farm size, land area owned and farm business income.
Literature review
As introduced by Babbie, Wagner III and Zaino, (2018), there have been impacts of various variables on the farm’s income. It
includes several sources such as labour, size, land area as well as types of farm. It is required by the farmers in managing all the
elements as well as making adequate control over all the resources which will lead them in retaining the beneficiary success. Zhang,
and Li, (2018) stated that, impacts of such variations are mainly on the product in process and time for the completion of the job to be
done. Thus, the min factor is environment and labour force used in this process.
MAIN BODY
1. Summary of all variable
In accordance with analysing the summary of all the variables which has been used by the researchers there will be use of
Descriptive analysis (Wiedermann and Li, 2018). Thus, such analysis helps in identifying effective outcomes and summary of the data
set. Descriptive represent mean, mode, median and standard deviation of variables on which researchers will evaluate the summary of
all sources.
Descriptive Statistics
2
Paraphrase This Document
Need a fresh take? Get an instant paraphrase of this document with our AI Paraphraser
N Range Minimum Maximum Mean Std.
Deviation
Variance
Statistic Statistic Statistic Statistic Statistic Std. Error Statistic Statistic
FarmID 2361 52147 1644 53791 33612.32 291.948 14185.798 201236857.577
Farm Size (Standard
Labour
Requirements)
2361 707.6986 .0711 707.7697 4.902320 .3442664 16.7279461 279.824
Land Area Owned
(hectares) 2361 2645.1600 .0000 2645.1600 96.860699 2.9038138 141.0966683 19908.270
Total hours worked
on farm
(farmer+spouse+other
unpaid labour)
2361 11818.0000 2.0000 11820.0000 3229.587463 34.0783417 1655.8707956 2741908.092
Paid Farm Labour
(hours) 2361 5449860 0 5449860 45901.39 4078.018 198151.408 39263980520.412
Cost of Capital 2361 8287173.5 5083.0 8292256.5 451336.637 11822.3362 574448.7616 329991379744.656
Paid Labour Expenses
- Hired Regular
Labour (£)
2361 3155944 0 3155944 33310.36 2700.510 131218.124 17218196086.005
Paid Labour Expenses
- Casual Labour (£) 2361 4783067 0 4783067 12580.56 2511.882 122052.643 14896847663.222
Farm Business
Income (£) 2361 2602391 -791129 1811262 40345.50 2168.742 105379.428 11104823811.897
Rent Paid - Land
& Buildings (£) 2361 805709 0 805709 15451.12 817.253 39710.417 1576917256.486
Robust farm types 2361 8 1 9 4.20 .046 2.251 5.068
Valid N (listwise) 2361
3
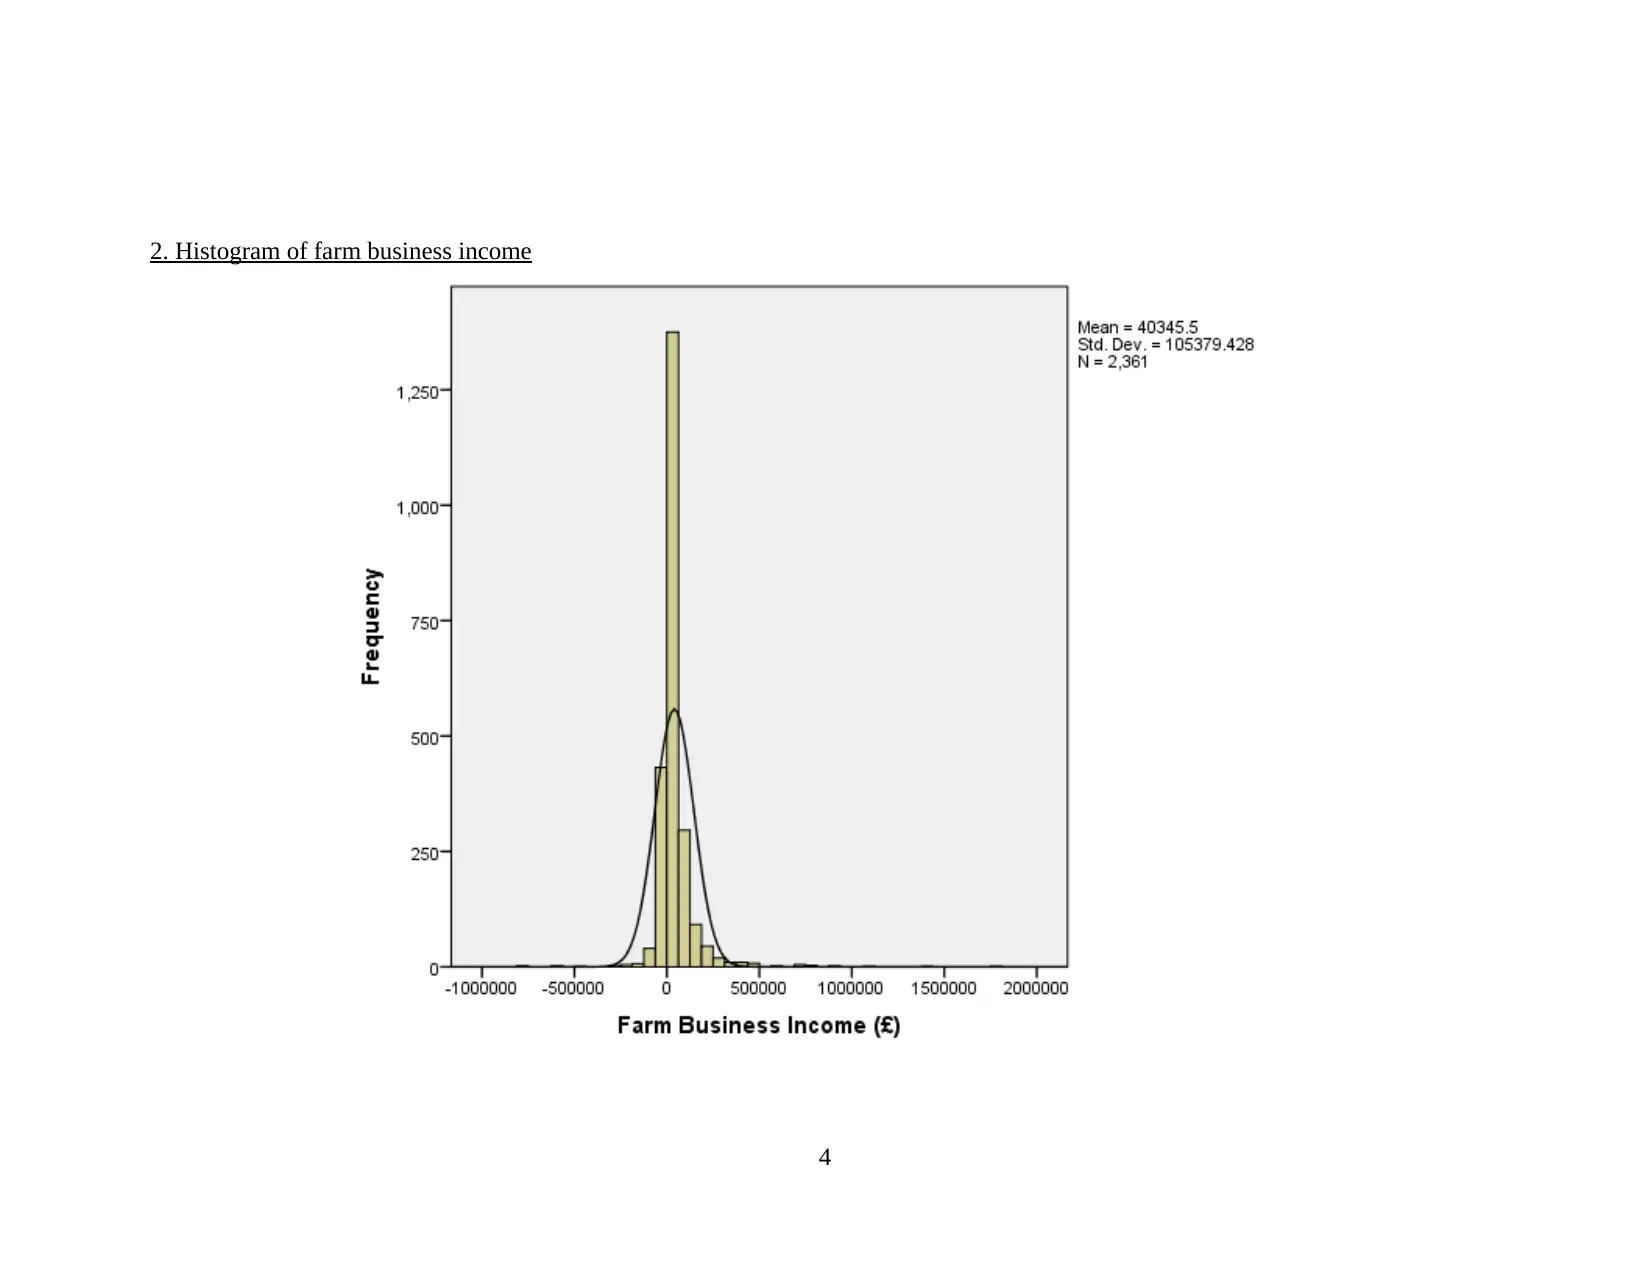
2. Histogram of farm business income
4
4
⊘ This is a preview!⊘
Do you want full access?
Subscribe today to unlock all pages.
Trusted by 1+ million students worldwide
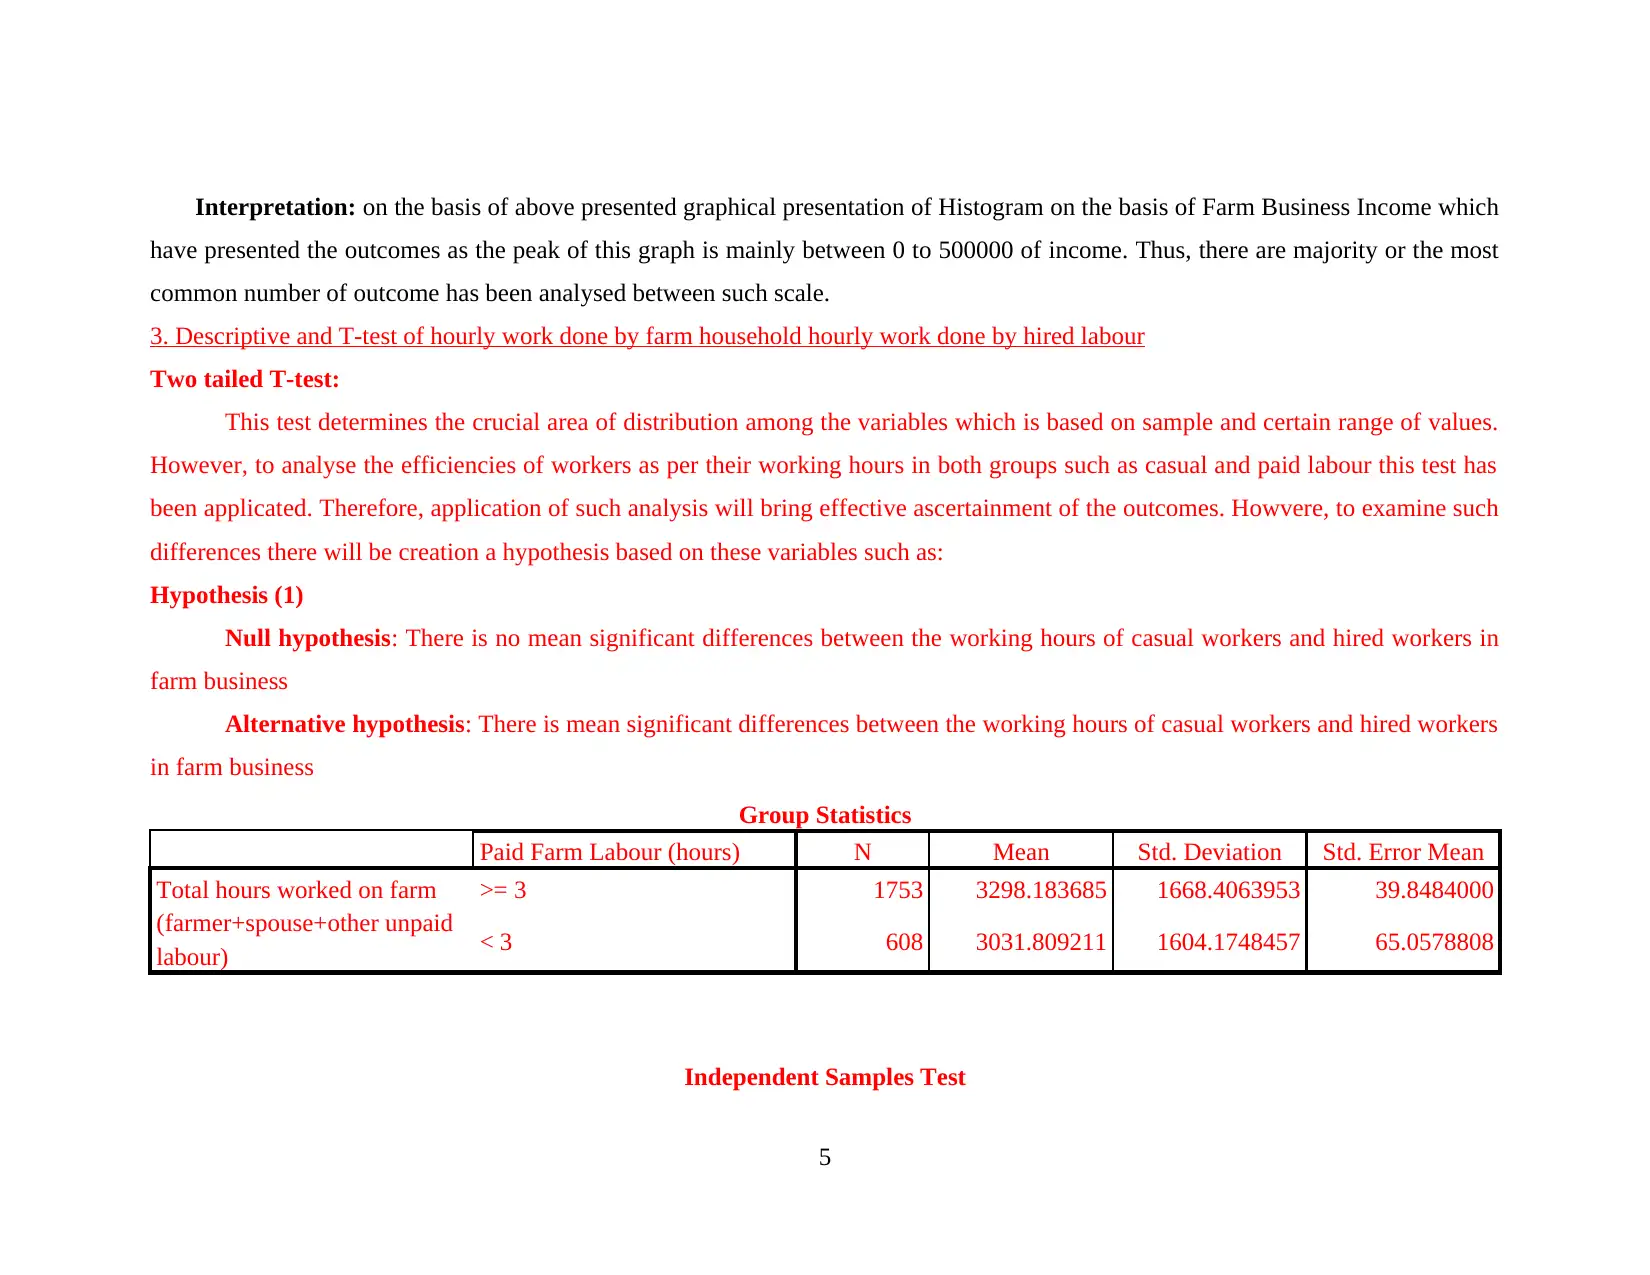
Interpretation: on the basis of above presented graphical presentation of Histogram on the basis of Farm Business Income which
have presented the outcomes as the peak of this graph is mainly between 0 to 500000 of income. Thus, there are majority or the most
common number of outcome has been analysed between such scale.
3. Descriptive and T-test of hourly work done by farm household hourly work done by hired labour
Two tailed T-test:
This test determines the crucial area of distribution among the variables which is based on sample and certain range of values.
However, to analyse the efficiencies of workers as per their working hours in both groups such as casual and paid labour this test has
been applicated. Therefore, application of such analysis will bring effective ascertainment of the outcomes. Howvere, to examine such
differences there will be creation a hypothesis based on these variables such as:
Hypothesis (1)
Null hypothesis: There is no mean significant differences between the working hours of casual workers and hired workers in
farm business
Alternative hypothesis: There is mean significant differences between the working hours of casual workers and hired workers
in farm business
Group Statistics
Paid Farm Labour (hours) N Mean Std. Deviation Std. Error Mean
Total hours worked on farm
(farmer+spouse+other unpaid
labour)
>= 3 1753 3298.183685 1668.4063953 39.8484000
< 3 608 3031.809211 1604.1748457 65.0578808
Independent Samples Test
5
Paraphrase This Document
Need a fresh take? Get an instant paraphrase of this document with our AI Paraphraser
Levene's
Test for
Equality of
Variances
t-test for Equality of Means
F Sig. t df Sig.
(2-
tailed)
Mean
Difference
Std. Error
Difference
95% Confidence Interval of
the Difference
Lower Upper
Total hours worked
on farm
(farmer+spouse+other
unpaid labour)
Equal
variances
assumed
1.133 .287 3.426 2359 .001 266.3744746 77.7581938 113.8929802 418.8559690
Equal
variances not
assumed
3.492 1094.512 .000 266.3744746 76.2916957 116.6799623 416.0689869
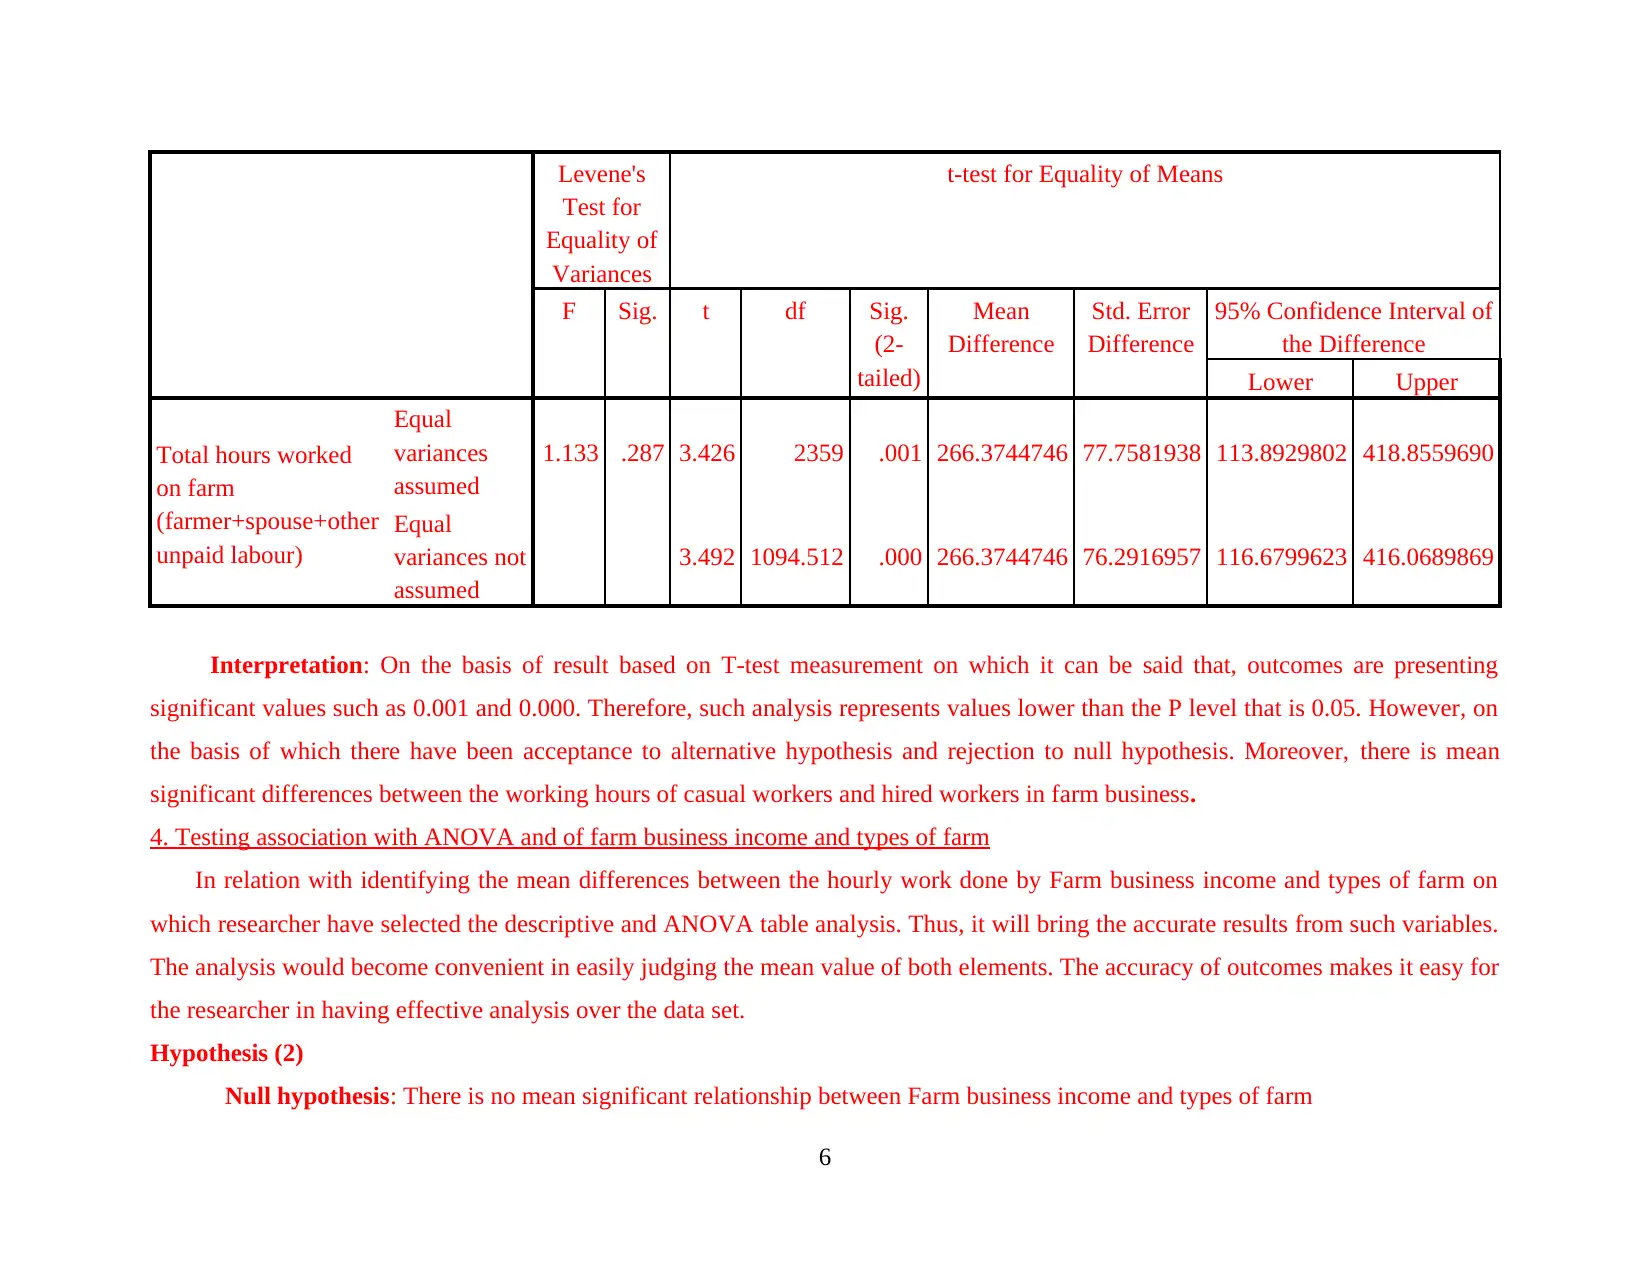
Interpretation: On the basis of result based on T-test measurement on which it can be said that, outcomes are presenting
significant values such as 0.001 and 0.000. Therefore, such analysis represents values lower than the P level that is 0.05. However, on
the basis of which there have been acceptance to alternative hypothesis and rejection to null hypothesis. Moreover, there is mean
significant differences between the working hours of casual workers and hired workers in farm business.
4. Testing association with ANOVA and of farm business income and types of farm
In relation with identifying the mean differences between the hourly work done by Farm business income and types of farm on
which researcher have selected the descriptive and ANOVA table analysis. Thus, it will bring the accurate results from such variables.
The analysis would become convenient in easily judging the mean value of both elements. The accuracy of outcomes makes it easy for
the researcher in having effective analysis over the data set.
Hypothesis (2)
Null hypothesis: There is no mean significant relationship between Farm business income and types of farm
6
Test for
Equality of
Variances
t-test for Equality of Means
F Sig. t df Sig.
(2-
tailed)
Mean
Difference
Std. Error
Difference
95% Confidence Interval of
the Difference
Lower Upper
Total hours worked
on farm
(farmer+spouse+other
unpaid labour)
Equal
variances
assumed
1.133 .287 3.426 2359 .001 266.3744746 77.7581938 113.8929802 418.8559690
Equal
variances not
assumed
3.492 1094.512 .000 266.3744746 76.2916957 116.6799623 416.0689869
Interpretation: On the basis of result based on T-test measurement on which it can be said that, outcomes are presenting
significant values such as 0.001 and 0.000. Therefore, such analysis represents values lower than the P level that is 0.05. However, on
the basis of which there have been acceptance to alternative hypothesis and rejection to null hypothesis. Moreover, there is mean
significant differences between the working hours of casual workers and hired workers in farm business.
4. Testing association with ANOVA and of farm business income and types of farm
In relation with identifying the mean differences between the hourly work done by Farm business income and types of farm on
which researcher have selected the descriptive and ANOVA table analysis. Thus, it will bring the accurate results from such variables.
The analysis would become convenient in easily judging the mean value of both elements. The accuracy of outcomes makes it easy for
the researcher in having effective analysis over the data set.
Hypothesis (2)
Null hypothesis: There is no mean significant relationship between Farm business income and types of farm
6
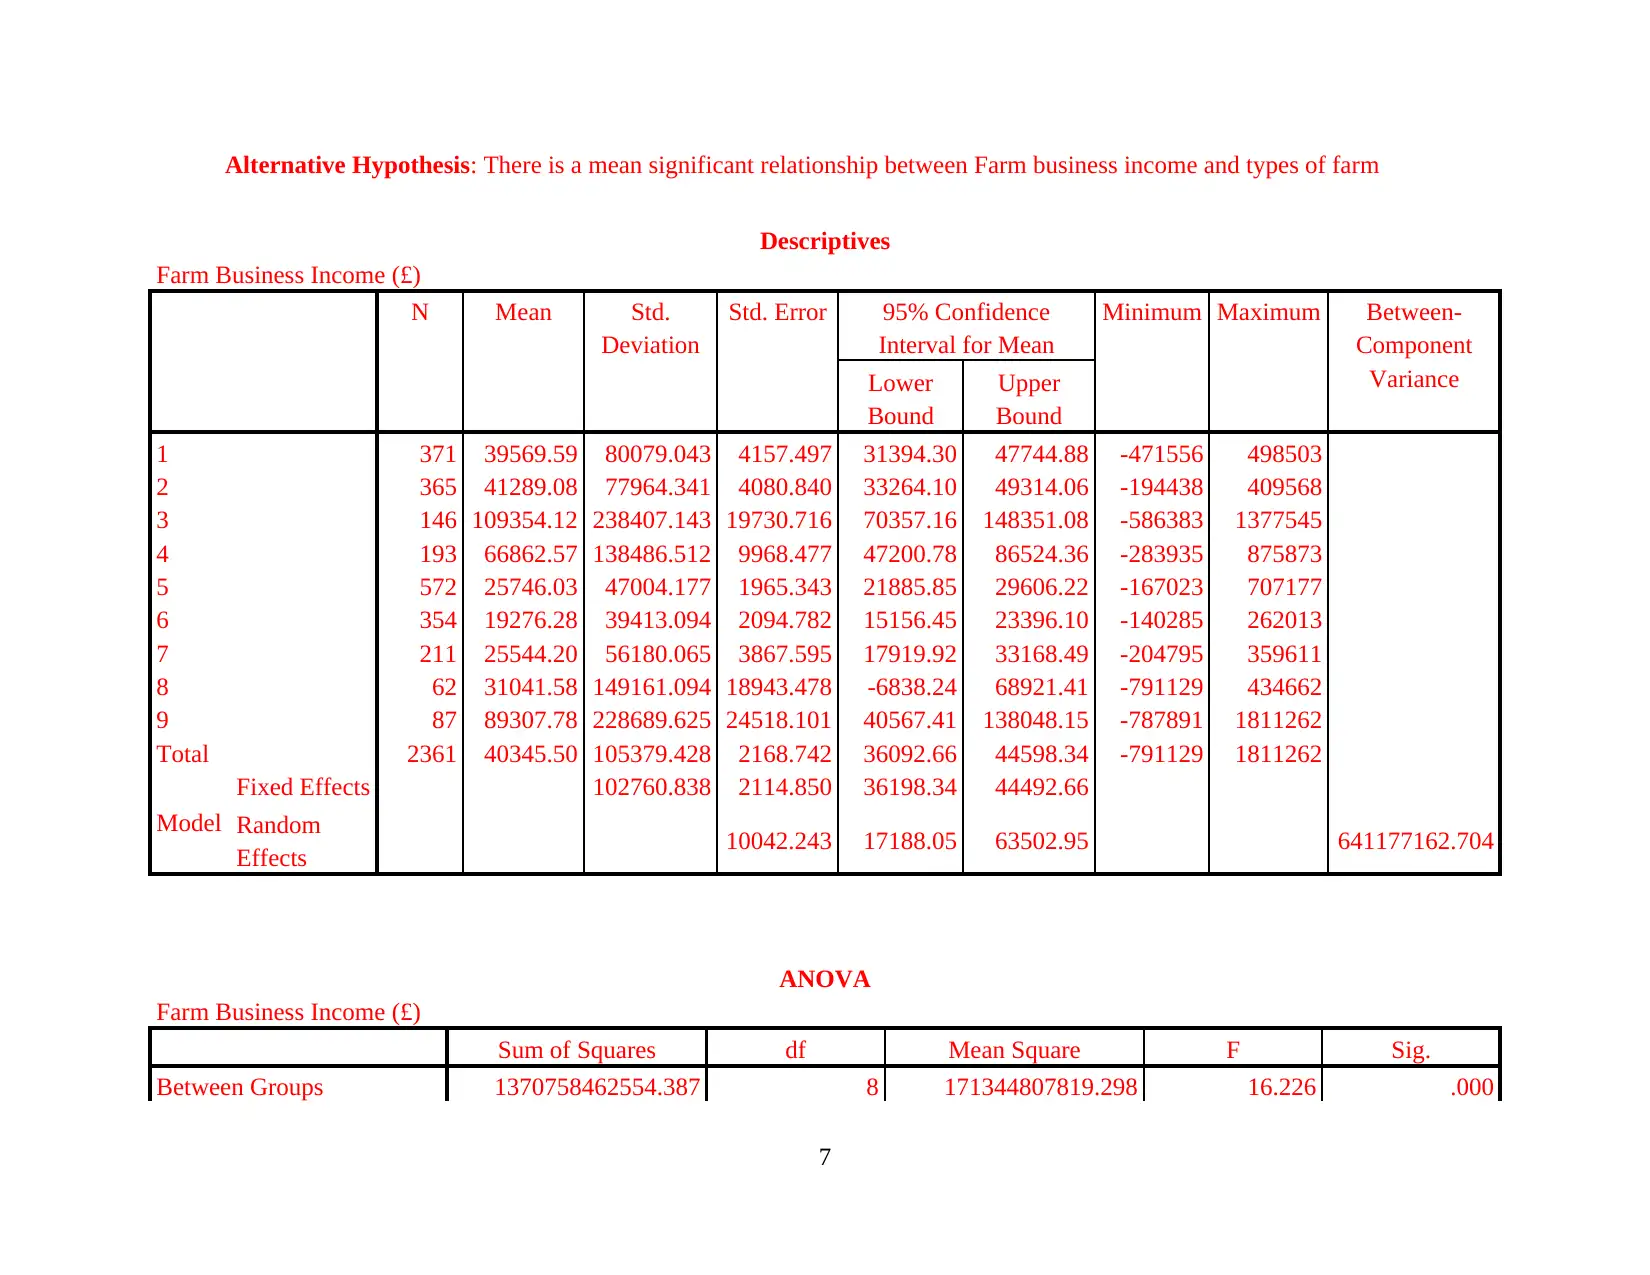
Alternative Hypothesis: There is a mean significant relationship between Farm business income and types of farm
Descriptives
Farm Business Income (£)
N Mean Std.
Deviation
Std. Error 95% Confidence
Interval for Mean
Minimum Maximum Between-
Component
VarianceLower
Bound
Upper
Bound
1 371 39569.59 80079.043 4157.497 31394.30 47744.88 -471556 498503
2 365 41289.08 77964.341 4080.840 33264.10 49314.06 -194438 409568
3 146 109354.12 238407.143 19730.716 70357.16 148351.08 -586383 1377545
4 193 66862.57 138486.512 9968.477 47200.78 86524.36 -283935 875873
5 572 25746.03 47004.177 1965.343 21885.85 29606.22 -167023 707177
6 354 19276.28 39413.094 2094.782 15156.45 23396.10 -140285 262013
7 211 25544.20 56180.065 3867.595 17919.92 33168.49 -204795 359611
8 62 31041.58 149161.094 18943.478 -6838.24 68921.41 -791129 434662
9 87 89307.78 228689.625 24518.101 40567.41 138048.15 -787891 1811262
Total 2361 40345.50 105379.428 2168.742 36092.66 44598.34 -791129 1811262
Model
Fixed Effects 102760.838 2114.850 36198.34 44492.66
Random
Effects 10042.243 17188.05 63502.95 641177162.704
ANOVA
Farm Business Income (£)
Sum of Squares df Mean Square F Sig.
Between Groups 1370758462554.387 8 171344807819.298 16.226 .000
7
⊘ This is a preview!⊘
Do you want full access?
Subscribe today to unlock all pages.
Trusted by 1+ million students worldwide
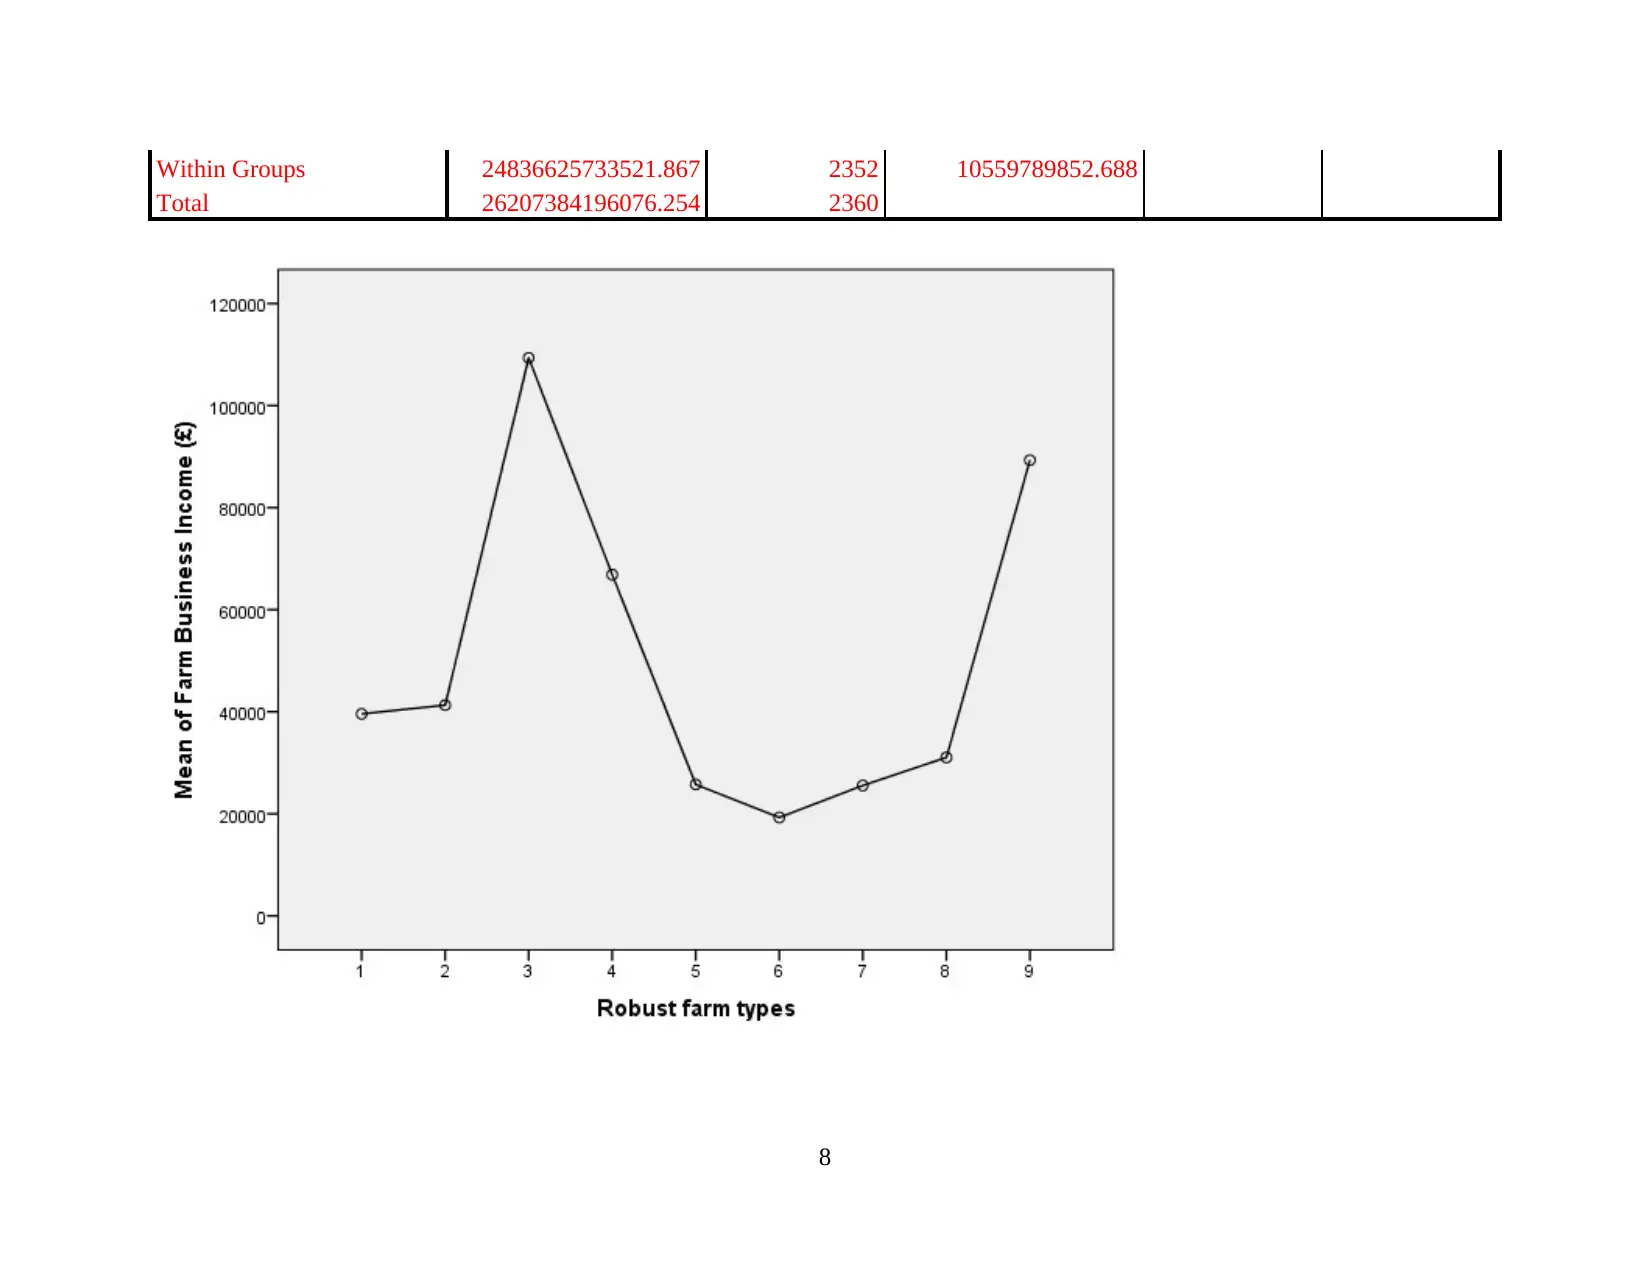
Within Groups 24836625733521.867 2352 10559789852.688
Total 26207384196076.254 2360
8
Total 26207384196076.254 2360
8
Paraphrase This Document
Need a fresh take? Get an instant paraphrase of this document with our AI Paraphraser
Interpretation: As per analysing the outcomes on which farm business income and types of farms has been analysed to have the
effective analysis over the data set. Thus, the significant value of the data set is 0.000 which is lower than the P level. Thus, in this
case there have been acceptance to alternative hypothesis and rejection to the null hypothesis. It states that, t here is a mean significant
relationship between Farm business income and types of farm.
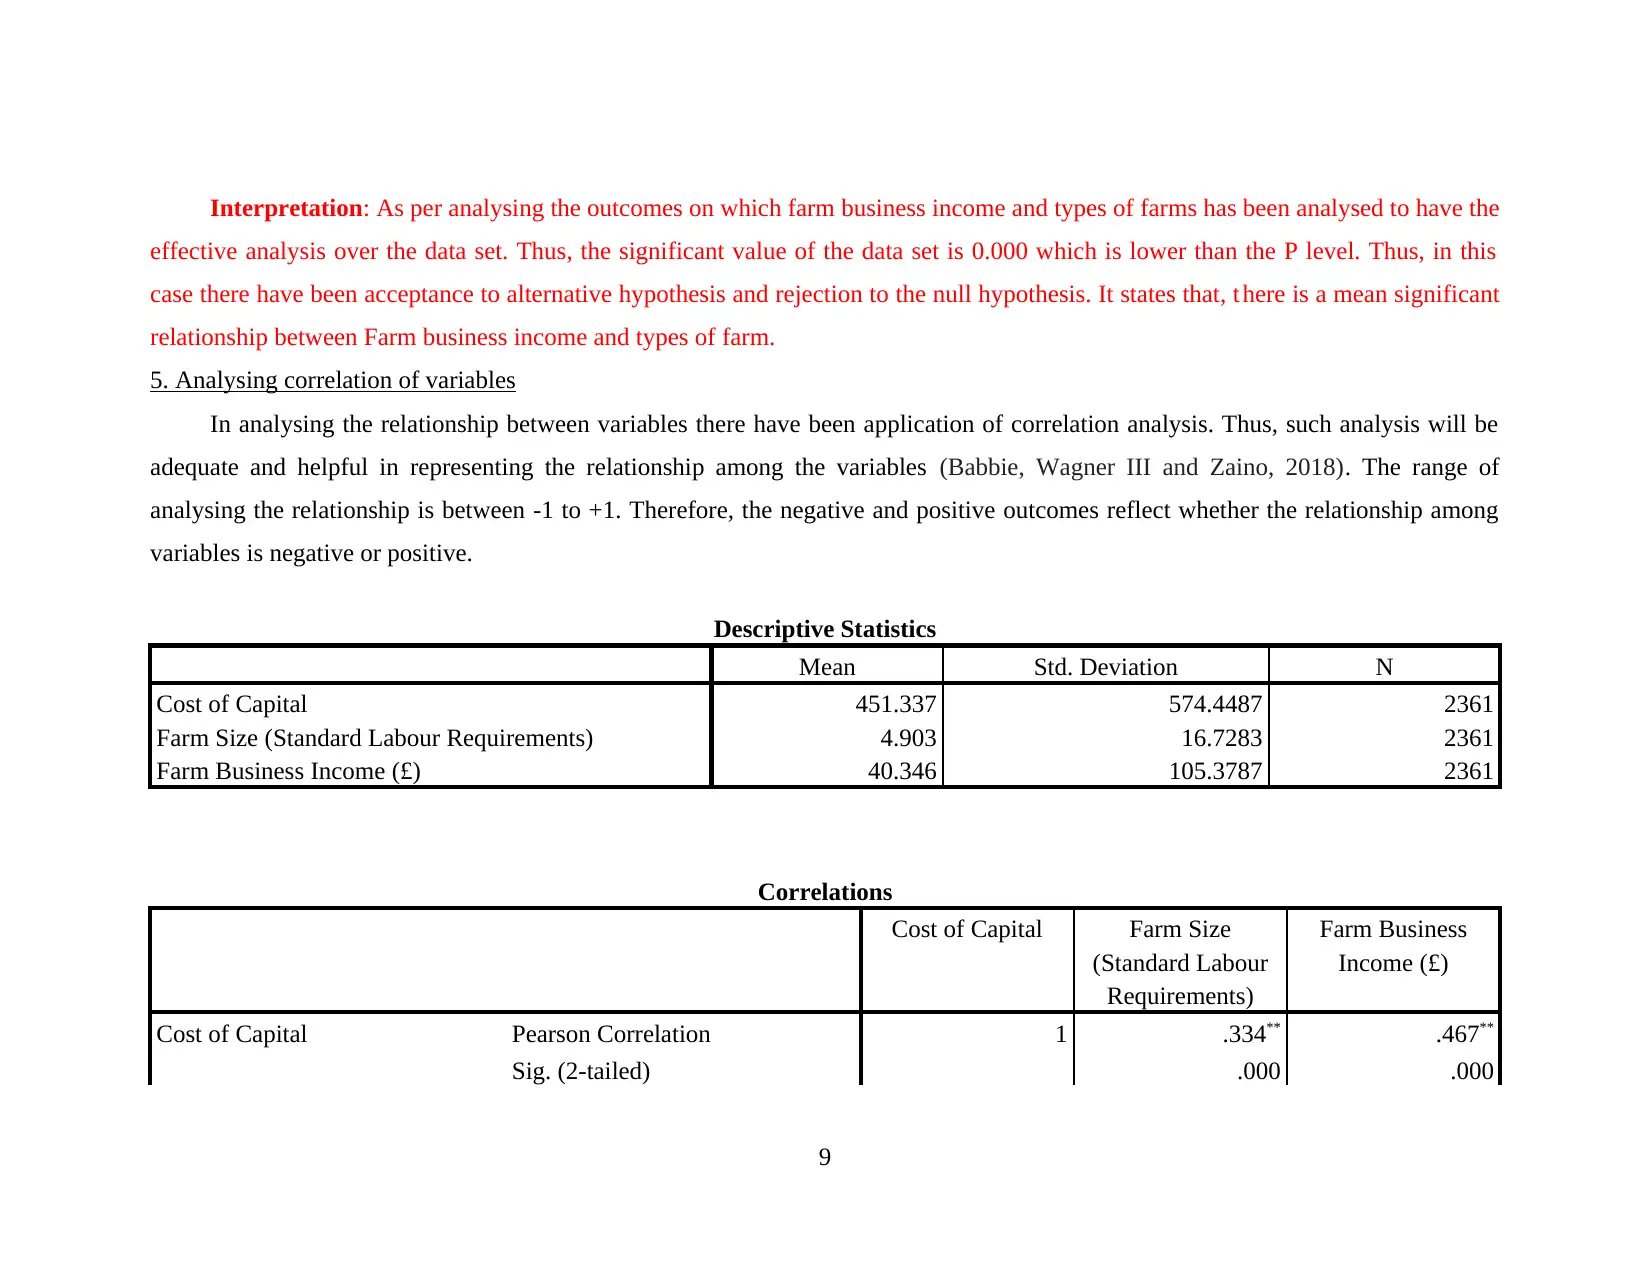
5. Analysing correlation of variables
In analysing the relationship between variables there have been application of correlation analysis. Thus, such analysis will be
adequate and helpful in representing the relationship among the variables (Babbie, Wagner III and Zaino, 2018). The range of
analysing the relationship is between -1 to +1. Therefore, the negative and positive outcomes reflect whether the relationship among
variables is negative or positive.
Descriptive Statistics
Mean Std. Deviation N
Cost of Capital 451.337 574.4487 2361
Farm Size (Standard Labour Requirements) 4.903 16.7283 2361
Farm Business Income (£) 40.346 105.3787 2361
Correlations
Cost of Capital Farm Size
(Standard Labour
Requirements)
Farm Business
Income (£)
Cost of Capital Pearson Correlation 1 .334** .467**
Sig. (2-tailed) .000 .000
9
effective analysis over the data set. Thus, the significant value of the data set is 0.000 which is lower than the P level. Thus, in this
case there have been acceptance to alternative hypothesis and rejection to the null hypothesis. It states that, t here is a mean significant
relationship between Farm business income and types of farm.
5. Analysing correlation of variables
In analysing the relationship between variables there have been application of correlation analysis. Thus, such analysis will be
adequate and helpful in representing the relationship among the variables (Babbie, Wagner III and Zaino, 2018). The range of
analysing the relationship is between -1 to +1. Therefore, the negative and positive outcomes reflect whether the relationship among
variables is negative or positive.
Descriptive Statistics
Mean Std. Deviation N
Cost of Capital 451.337 574.4487 2361
Farm Size (Standard Labour Requirements) 4.903 16.7283 2361
Farm Business Income (£) 40.346 105.3787 2361
Correlations
Cost of Capital Farm Size
(Standard Labour
Requirements)
Farm Business
Income (£)
Cost of Capital Pearson Correlation 1 .334** .467**
Sig. (2-tailed) .000 .000
9
Sum of Squares and Cross-
products 778779617.687 7585959.222 66774811.065
Covariance 329991.363 3214.390 28294.411
N 2361 2361 2361
Farm Size (Standard Labour
Requirements)
Pearson Correlation .334** 1 .232**
Sig. (2-tailed) .000 .000
Sum of Squares and Cross-
products 7585959.222 660413.051 964303.134
Covariance 3214.390 279.836 408.603
N 2361 2361 2361
Farm Business Income (£)
Pearson Correlation .467** .232** 1
Sig. (2-tailed) .000 .000
Sum of Squares and Cross-
products 66774811.065 964303.134 26207012.958
Covariance 28294.411 408.603 11104.667
N 2361 2361 2361
**. Correlation is significant at the 0.01 level (2-tailed).
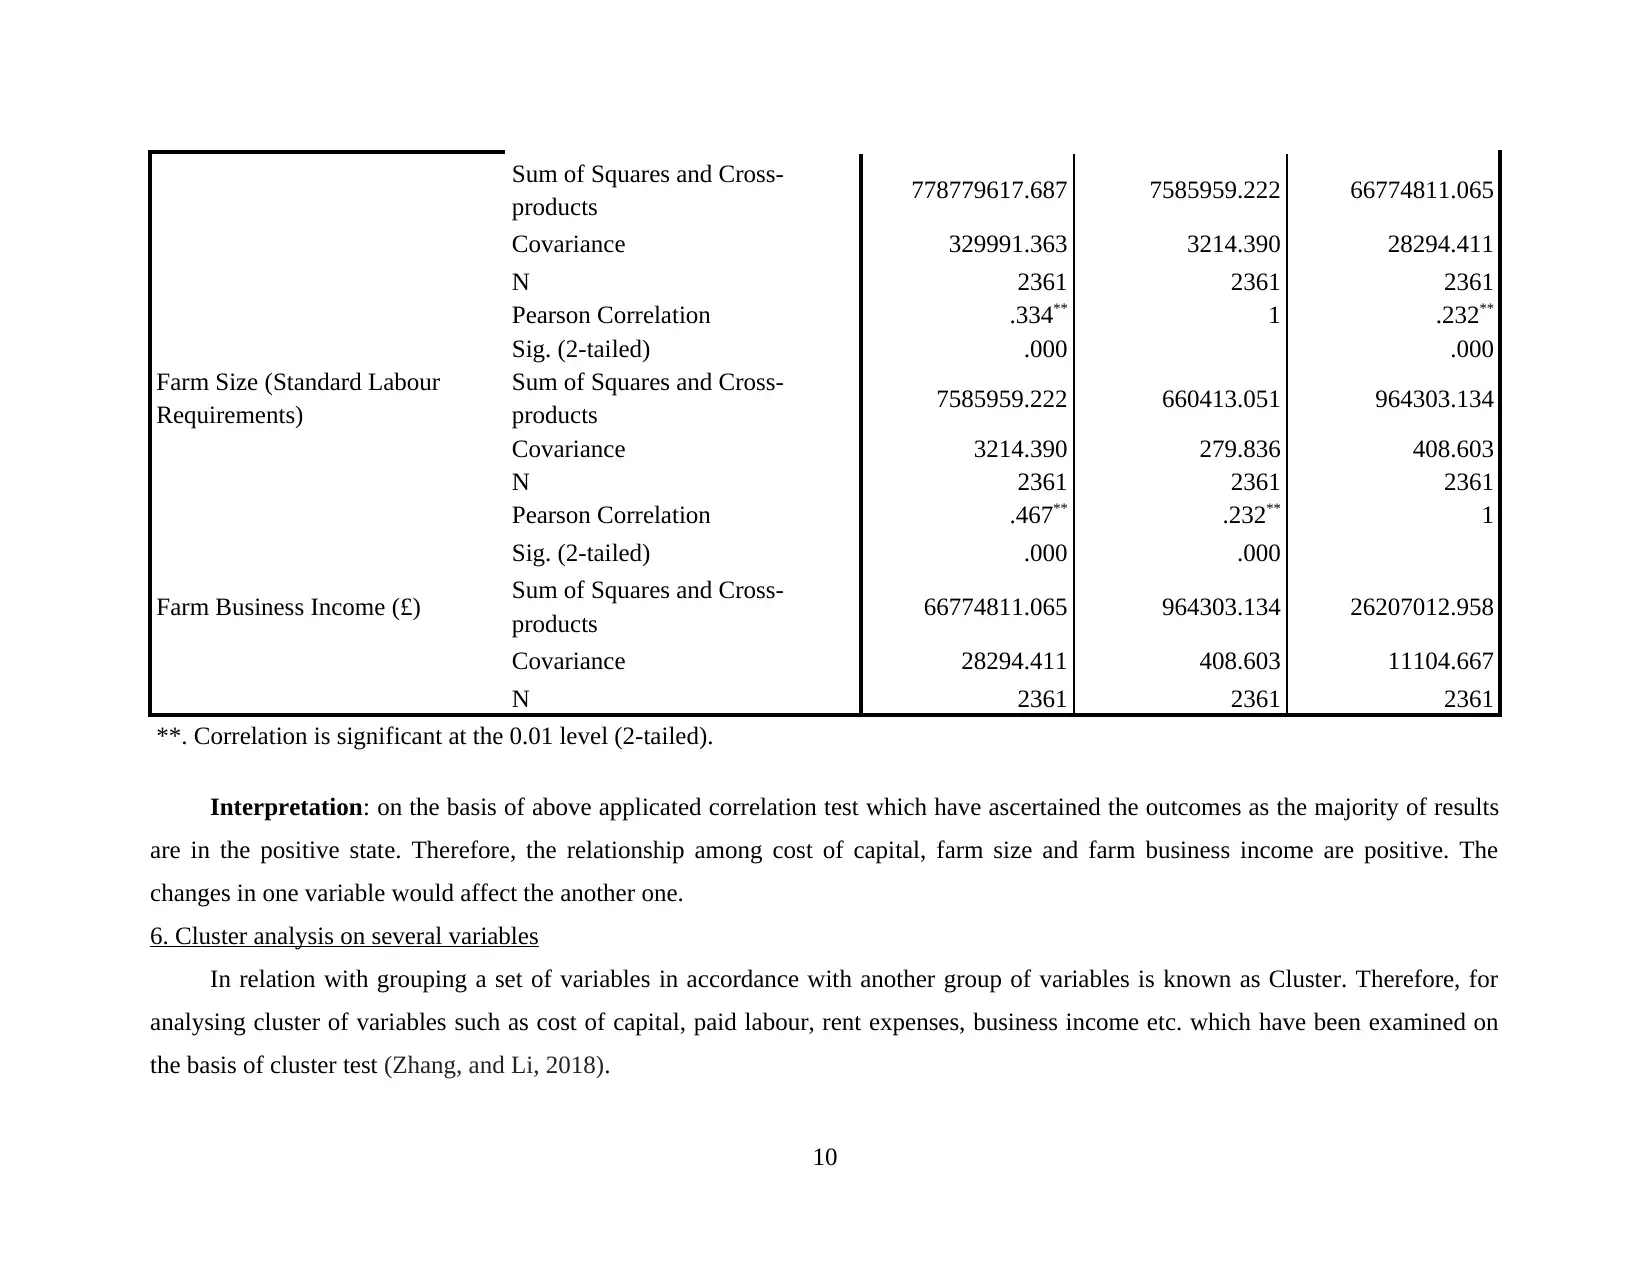
Interpretation: on the basis of above applicated correlation test which have ascertained the outcomes as the majority of results
are in the positive state. Therefore, the relationship among cost of capital, farm size and farm business income are positive. The
changes in one variable would affect the another one.
6. Cluster analysis on several variables
In relation with grouping a set of variables in accordance with another group of variables is known as Cluster. Therefore, for
analysing cluster of variables such as cost of capital, paid labour, rent expenses, business income etc. which have been examined on
the basis of cluster test (Zhang, and Li, 2018).
10
products 778779617.687 7585959.222 66774811.065
Covariance 329991.363 3214.390 28294.411
N 2361 2361 2361
Farm Size (Standard Labour
Requirements)
Pearson Correlation .334** 1 .232**
Sig. (2-tailed) .000 .000
Sum of Squares and Cross-
products 7585959.222 660413.051 964303.134
Covariance 3214.390 279.836 408.603
N 2361 2361 2361
Farm Business Income (£)
Pearson Correlation .467** .232** 1
Sig. (2-tailed) .000 .000
Sum of Squares and Cross-
products 66774811.065 964303.134 26207012.958
Covariance 28294.411 408.603 11104.667
N 2361 2361 2361
**. Correlation is significant at the 0.01 level (2-tailed).
Interpretation: on the basis of above applicated correlation test which have ascertained the outcomes as the majority of results
are in the positive state. Therefore, the relationship among cost of capital, farm size and farm business income are positive. The
changes in one variable would affect the another one.
6. Cluster analysis on several variables
In relation with grouping a set of variables in accordance with another group of variables is known as Cluster. Therefore, for
analysing cluster of variables such as cost of capital, paid labour, rent expenses, business income etc. which have been examined on
the basis of cluster test (Zhang, and Li, 2018).
10
⊘ This is a preview!⊘
Do you want full access?
Subscribe today to unlock all pages.
Trusted by 1+ million students worldwide
1 out of 21
Related Documents


Your All-in-One AI-Powered Toolkit for Academic Success.
+13062052269
info@desklib.com
Available 24*7 on WhatsApp / Email
![[object Object]](/_next/static/media/star-bottom.7253800d.svg)
Unlock your academic potential
Copyright © 2020–2026 A2Z Services. All Rights Reserved. Developed and managed by ZUCOL.