Analysis of the UK Food Crisis: An Economics for Business Report
VerifiedAdded on 2022/12/27
|17
|3793
|88
Report
AI Summary
This report provides a comprehensive analysis of the UK food crisis that occurred as a result of the COVID-19 pandemic and subsequent lockdown measures. It begins with an executive summary and introduction, then delves into the core economic principles of supply and demand, examining how the pandemic and related restrictions disrupted the food supply chain. The report uses supply and demand curves to illustrate these disruptions, including shifts in the supply curve due to non-price factors like border closures and agricultural shutdowns. It also explores market equilibrium, shortages, and surpluses within the context of the UK food crisis. Furthermore, the report addresses the principles of market failure and the role of government interventions in mitigating the crisis. The report uses academic sources to support the analysis. The conclusion summarizes the key findings and implications of the analysis.
Business for
Economics
Economics
Paraphrase This Document
Need a fresh take? Get an instant paraphrase of this document with our AI Paraphraser
EXECUTIVE SUMMARY
Ever since COVID-19 pandemic have hit the World, all sorts of activities are seen
interrupted. Besides health of people is affected and deaths due to pandemic are seen
continuously rising, people all around the world have became very conscious about the manner
of living and habits they follow. A key safety protocol for fighting pandemic was suggested by
health experts is to maintain distance from each other and avoid frequent touches and gatherings.
Due to this reason governments around the world imposed Lockdown in their countries.
Lockdown simply means closing of borders of country and putting temporary shutdowns over
movement of people and business activities, so that distances could be maintained resulting in
containment of spread of virus. However, spread of virus went prolonged and countries kept
imposing Lockdown. Even after Lockdown was removed desired upsurge in business activities
was not seen, one due to remove was in instalments relaxing continuation of priority sectors first.
All these developments starting from halt in economic activities to closing of borders by United
kingdom itself, triggered food crisis in economy. United kingdom although have sufficient
domestic production of food products to meet domestic demand, but also relies over other
countries for essential supplies like meat and other products. But when borders were closed and
agricultural activities were suspended, it resulted into food scarcity and ultimately UK economy
went into food crisis.
Table of Contents
EXECUTIVE SUMMARY.............................................................................................................2
INTRODUCTION...........................................................................................................................1
TASK 1............................................................................................................................................1
Studying Supply curve...........................................................................................................2
Studying Demand curve.........................................................................................................6
Studying Equilibrium...........................................................................................................10
Explaining Shortages and Surplus........................................................................................10
TASK 2..........................................................................................................................................11
Economic Principles of Market Failure................................................................................11
Interventions of Government................................................................................................11
CONCLUSION..............................................................................................................................13
⊘ This is a preview!⊘
Do you want full access?
Subscribe today to unlock all pages.
Trusted by 1+ million students worldwide
INTRODUCTION
Lock-down was a safety measure against spread of COVID-19 adopted in many
countries, also United Kingdom resulted in making economies of countries vulnerable.
Restricted trade economic activities and barred movements of goods and people together with
disrupted supplies across borders required initiatives of food relief at urgency (Aldaco and et.al.,
2020).
In this report, an analysis of food crisis occurred in UK as result of virus upsurge and lockdown
measures, is made. This begins from understanding basic principles of demand and supply in
relation to crisis of UK. Followed by, understanding market equilibrium and its disturbances,
effects relating to crisis. And, issues of shortages and surpluses to that of UK crisis are discussed.
Also principles of market failure and government interventions are helpful in getting knowledge
of issue holistically.
TASK 1
Problems faced by UK economy in terms of food crisis was not a result of numerous
factors that played role in scenario developed by COVID-19 pandemic and many aftermaths that
took place after that. First of al, as safety measure lockdown was imposed in country that put halt
on every economy activity in the country, agriculture also. At the same time to contain spread of
virus Government imposed closing borders also and sup[plies of food products from
neighbouring countries also became impossible. This was only the beginning of the stage where
food crisis were nurturing. Though at this stage well food scarcity in market was visible. Since
all such developments were happening suppliers in economy became more cautious and they
chose to opt for stock piling fearing future scarcity (Faour-Klingbeil and et.al., 2021). Also
whatever products were available were also being provided at higher prices and inflation got
triggered.
For developing a better insight over the matter it is important for one to have look at
basic principles of economy pertaining to demand and supply. How demand and supply in
economy acts automatically and how they are affected by different factors. It is also important to
understand to stabilise them, which is equilibrium in economy. Principles and standards of
economy are universal thus their help is useful to comprehend a situation from core. For this
purpose, report have taken support of economic principles of Krugman and Wells.
1
Paraphrase This Document
Need a fresh take? Get an instant paraphrase of this document with our AI Paraphraser
Studying Supply curve
As per studies of Krugman and Wells, supply curve is the graphical representation of that
situation in economy which reflects supply of a product in economy by suppliers at a given
amount on a given price in particular point of time. The graph is reflective of understanding that
as the prices of products rises in economy due to reason of rising demand in economy for the
products, suppliers are willing to supply more at increased prices. This is scenario pertaining to
normalised economy where only market forces plays role and every other factors like political
policies are silent or constant. This establishes positive relation between price and supply of
products (Galanakis, 2020).
Using mechanism of supply curve, report have attempted to understand that how situation
in UK economy prevailed at the time of food crisis and how supply and supply curve in economy
reacted to that situation.
Movement along Supply curve
Movement along supply curve, according Krugman and Wells, in expansion or
contraction of supply curve. This means and increase or decrease in supply of product due to
increase or decraese in prices of products only because of market forces playing role and other
factors remain constant. This is the case seen in normal situation in economy. Related to UK
food crisis, the situation was triggered by external factors. Although prices in economy were
seen rising but that were not due to market forces, that was due to restricted supply of products
from inland producers as well as cross border suppliers. As supply was restricted and demand
was constantly rising, prices naturally increased. Therefore movement along supply curve do not
relate for food crisis seen in UK in year 2020.
2
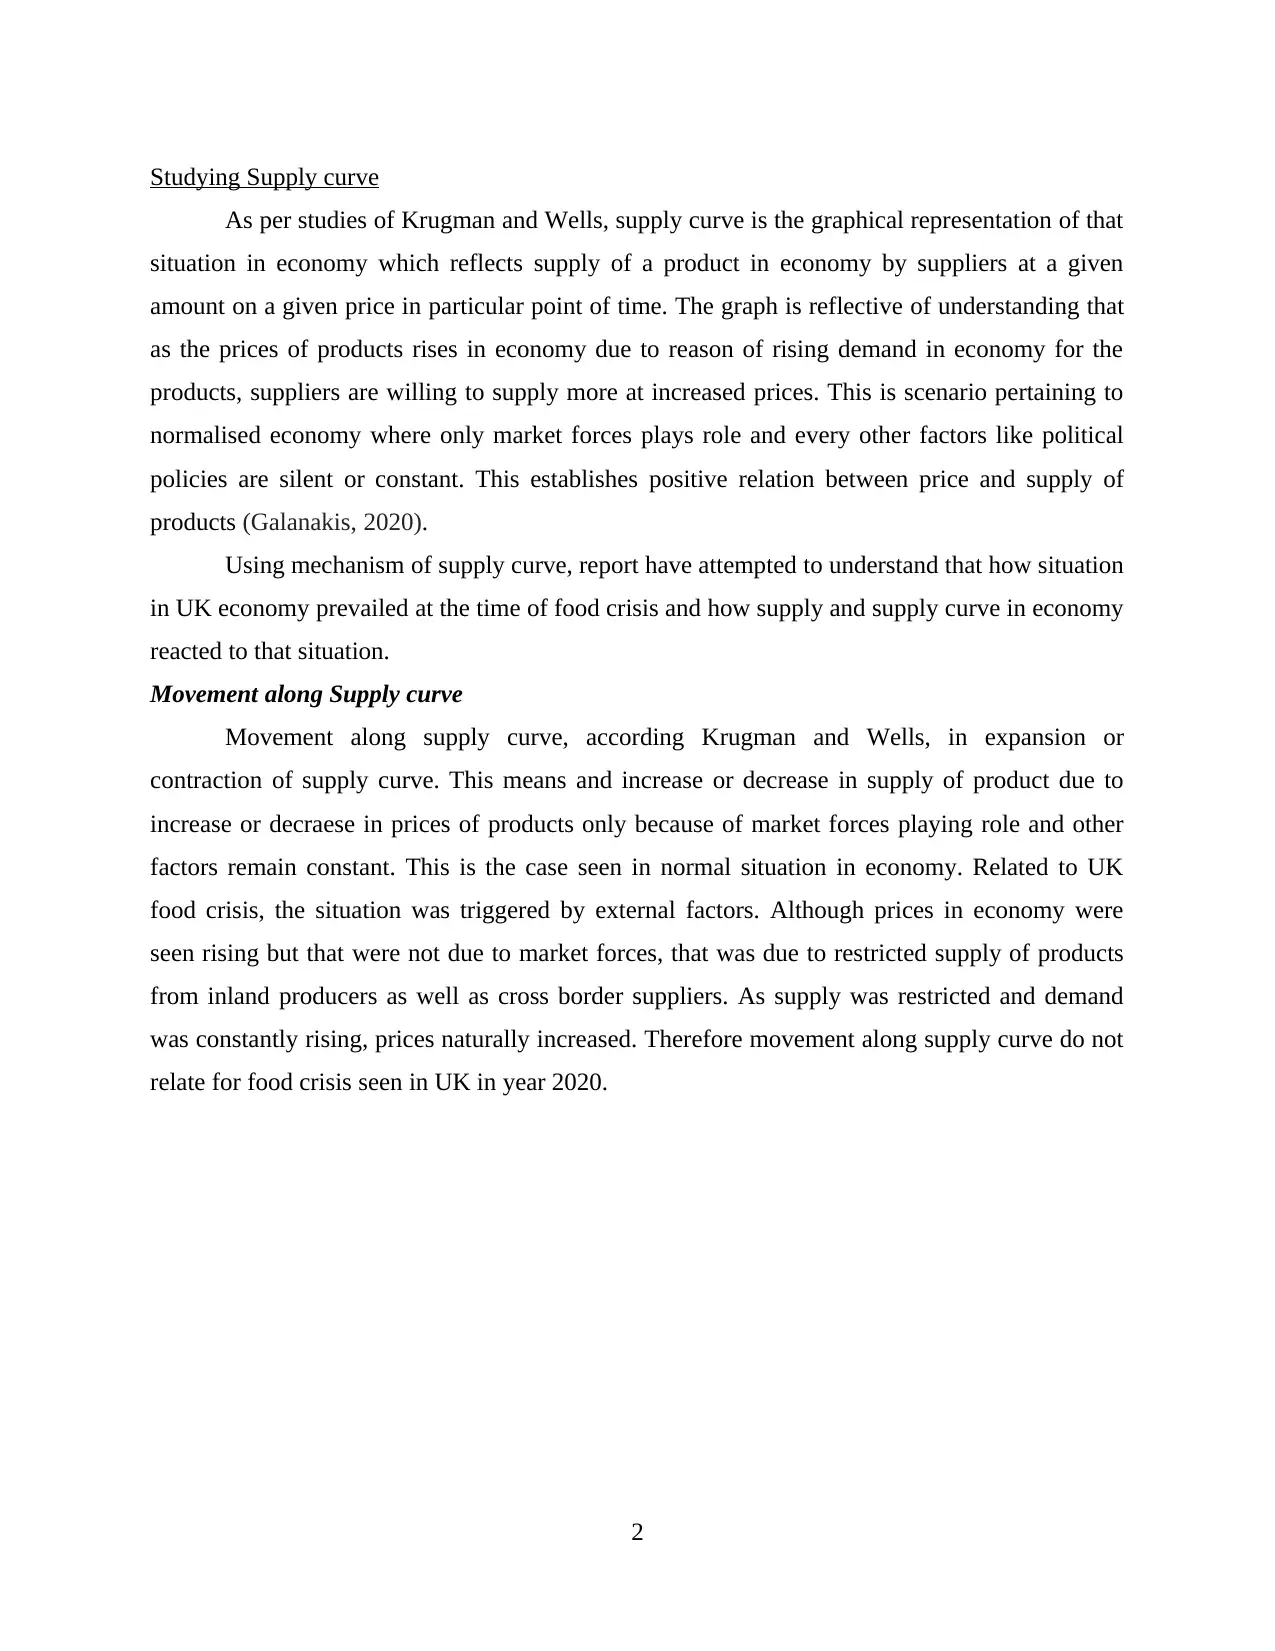
In the above diagram, it can be seen that when prices P0 were prevailing in economy,
quantity of products supplied was Q0. When price increased to P1, quantity supplied increased to
Q1, and point on supply curve moved a step ahead. This movement was solely bough by
increased prices of products. Similarly when price decreases, quantity supplied will decrease and
the point of supply on graph will one come down.
Shift in supply curve
As explained by Krugman and Wells, increase or decrease in quantity supplied min
economy is influenced by prices of products (Garratt, 2020). But that happen when economy is
in normal mode. Economic principles of Krugman and Wells also explains to what happens in
abnormal circumstances in economy. When supply of products is affected by factors beyond
market forces of demand and price then increase or decrease in supply leads to shift of supply
curve. This is change that happens over existing prices. However its result obviously affects the
price.
Over graphs, this development is reflected as Leftward and Rightward shift in supply
curve. Where Leftward shift of supply curve reflects decrease in supply due to non-price factors
and Rightward shift means increase in supply due to non-price factors.
Report have studied this principle of economy taking both situations separately and also
their implication on food crisis of UK in year 2020.
3
Illustration 1: Movement along Supply curve
⊘ This is a preview!⊘
Do you want full access?
Subscribe today to unlock all pages.
Trusted by 1+ million students worldwide
Leftward
When supply of products decreases due to non-price factors, as seen in the case of UK
food crisis, the supply curve is seen shifting to its leftward side from existing position. The shift
towards left occur because even at the existing price producers do not have products to supply in
market. There are no changes in prices at that time. This case is exactly seen in crisis of 2020 in
United kingdom, as food products were available to suppliers due to halted economic activities
of agriculture and transport due to lockdown. Also due to closing of borders supply from other
counties was disrupted. Thus even at existing prices and rising demand, suppliers were not
having products to supply in market (Gray, 2020). Situation got more stressed when suppliers
feared disrupted supply in future also and they started piling stocks for future, restricting supply
more. Hence supply curve shifted to left. Since, demand was all time high prices shot up
exorbitantly.
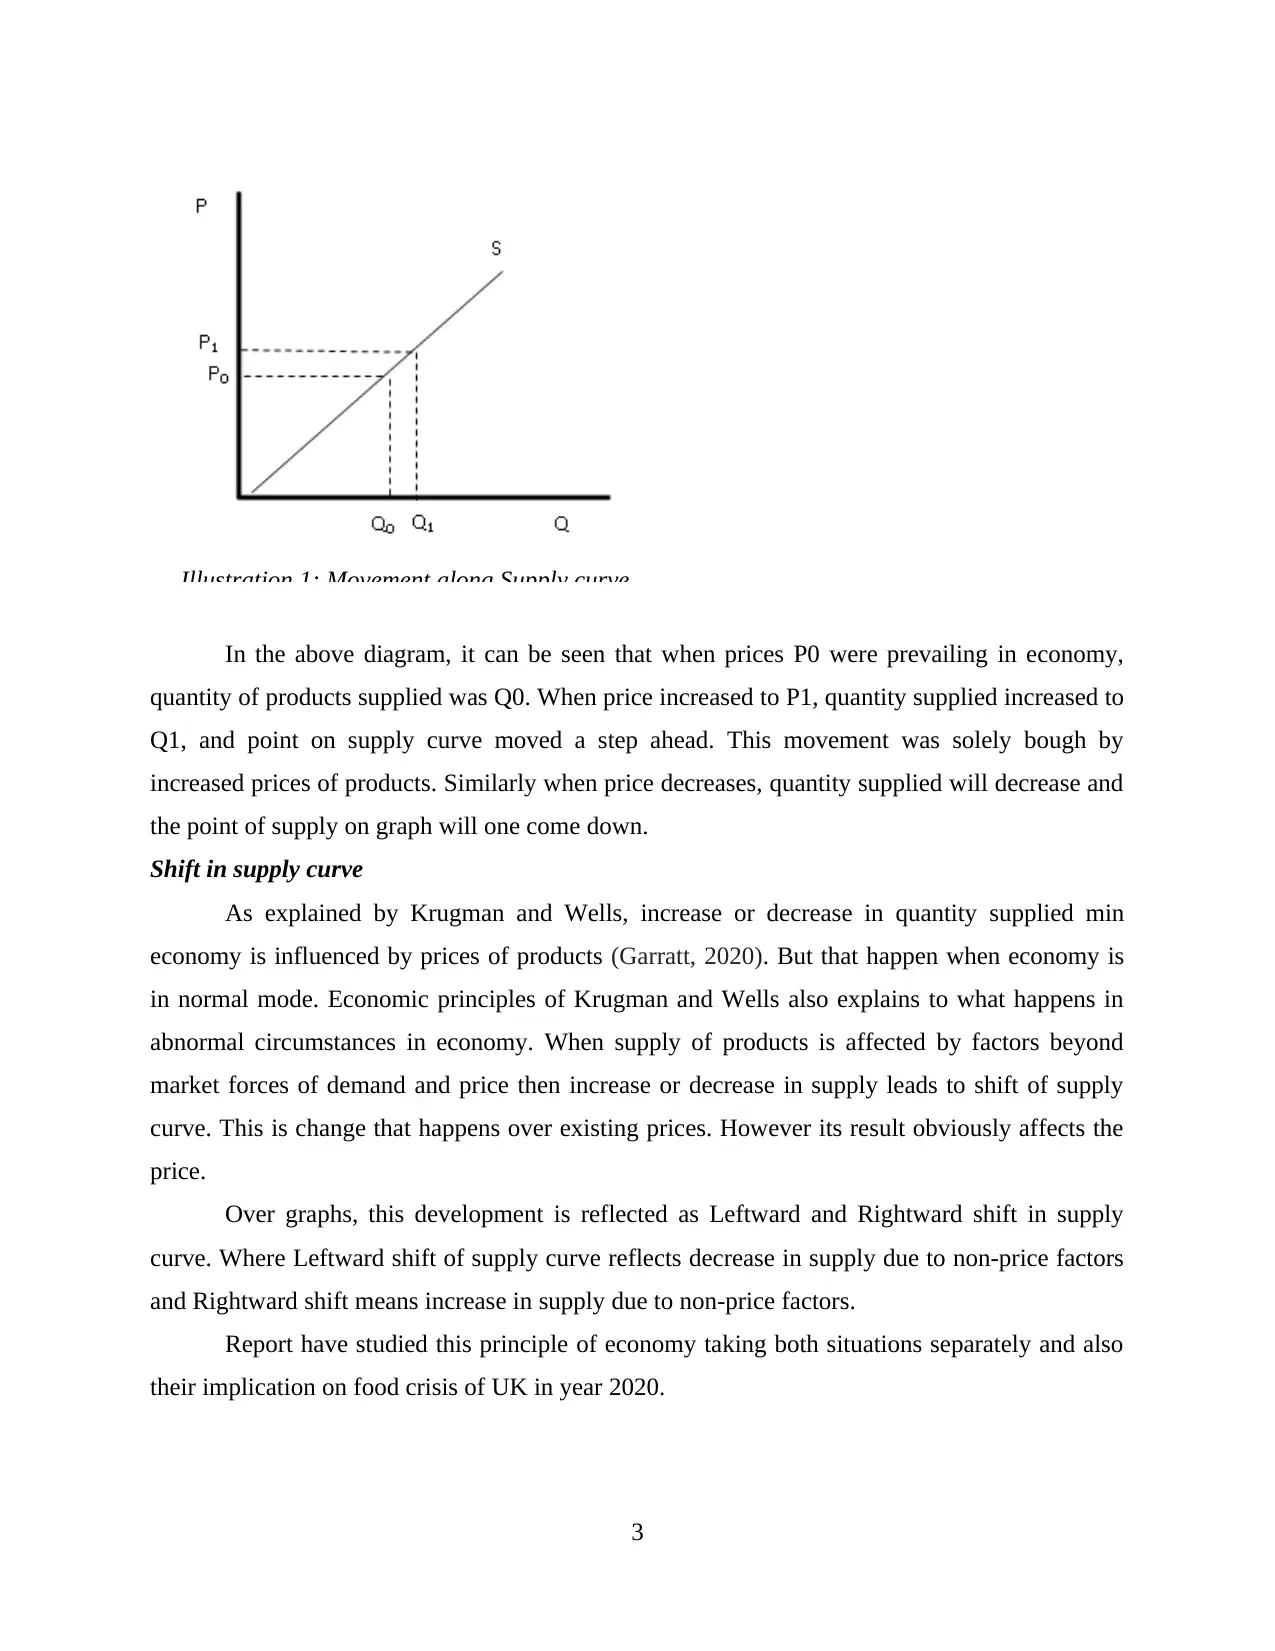
In the above diagram, it is clear that, when prices were at P quantity supplied was Q. But
when non-price factors played role, like in case of UK, even at P quantity supplied decreased to
Q1 and supply curve shifted to left from S to S1. As a result prices shot up. Increase in prices in
this case is attributed to supply side.
4
Illustration 2: Leftward shift of Supply curve
When supply of products decreases due to non-price factors, as seen in the case of UK
food crisis, the supply curve is seen shifting to its leftward side from existing position. The shift
towards left occur because even at the existing price producers do not have products to supply in
market. There are no changes in prices at that time. This case is exactly seen in crisis of 2020 in
United kingdom, as food products were available to suppliers due to halted economic activities
of agriculture and transport due to lockdown. Also due to closing of borders supply from other
counties was disrupted. Thus even at existing prices and rising demand, suppliers were not
having products to supply in market (Gray, 2020). Situation got more stressed when suppliers
feared disrupted supply in future also and they started piling stocks for future, restricting supply
more. Hence supply curve shifted to left. Since, demand was all time high prices shot up
exorbitantly.
In the above diagram, it is clear that, when prices were at P quantity supplied was Q. But
when non-price factors played role, like in case of UK, even at P quantity supplied decreased to
Q1 and supply curve shifted to left from S to S1. As a result prices shot up. Increase in prices in
this case is attributed to supply side.
4
Illustration 2: Leftward shift of Supply curve
Paraphrase This Document
Need a fresh take? Get an instant paraphrase of this document with our AI Paraphraser
Rightward
Rightward shift in supply curve as explained by Krugman and Wells, occurs when
supply of a product gets increased suddenly. This increase is not due to increase in price s but
due to other factors in economy. Factors that are beyond market forces, like sudden increase in
production or change in consumer preferences etc. In this case supply gets increased at existing
prices in economy and the curve tends to shift rightward. However this was not the case in UK in
2020, but it is an important economic principle.
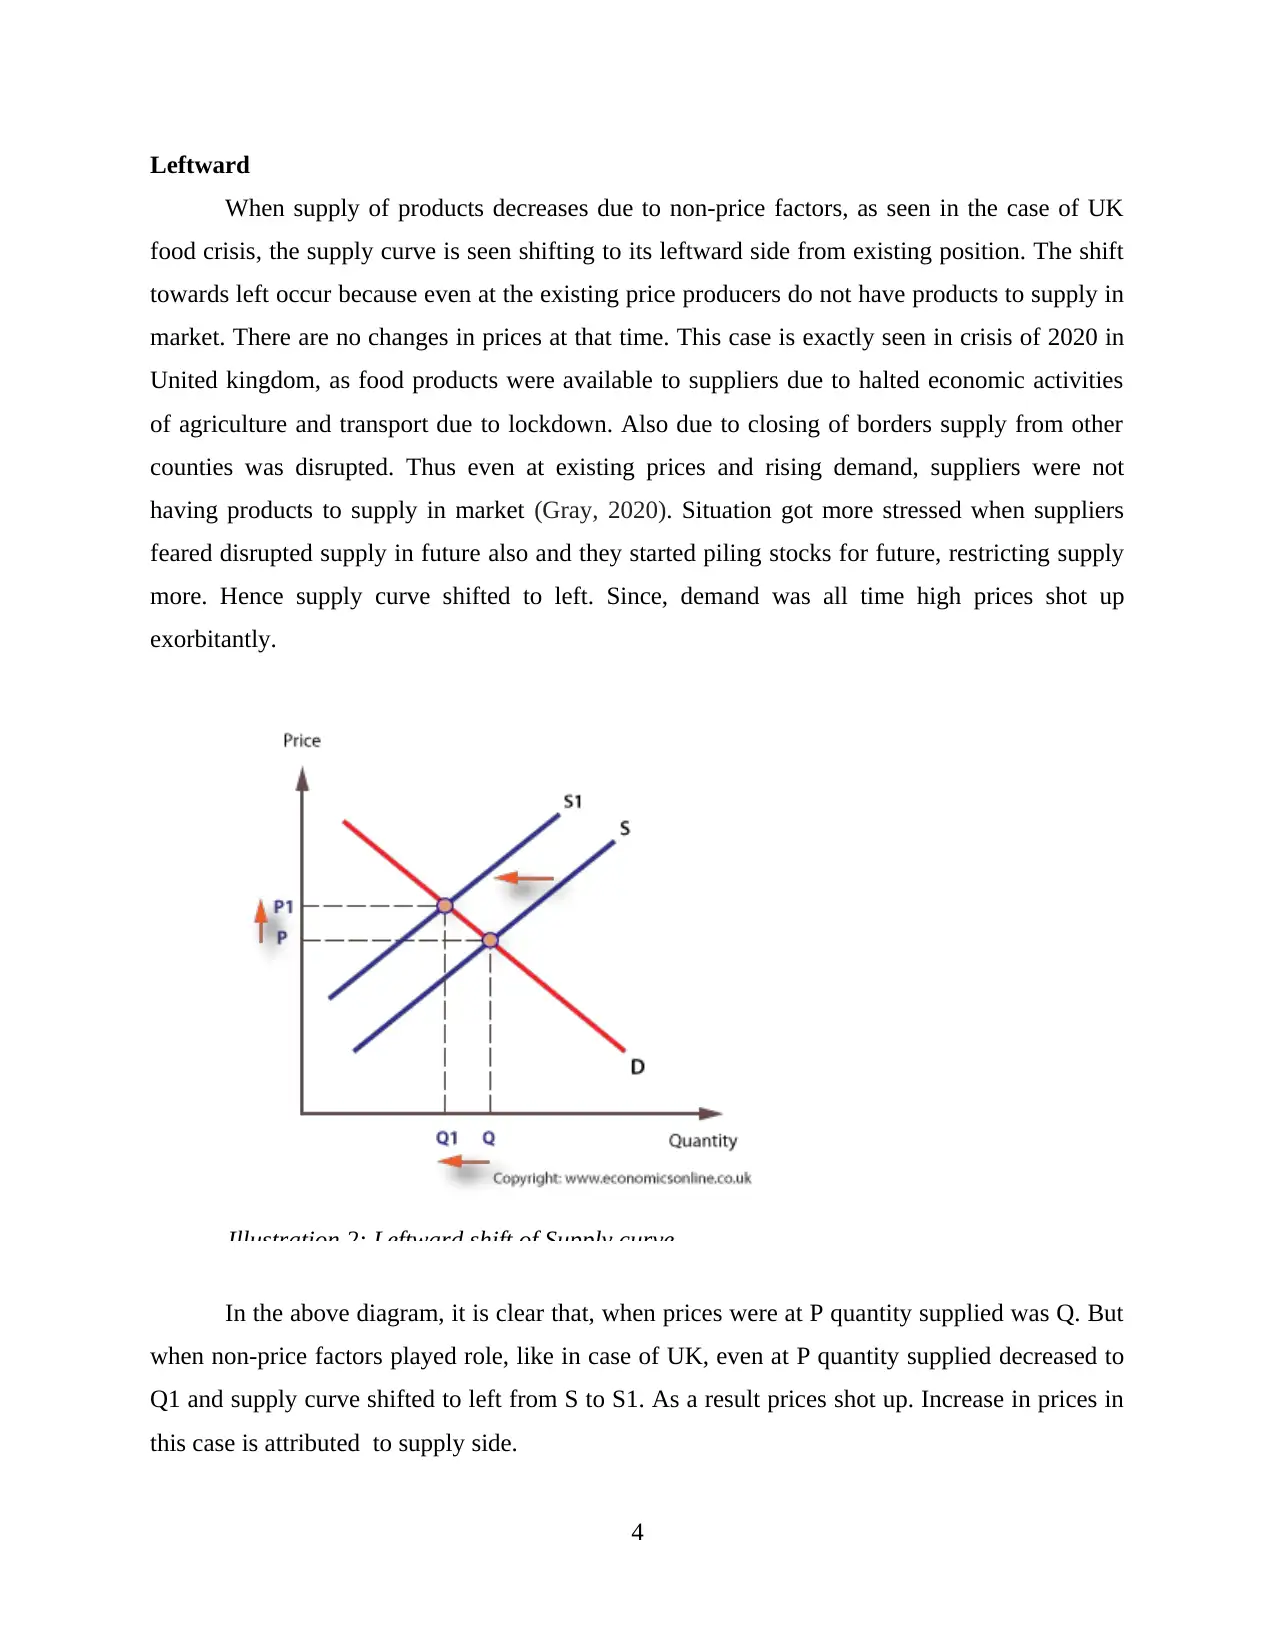
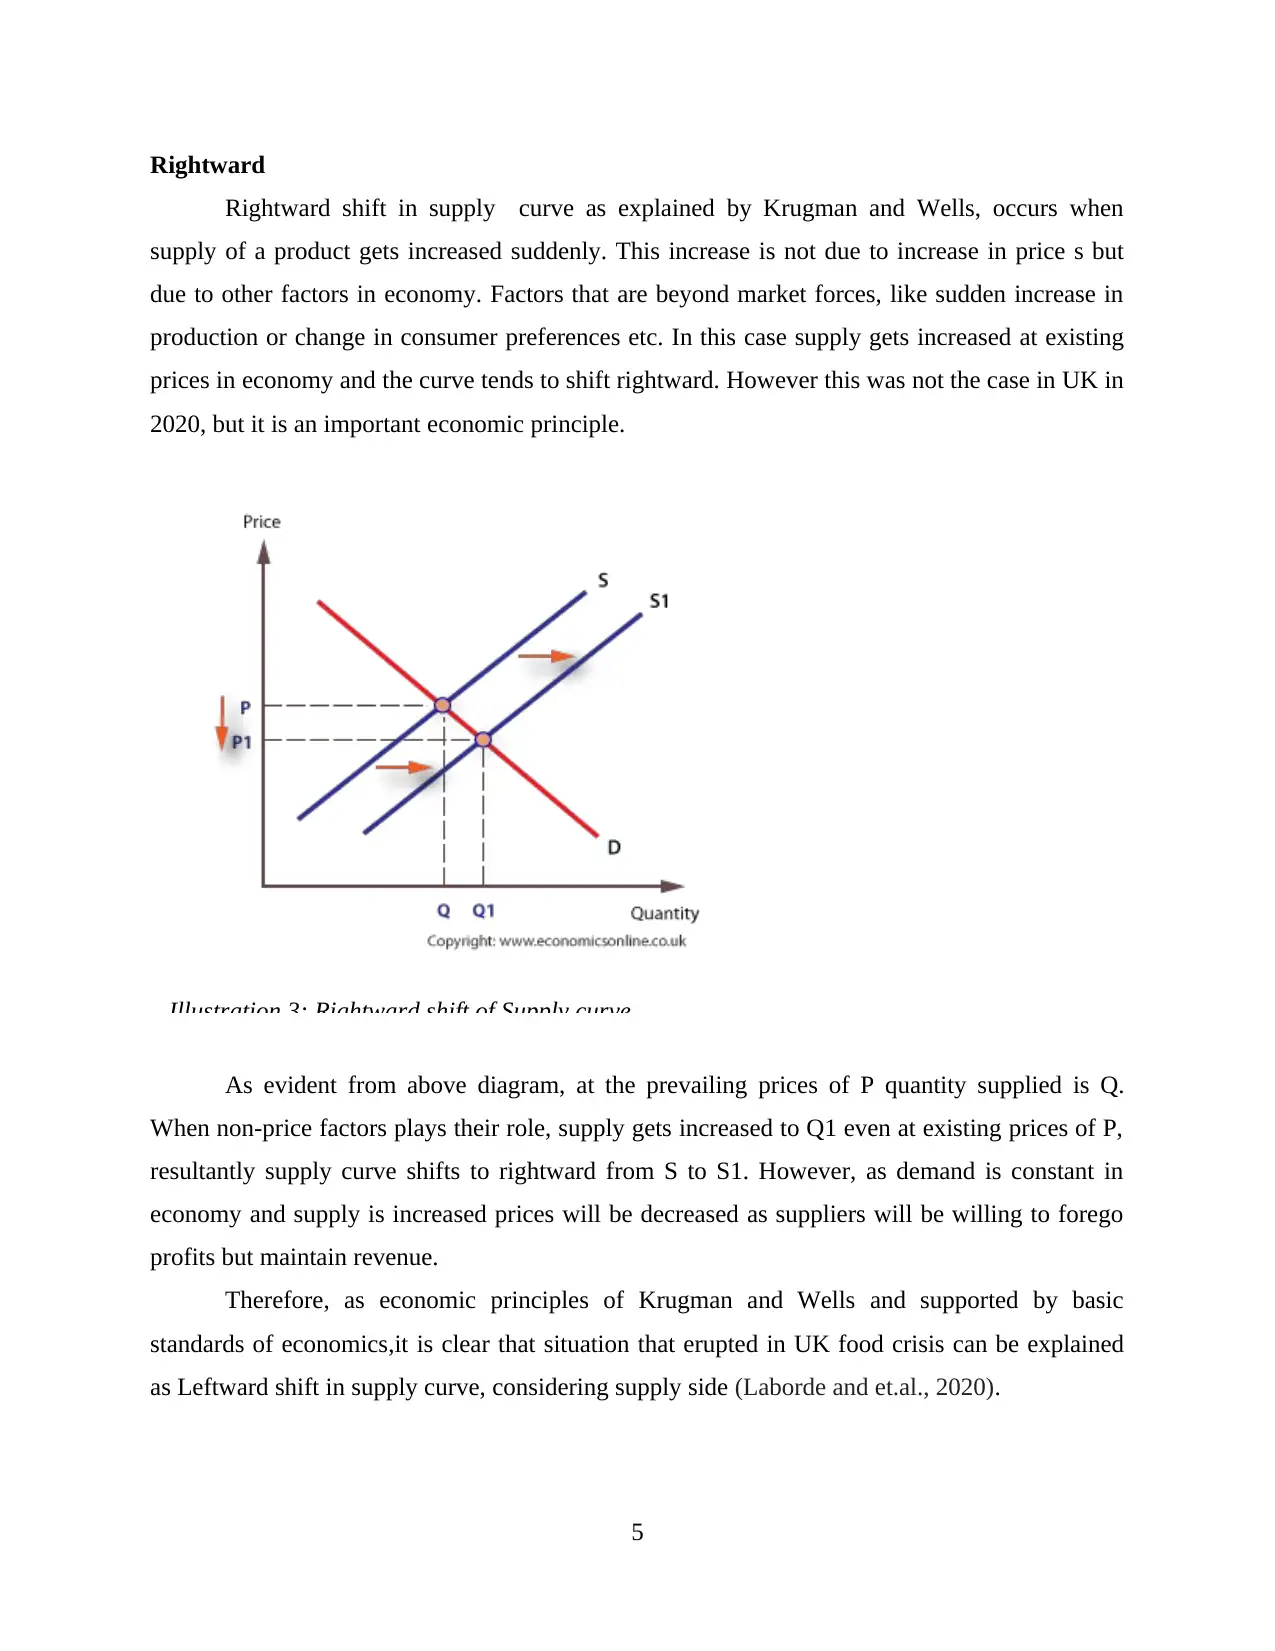
As evident from above diagram, at the prevailing prices of P quantity supplied is Q.
When non-price factors plays their role, supply gets increased to Q1 even at existing prices of P,
resultantly supply curve shifts to rightward from S to S1. However, as demand is constant in
economy and supply is increased prices will be decreased as suppliers will be willing to forego
profits but maintain revenue.
Therefore, as economic principles of Krugman and Wells and supported by basic
standards of economics,it is clear that situation that erupted in UK food crisis can be explained
as Leftward shift in supply curve, considering supply side (Laborde and et.al., 2020).
5
Illustration 3: Rightward shift of Supply curve
Rightward shift in supply curve as explained by Krugman and Wells, occurs when
supply of a product gets increased suddenly. This increase is not due to increase in price s but
due to other factors in economy. Factors that are beyond market forces, like sudden increase in
production or change in consumer preferences etc. In this case supply gets increased at existing
prices in economy and the curve tends to shift rightward. However this was not the case in UK in
2020, but it is an important economic principle.
As evident from above diagram, at the prevailing prices of P quantity supplied is Q.
When non-price factors plays their role, supply gets increased to Q1 even at existing prices of P,
resultantly supply curve shifts to rightward from S to S1. However, as demand is constant in
economy and supply is increased prices will be decreased as suppliers will be willing to forego
profits but maintain revenue.
Therefore, as economic principles of Krugman and Wells and supported by basic
standards of economics,it is clear that situation that erupted in UK food crisis can be explained
as Leftward shift in supply curve, considering supply side (Laborde and et.al., 2020).
5
Illustration 3: Rightward shift of Supply curve
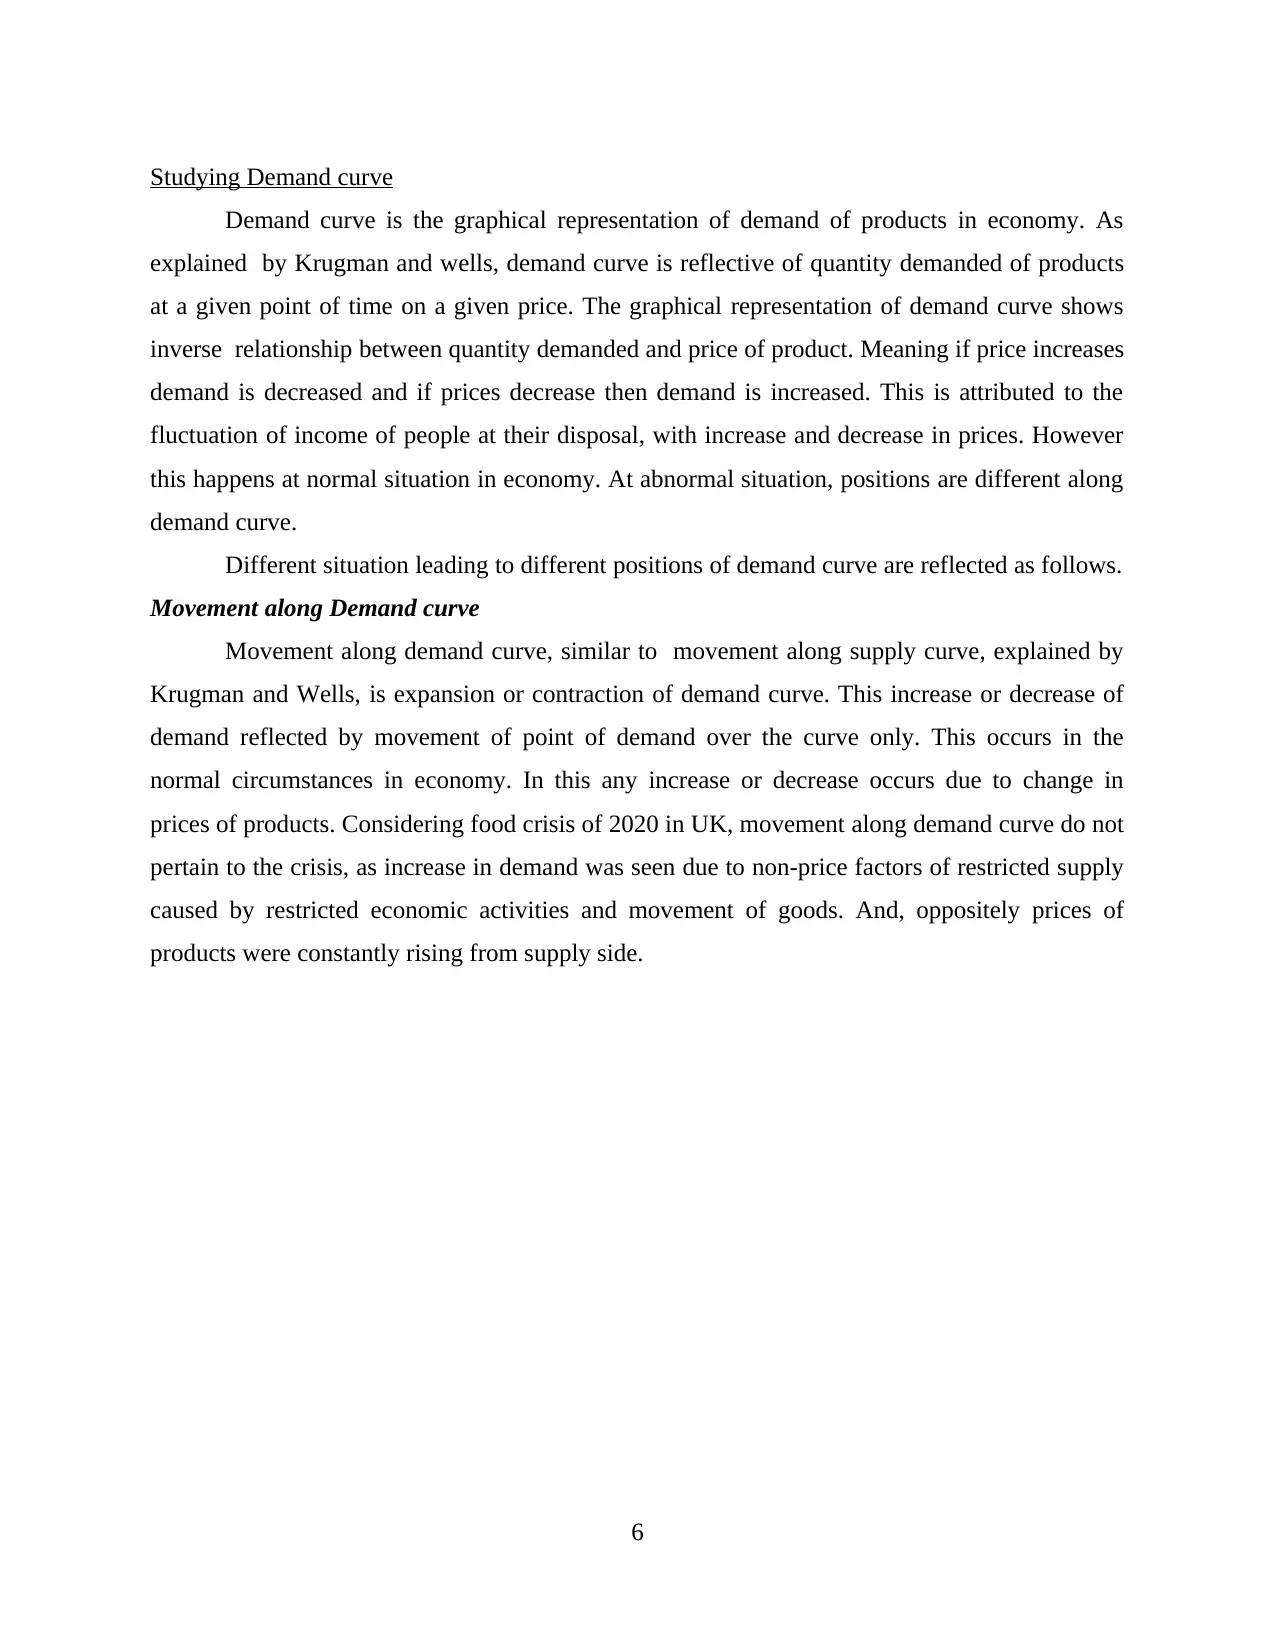
Studying Demand curve
Demand curve is the graphical representation of demand of products in economy. As
explained by Krugman and wells, demand curve is reflective of quantity demanded of products
at a given point of time on a given price. The graphical representation of demand curve shows
inverse relationship between quantity demanded and price of product. Meaning if price increases
demand is decreased and if prices decrease then demand is increased. This is attributed to the
fluctuation of income of people at their disposal, with increase and decrease in prices. However
this happens at normal situation in economy. At abnormal situation, positions are different along
demand curve.
Different situation leading to different positions of demand curve are reflected as follows.
Movement along Demand curve
Movement along demand curve, similar to movement along supply curve, explained by
Krugman and Wells, is expansion or contraction of demand curve. This increase or decrease of
demand reflected by movement of point of demand over the curve only. This occurs in the
normal circumstances in economy. In this any increase or decrease occurs due to change in
prices of products. Considering food crisis of 2020 in UK, movement along demand curve do not
pertain to the crisis, as increase in demand was seen due to non-price factors of restricted supply
caused by restricted economic activities and movement of goods. And, oppositely prices of
products were constantly rising from supply side.
6
⊘ This is a preview!⊘
Do you want full access?
Subscribe today to unlock all pages.
Trusted by 1+ million students worldwide
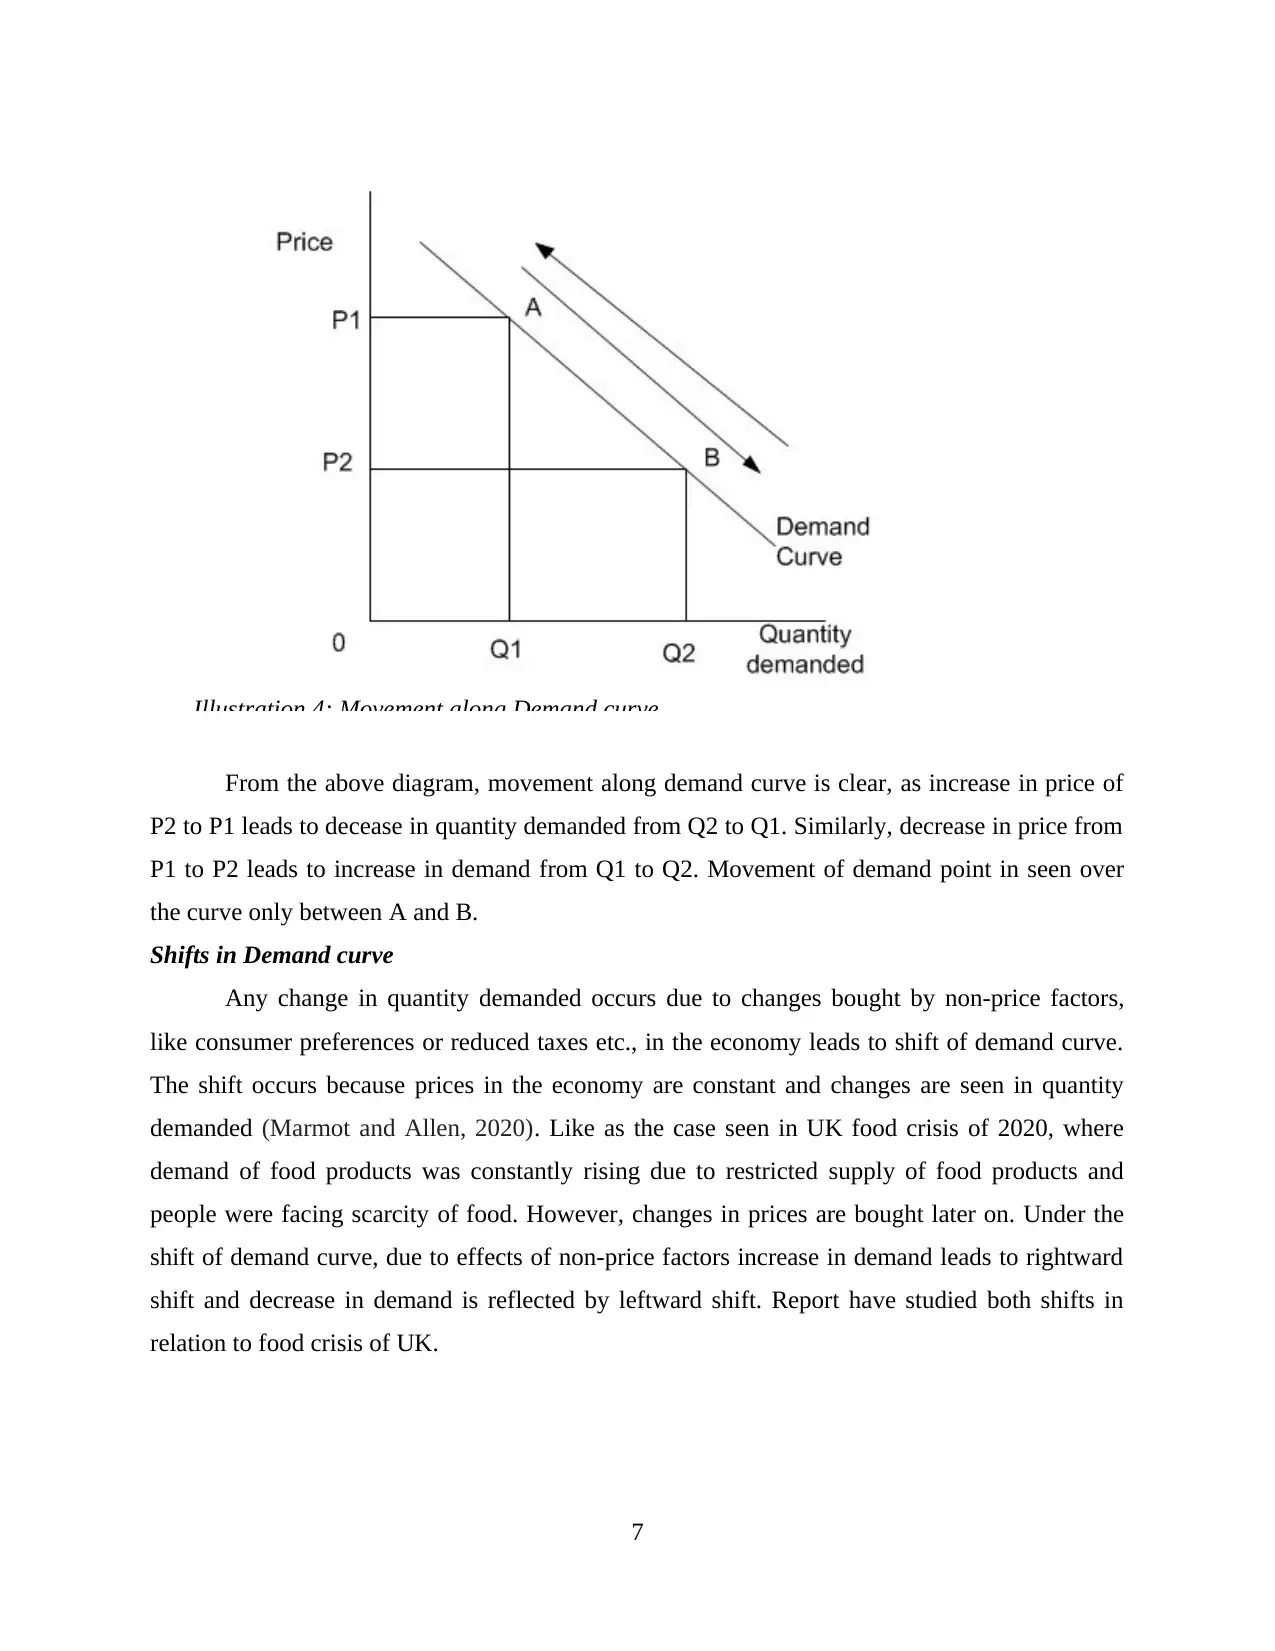
From the above diagram, movement along demand curve is clear, as increase in price of
P2 to P1 leads to decease in quantity demanded from Q2 to Q1. Similarly, decrease in price from
P1 to P2 leads to increase in demand from Q1 to Q2. Movement of demand point in seen over
the curve only between A and B.
Shifts in Demand curve
Any change in quantity demanded occurs due to changes bought by non-price factors,
like consumer preferences or reduced taxes etc., in the economy leads to shift of demand curve.
The shift occurs because prices in the economy are constant and changes are seen in quantity
demanded (Marmot and Allen, 2020). Like as the case seen in UK food crisis of 2020, where
demand of food products was constantly rising due to restricted supply of food products and
people were facing scarcity of food. However, changes in prices are bought later on. Under the
shift of demand curve, due to effects of non-price factors increase in demand leads to rightward
shift and decrease in demand is reflected by leftward shift. Report have studied both shifts in
relation to food crisis of UK.
7
Illustration 4: Movement along Demand curve
Paraphrase This Document
Need a fresh take? Get an instant paraphrase of this document with our AI Paraphraser
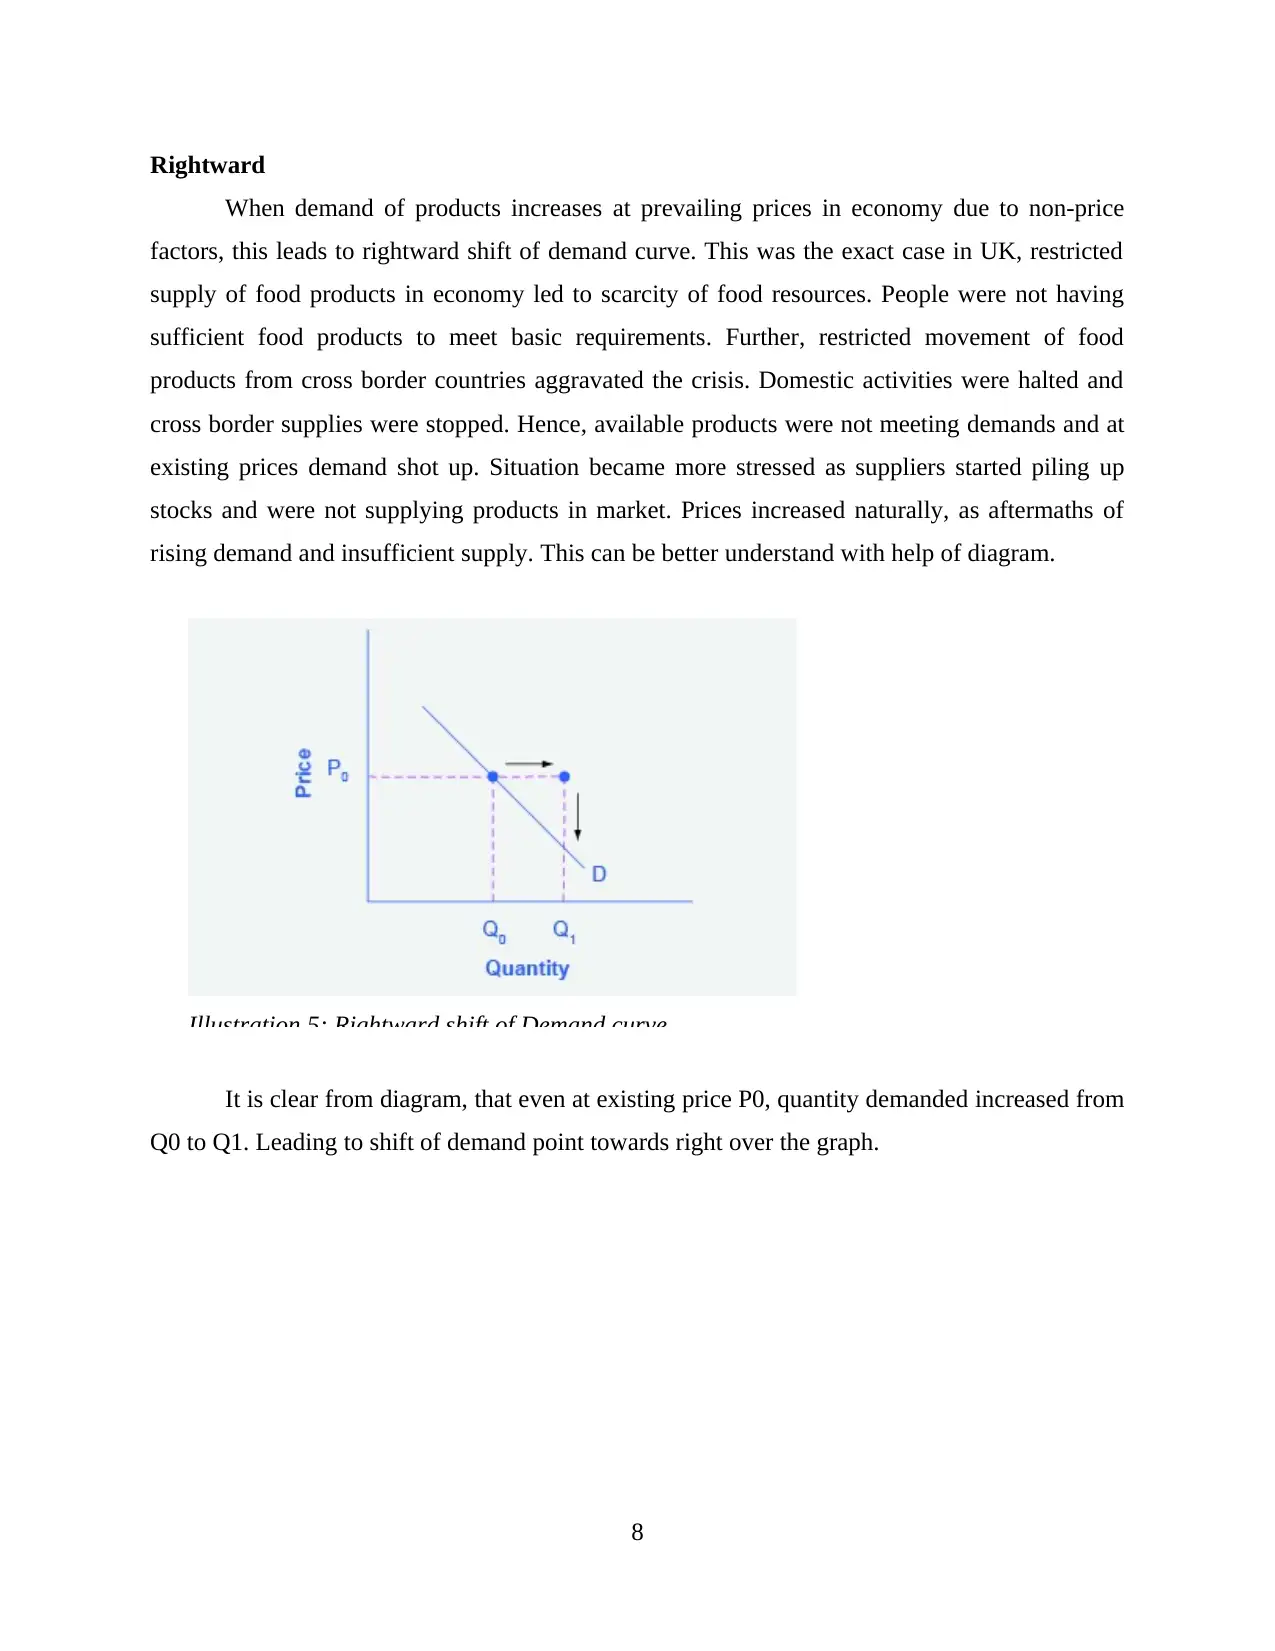
Rightward
When demand of products increases at prevailing prices in economy due to non-price
factors, this leads to rightward shift of demand curve. This was the exact case in UK, restricted
supply of food products in economy led to scarcity of food resources. People were not having
sufficient food products to meet basic requirements. Further, restricted movement of food
products from cross border countries aggravated the crisis. Domestic activities were halted and
cross border supplies were stopped. Hence, available products were not meeting demands and at
existing prices demand shot up. Situation became more stressed as suppliers started piling up
stocks and were not supplying products in market. Prices increased naturally, as aftermaths of
rising demand and insufficient supply. This can be better understand with help of diagram.
It is clear from diagram, that even at existing price P0, quantity demanded increased from
Q0 to Q1. Leading to shift of demand point towards right over the graph.
8
Illustration 5: Rightward shift of Demand curve
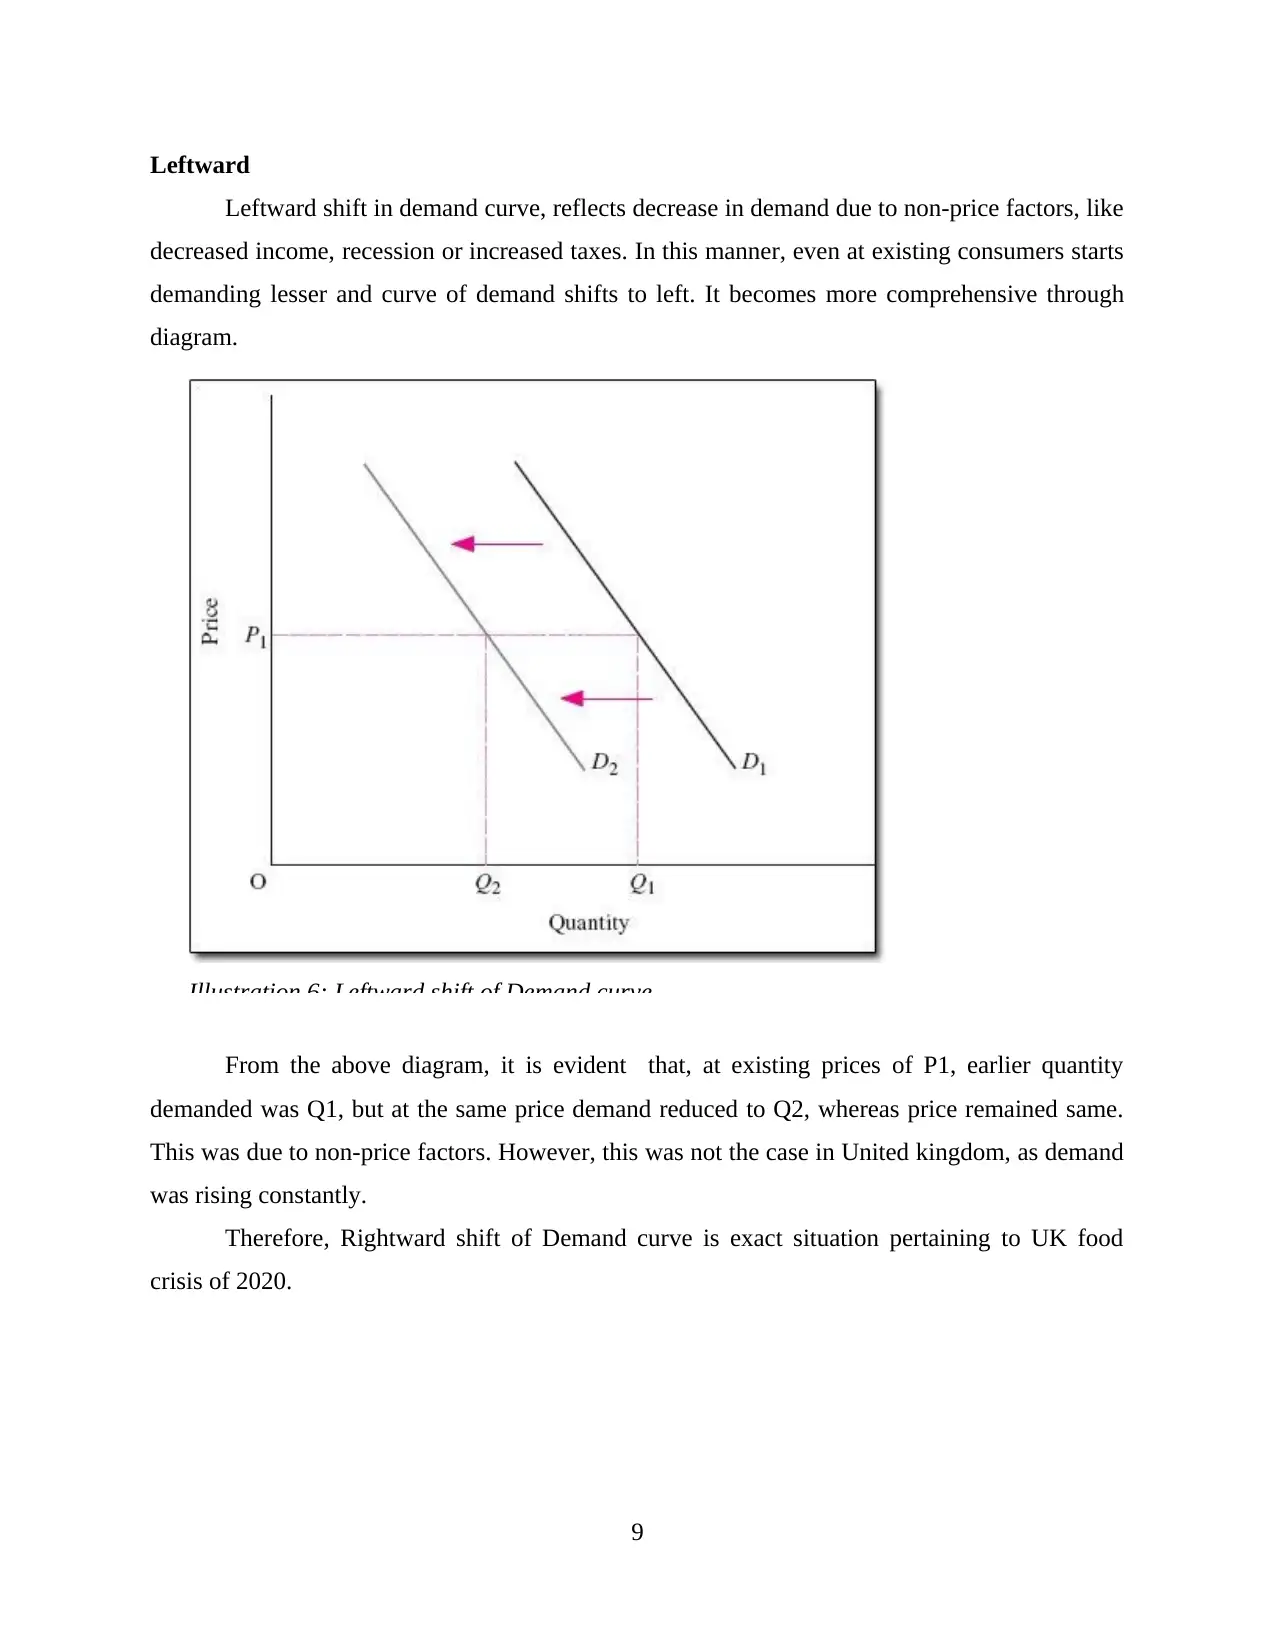
Leftward
Leftward shift in demand curve, reflects decrease in demand due to non-price factors, like
decreased income, recession or increased taxes. In this manner, even at existing consumers starts
demanding lesser and curve of demand shifts to left. It becomes more comprehensive through
diagram.
From the above diagram, it is evident that, at existing prices of P1, earlier quantity
demanded was Q1, but at the same price demand reduced to Q2, whereas price remained same.
This was due to non-price factors. However, this was not the case in United kingdom, as demand
was rising constantly.
Therefore, Rightward shift of Demand curve is exact situation pertaining to UK food
crisis of 2020.
9
Illustration 6: Leftward shift of Demand curve
⊘ This is a preview!⊘
Do you want full access?
Subscribe today to unlock all pages.
Trusted by 1+ million students worldwide
1 out of 17
Related Documents


Your All-in-One AI-Powered Toolkit for Academic Success.
+13062052269
info@desklib.com
Available 24*7 on WhatsApp / Email
![[object Object]](/_next/static/media/star-bottom.7253800d.svg)
Unlock your academic potential
Copyright © 2020–2026 A2Z Services. All Rights Reserved. Developed and managed by ZUCOL.