Analyzing the Economic Factors Behind the UK Food Crisis of 2020
VerifiedAdded on 2022/12/26
|16
|3956
|88
Report
AI Summary
This report provides an economic analysis of the UK food crisis of 2020, triggered by factors such as COVID-19 lockdowns and Brexit. It explores the concepts of supply and demand, market equilibrium, and the impact of government interventions. The report highlights how lockdown measures disrupted supply chains, leading to shortages and hoarding, while also examining the role of external factors beyond market forces. It further discusses the economic principles of market failure and evaluates the effectiveness of government interventions, providing a comprehensive overview of the crisis and its underlying causes. Desklib offers this and other solved assignments for students.
ECONOMICS FOR
BUSINESS
BUSINESS
Paraphrase This Document
Need a fresh take? Get an instant paraphrase of this document with our AI Paraphraser
EXECUTIVE SUMMARY
COVID-19 have came as the biggest crisis of 21st century. The pandemic that posed
health risks to the population around the world, not came alone as a health disaster but
interrupted all sorts of activities like economic, travel, administrative, social or altruistic,
educational and all. Therefore, it have not came alone and affected health in solidarity, but
affected financial health of people as well. Since the Coronavirus was one which seemed to have
been spreading through physical touch and close contacts among people as well. The most
accurate measure though by governments across the world was to Lockdown. Lockdown is a tool
that means noting but shutdown and temporary closure of economic activities and movement of
people. Also under this tool borders are closed in different levels, such as in locality, city
districts states and even at national level. This is to avoid any entry of infectious person from
outside to the area. This measure of lockdown was also adopted by UK government, for similar
purpose. The motive of government was nothing but to contain spread of virus. But what was
seen is different in the country. The virus spread was though could not get controlled whereas
financial crisis together with food crisis had caught people badly an d made them fall under a
very vicious trap, that not only affected their health adversely but grappled their lifestyle.
Table of Contents
EXECUTIVE SUMMARY.............................................................................................................2
INTRODUCTION...........................................................................................................................4
TASK 1............................................................................................................................................4
Understanding Supply............................................................................................................5
Understanding Demand..........................................................................................................8
Understanding Equilibrium..................................................................................................12
Understanding Shortages and Surplus..................................................................................12
TASK 2..........................................................................................................................................13
Economic Principles of Market Failure................................................................................13
Interventions of Government................................................................................................13
Disagreeing with Government interventions........................................................................14
CONCLUSION..............................................................................................................................15
REFERENCES..............................................................................................................................16
Books and Journals...............................................................................................................16
⊘ This is a preview!⊘
Do you want full access?
Subscribe today to unlock all pages.
Trusted by 1+ million students worldwide
INTRODUCTION
Food crisis is one of the worst situations that is faced by people in society, where the
basic necessity of life do not lie in the affordability range of people. Their social troubles
increases and leads to many other problems as well, like enriching socio-economic disparity.
One such crisis was faced by United Kingdom in year 2020, which is attributable to many
reasons (Clapp and Moseley, 2020).
In this report, an analysis of food crisis occurred in UK as result of multiple factors, that
led to the crisis. The analysis in the report is divided into two parts, TASK 1 and TASK 2. In the
TASK 1, report has made understanding of the food crisis with the help of Economic concepts of
market forces of Demand and Supply and has also attempted to understand positioning of Market
Equilibrium. This supports the discussion in gaining knowledge from basics. In TASK 2, report
have discussed initiatives taken by the government and their value in solving UK food crisis
have been evaluated.
TASK 1
The problem of food crisis emerged in the United Kingdom was result of multiple
factors. First of all the crisis emerged as the situation bought by controlling measure of
Lockdown. Even though food production in the country continued but the suply was disrupted in
such a way that shortages were seen in market. One other solution that could have helped was
outsourcing of food and meat products from other countries but the lockdown have made borders
closed from side of UK Government as well as from side of other countries. Brexit decision of
UK government, loosened faith of international markets in the country and imports of food and
meat products declined from there as well. However this was the initial problem where there
were supply disruptions and stress over existing stock of food grains. The time when this stress
as turned into crisis is the real issue. The crisis was mainly emerged due to prolonging of
lockdown (Lin, Lloyd and McCorriston, 2020). Also suppliers in market were latter seen
becoming reluctant to release existing stock of food products and started hoarding the stock.
They were doing so because of fearing future supply of food products. Hence this resulted in
scarcity of food products. Now where earlier borders were closed from both sides, some of the
countries became more reluctant to exchange trade with UK, when new strain of virus was
detected from country.
Paraphrase This Document
Need a fresh take? Get an instant paraphrase of this document with our AI Paraphraser
Understanding the problem of food crisis in UK economy would be better conducted
when considered from core. Therefore, the report have attempted understanding this issue using
economic concepts of supply and demand supported by principles and approach of Krugman and
Wells.
Understanding Supply
Supply is the quantum of food products that were available in the market of United
Kingdom the was available and supplied by the suppliers in the market, at the particular point of
time and at particular prices. Supply in the context of food crisis is considerable at multiple point
time, hence it can be analysed through phases. The curve that denotes supply in market on a
given quantity and at given price at different time scales is called Supply curve. Supply is of food
products and any change in it is directly related with price of products. And the relation between
two is considered directly proportional to each other (Lang, 2020). This means supply of
products increases with increase in prices to help suppliers generating more revenues. However,
this is the change in supply under normal circumstances when all other factors are constant and
only market forces are working. But in abnormal circumstances changes in supply are bought by
factors other than market forces.
In the market of United Kingdom, suppliers were ready to supply food products at the
prevailing prices set by market forces. But when availability to them was disrupted and they
feared any future supply of products to them they started hoardings of products with them. At
this point market forces stopped working on supply and supply totally fell over whims and
fancies of suppliers. This is when abnormal circumstances got created. The situation here
emerged can be understand better from taking concepts of supply in context together (The British
government's first disaster of 2021? A food shortage, 2021).
Movement along Supply curve
Movement along supply curve is understandable with changes in supply happening
rightly because of changes in prices and other factor of market was influential. In the Food
market of UK this economic concept was visible when policies of suppliers was stable and in
favour of market. Here, change along supply curve is reflected by movement of supply along the
curve. Now, since in this phenomenon changes are bought by prices. This phenomenon does not
relate with Food crisis of UK in 2020, where change ion supply of food products was affected by
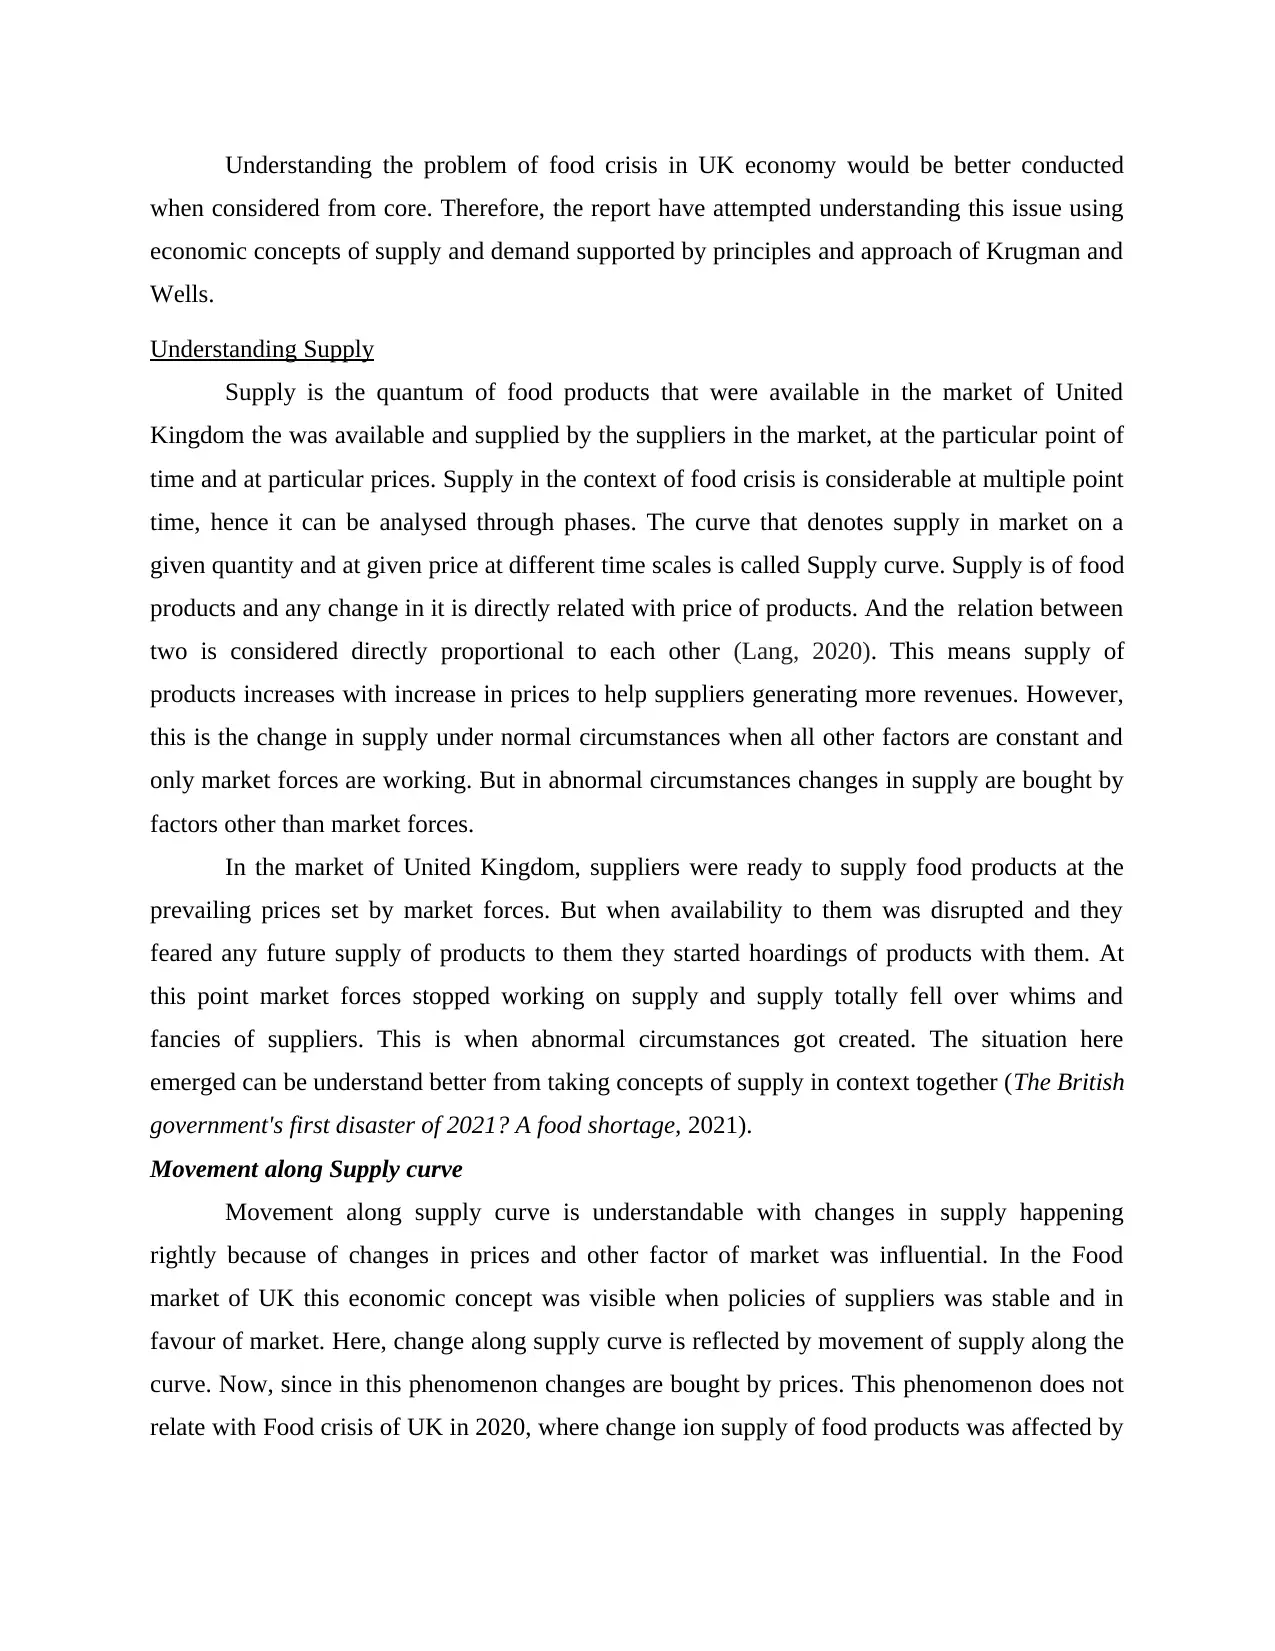
external factors. The report have understood movement along supply curve with help of diagram
as well.
The diagram above reflects movement of supply or change in supply along the supply
curve only, when prices were influencing supply. At the increased prices of P2 suppliers in
market were supplying increased quantity of Q2. The increase in prices is brought by increased
demand. At the existing prices demand went up and so do the prices, and for increasing revenues
suppliers started supplying Q2.
Shift of Supply curve
Explained by Krugman and Wells, shift in supply curve is the changes in supply of
products in market supplied by suppliers or producers which is led by forces beyond the market
or external factors. This is basically the change not bought or driven by prices of products. These
factors that act from outside are of different nature such as consumer preferences, income levels,
taxation policy and several others (Weinberg, 2020). These factors changes supply in market at
existing or prevailing prices. Therefore this makes supply curve shift from one point to another.
This economic phenomenon, explained by Krugman and Wells, is related with food crisis in
Illustration 1: Movement along Supply curve
⊘ This is a preview!⊘
Do you want full access?
Subscribe today to unlock all pages.
Trusted by 1+ million students worldwide
United Kingdom of year 2020. The report have made understanding of this concept with
studying two different shifts separately.
Leftward
Leftward shift of supply curve reflects decrease in supply of products in market under the
influence of external factors. When supply of products are decreased not because of price but any
other factor, this change leads to shifty in supply curve to the left at prevailing price only.
However, it is not that prices remains unchanged, changes in prices are reflected afterwards.
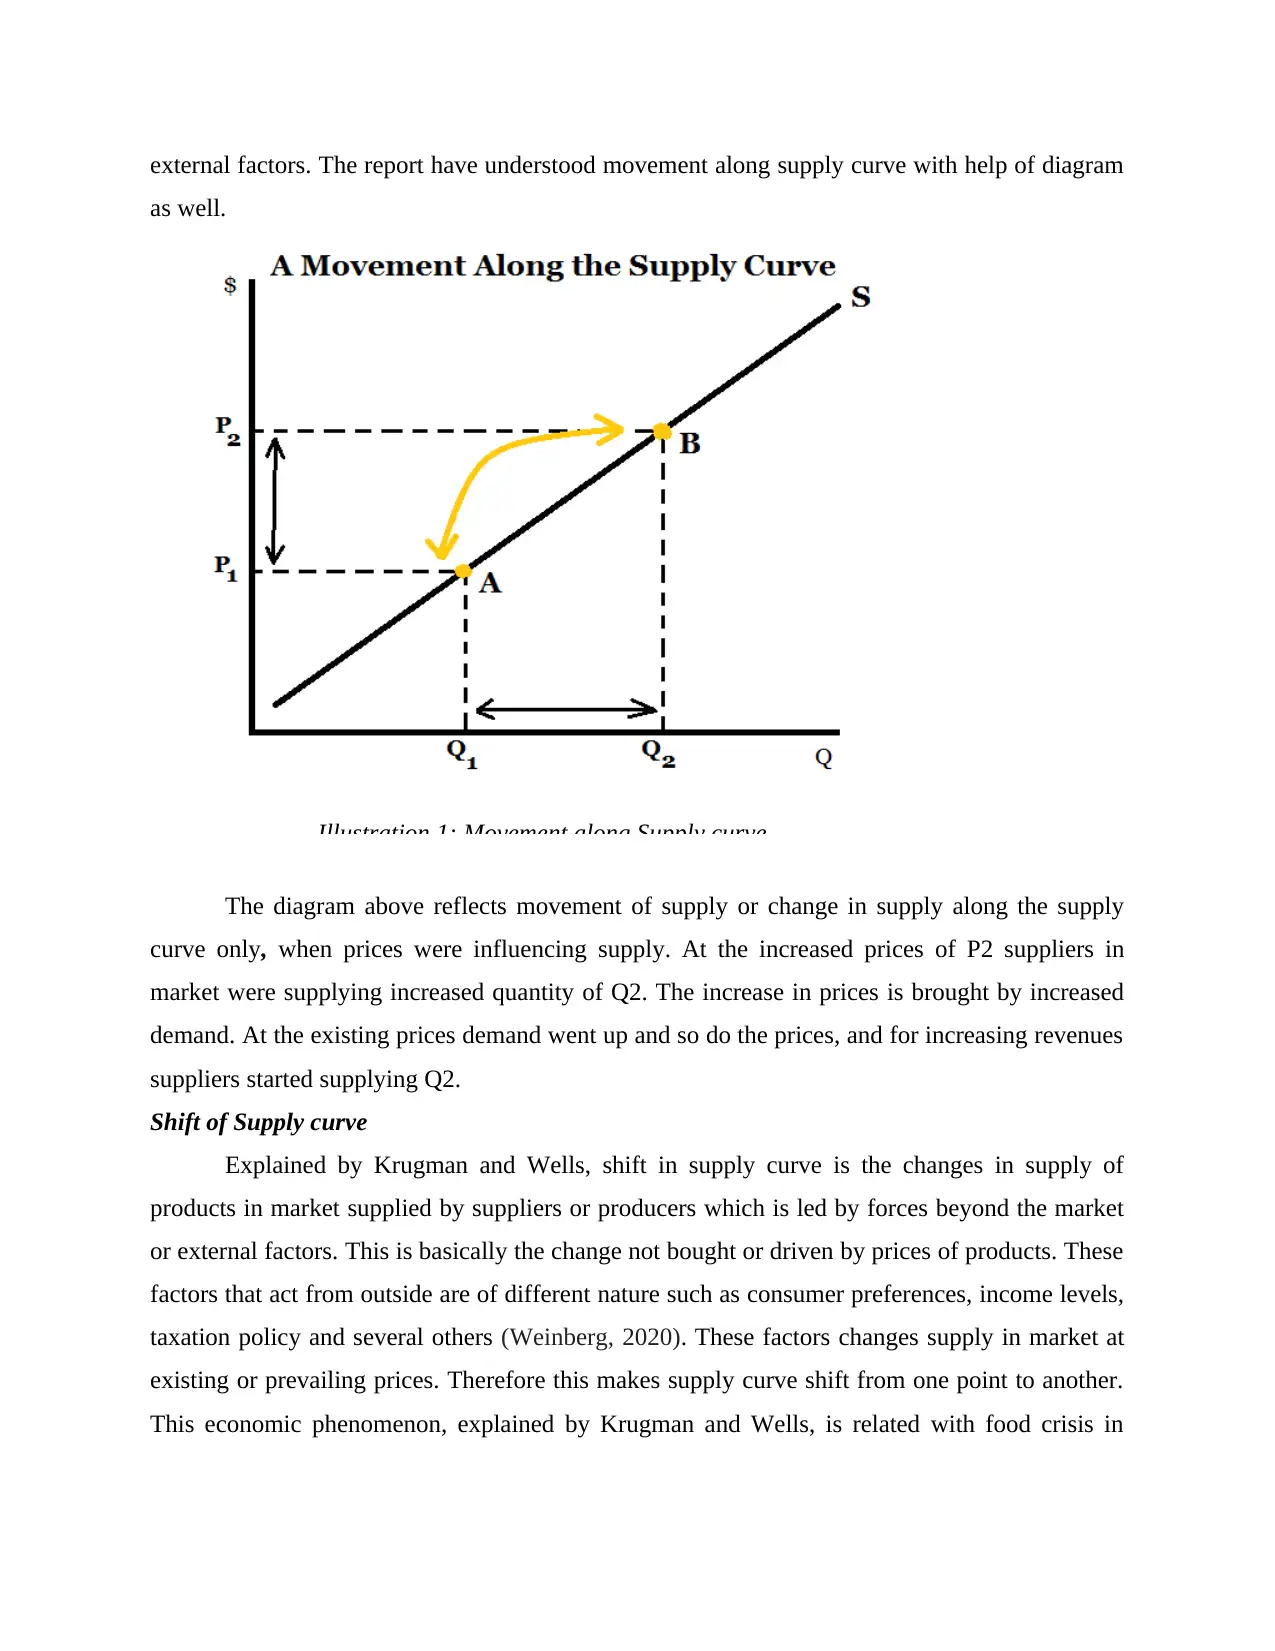
This had been the exact case in economy of UK in year 2020, when it suffered food
crisis. The supply of products in the market was disrupted due to external factors of restriction in
movement of goods and halt in carrying agricultural activities. Also, when suppliers started
hoarding of products fearing restricted supplies in future. However at this time prices of food
products were unchanged but supply got decreased. Therefore supply curve shifted to left. This
can be better understood with help of a diagram.
In the above digram true nature of Crisis of 2020 is reflected. Before the scarcity of food
products emerged in market of UK, supply was standing at Q where prices were at P. After
external factors played their role of halted agricultural activities played and then hoarding was
made by suppliers, supply was decreased to Q1. Hence, supply curve can be seen shifting from
Illustration 2: Leftward shift of Supply curve
studying two different shifts separately.
Leftward
Leftward shift of supply curve reflects decrease in supply of products in market under the
influence of external factors. When supply of products are decreased not because of price but any
other factor, this change leads to shifty in supply curve to the left at prevailing price only.
However, it is not that prices remains unchanged, changes in prices are reflected afterwards.
This had been the exact case in economy of UK in year 2020, when it suffered food
crisis. The supply of products in the market was disrupted due to external factors of restriction in
movement of goods and halt in carrying agricultural activities. Also, when suppliers started
hoarding of products fearing restricted supplies in future. However at this time prices of food
products were unchanged but supply got decreased. Therefore supply curve shifted to left. This
can be better understood with help of a diagram.
In the above digram true nature of Crisis of 2020 is reflected. Before the scarcity of food
products emerged in market of UK, supply was standing at Q where prices were at P. After
external factors played their role of halted agricultural activities played and then hoarding was
made by suppliers, supply was decreased to Q1. Hence, supply curve can be seen shifting from
Illustration 2: Leftward shift of Supply curve
Paraphrase This Document
Need a fresh take? Get an instant paraphrase of this document with our AI Paraphraser
S to S1, at prevailing prices of P. However, change in price is not spared and an effect over it is
visible afterwards as a result of excess demand. Price thus increased from P to P1.
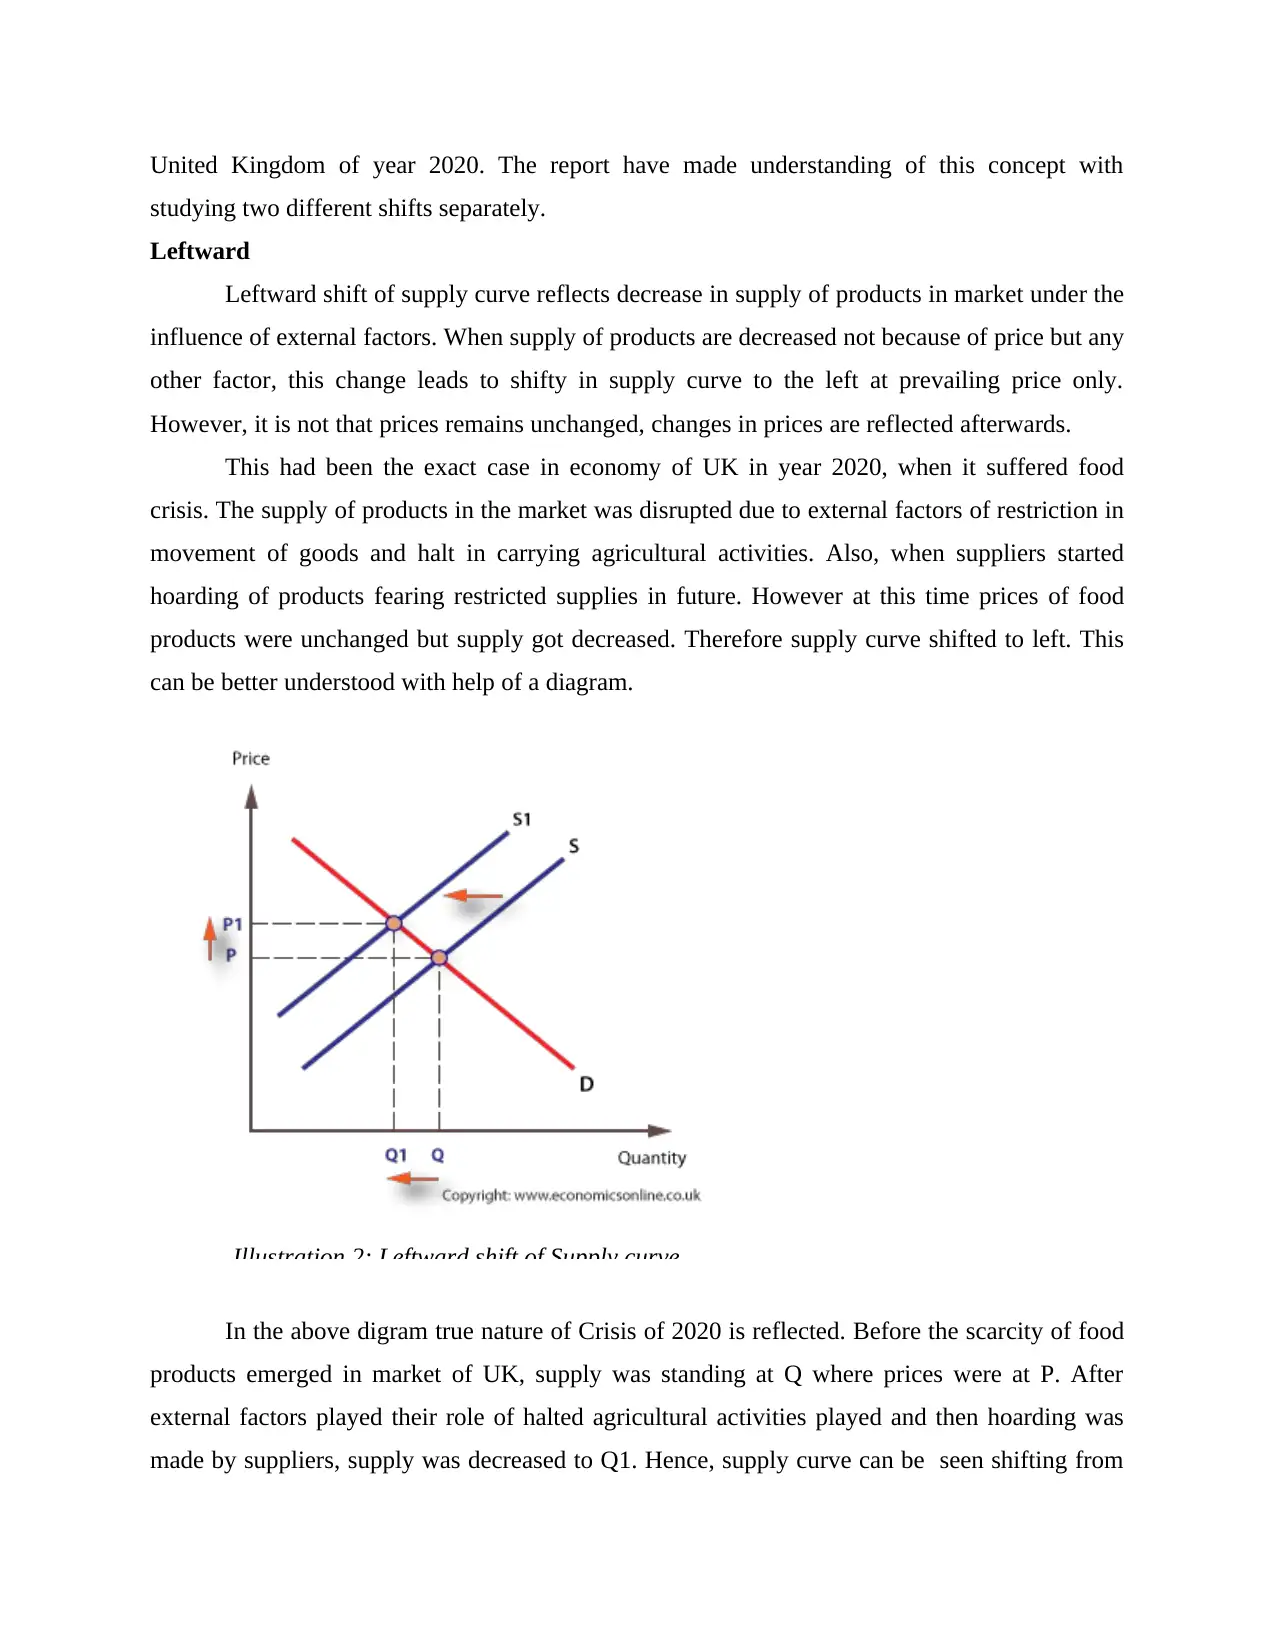
Rightward
Rightward shift in supply curve is indicated to increase in supply of products at a given
point of time driven by external factors, beyond market forces. This increase is not driven by
increase in price but other factors like change in technology, decrease in tax, change in consumer
preferences etc. This economic phenomenon is not necessarily related with the food crisis of
2020 in UK, but its understanding is important for understanding nature of supply in market. In
its study in report it is helped through diagram as well.
In the above diagram, supply curve can be seen shifting from S to S1, towards right.
Whereas, prices are standing same at P. When external factor came in role, for example change
in technology, supply can be seen increasing from Q to Q1, at price P. resultantly, supply curve
shifted to S1 from S.
Understanding Demand
As explained by concepts of Krugman and Wells, Demand stands for quantity demanded
of products in market on a given price and at a given point of time. Demand is the willingness to
Illustration 3: Rightward shift of Supply curve
visible afterwards as a result of excess demand. Price thus increased from P to P1.
Rightward
Rightward shift in supply curve is indicated to increase in supply of products at a given
point of time driven by external factors, beyond market forces. This increase is not driven by
increase in price but other factors like change in technology, decrease in tax, change in consumer
preferences etc. This economic phenomenon is not necessarily related with the food crisis of
2020 in UK, but its understanding is important for understanding nature of supply in market. In
its study in report it is helped through diagram as well.
In the above diagram, supply curve can be seen shifting from S to S1, towards right.
Whereas, prices are standing same at P. When external factor came in role, for example change
in technology, supply can be seen increasing from Q to Q1, at price P. resultantly, supply curve
shifted to S1 from S.
Understanding Demand
As explained by concepts of Krugman and Wells, Demand stands for quantity demanded
of products in market on a given price and at a given point of time. Demand is the willingness to
Illustration 3: Rightward shift of Supply curve
buyers to avail a commodity along with willingness to pay for them. In absence of willingness to
pay, a demand is not demand but mere desire (Bell and Blanchflower, 2020). In normal
circumstances demand changes due to change in prices of products. Relations seen between the
two is inversely proportional, that means when price increase demand decease and vice-versa.
The curve that reflect this phenomenon is called demand curve. Demand curve is reflection of
quantity demanded at a given price over different intervals of time and presentation of same on
the graph. In context of UK food crisis of 2020, demand for food products were all time high. It
was stable before lock down but after implementation of it demand went up at same prices. Since
supply was insufficient to meet demand, gap between two kept increasing all the time and
demand was seen exorbitantly higher. But this was not because prices of food products in market
decreased. But because of disrupted supply in market and not accessible by customers.
To get a greater insights about concept of demand, the report have attempted to study
each concept differently, as described by explanations and principles of Krugman and Wells.
Movement along Demand Curve
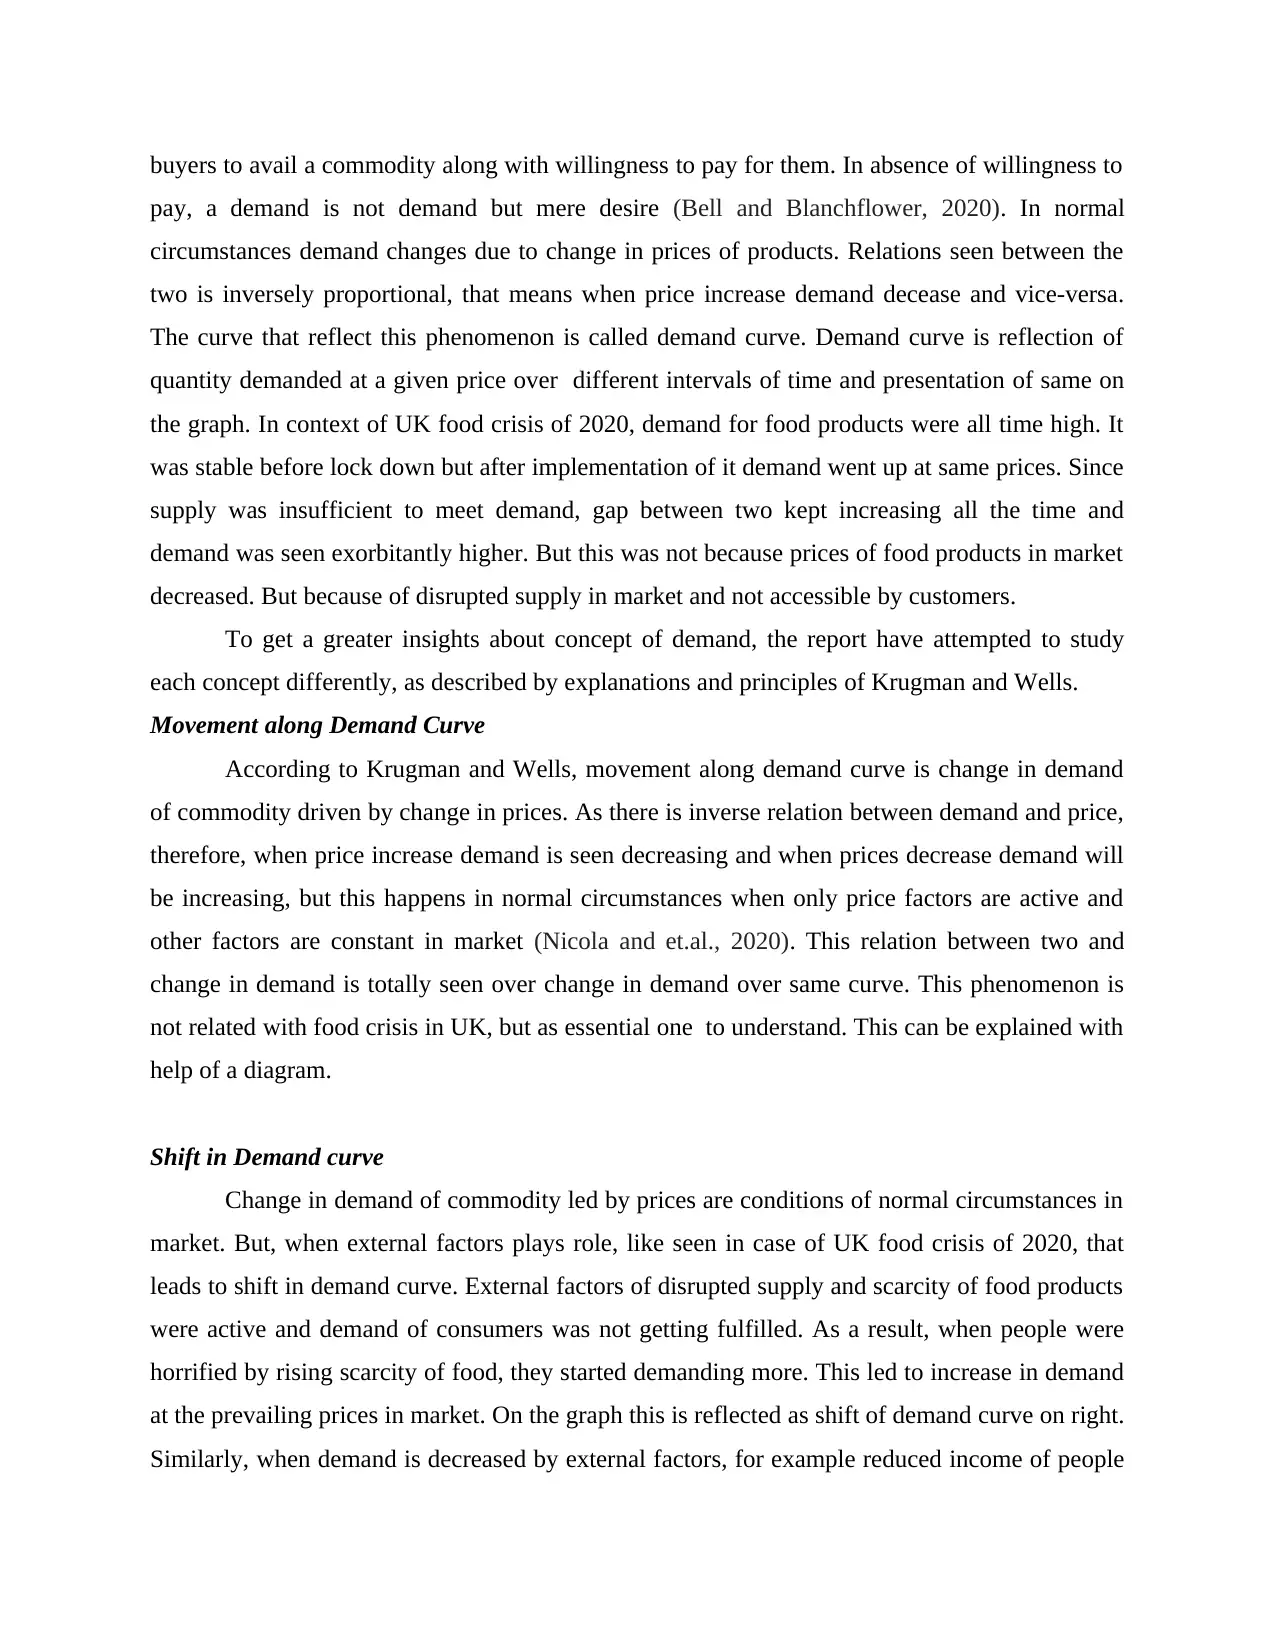
According to Krugman and Wells, movement along demand curve is change in demand
of commodity driven by change in prices. As there is inverse relation between demand and price,
therefore, when price increase demand is seen decreasing and when prices decrease demand will
be increasing, but this happens in normal circumstances when only price factors are active and
other factors are constant in market (Nicola and et.al., 2020). This relation between two and
change in demand is totally seen over change in demand over same curve. This phenomenon is
not related with food crisis in UK, but as essential one to understand. This can be explained with
help of a diagram.
Shift in Demand curve
Change in demand of commodity led by prices are conditions of normal circumstances in
market. But, when external factors plays role, like seen in case of UK food crisis of 2020, that
leads to shift in demand curve. External factors of disrupted supply and scarcity of food products
were active and demand of consumers was not getting fulfilled. As a result, when people were
horrified by rising scarcity of food, they started demanding more. This led to increase in demand
at the prevailing prices in market. On the graph this is reflected as shift of demand curve on right.
Similarly, when demand is decreased by external factors, for example reduced income of people
pay, a demand is not demand but mere desire (Bell and Blanchflower, 2020). In normal
circumstances demand changes due to change in prices of products. Relations seen between the
two is inversely proportional, that means when price increase demand decease and vice-versa.
The curve that reflect this phenomenon is called demand curve. Demand curve is reflection of
quantity demanded at a given price over different intervals of time and presentation of same on
the graph. In context of UK food crisis of 2020, demand for food products were all time high. It
was stable before lock down but after implementation of it demand went up at same prices. Since
supply was insufficient to meet demand, gap between two kept increasing all the time and
demand was seen exorbitantly higher. But this was not because prices of food products in market
decreased. But because of disrupted supply in market and not accessible by customers.
To get a greater insights about concept of demand, the report have attempted to study
each concept differently, as described by explanations and principles of Krugman and Wells.
Movement along Demand Curve
According to Krugman and Wells, movement along demand curve is change in demand
of commodity driven by change in prices. As there is inverse relation between demand and price,
therefore, when price increase demand is seen decreasing and when prices decrease demand will
be increasing, but this happens in normal circumstances when only price factors are active and
other factors are constant in market (Nicola and et.al., 2020). This relation between two and
change in demand is totally seen over change in demand over same curve. This phenomenon is
not related with food crisis in UK, but as essential one to understand. This can be explained with
help of a diagram.
Shift in Demand curve
Change in demand of commodity led by prices are conditions of normal circumstances in
market. But, when external factors plays role, like seen in case of UK food crisis of 2020, that
leads to shift in demand curve. External factors of disrupted supply and scarcity of food products
were active and demand of consumers was not getting fulfilled. As a result, when people were
horrified by rising scarcity of food, they started demanding more. This led to increase in demand
at the prevailing prices in market. On the graph this is reflected as shift of demand curve on right.
Similarly, when demand is decreased by external factors, for example reduced income of people
⊘ This is a preview!⊘
Do you want full access?
Subscribe today to unlock all pages.
Trusted by 1+ million students worldwide
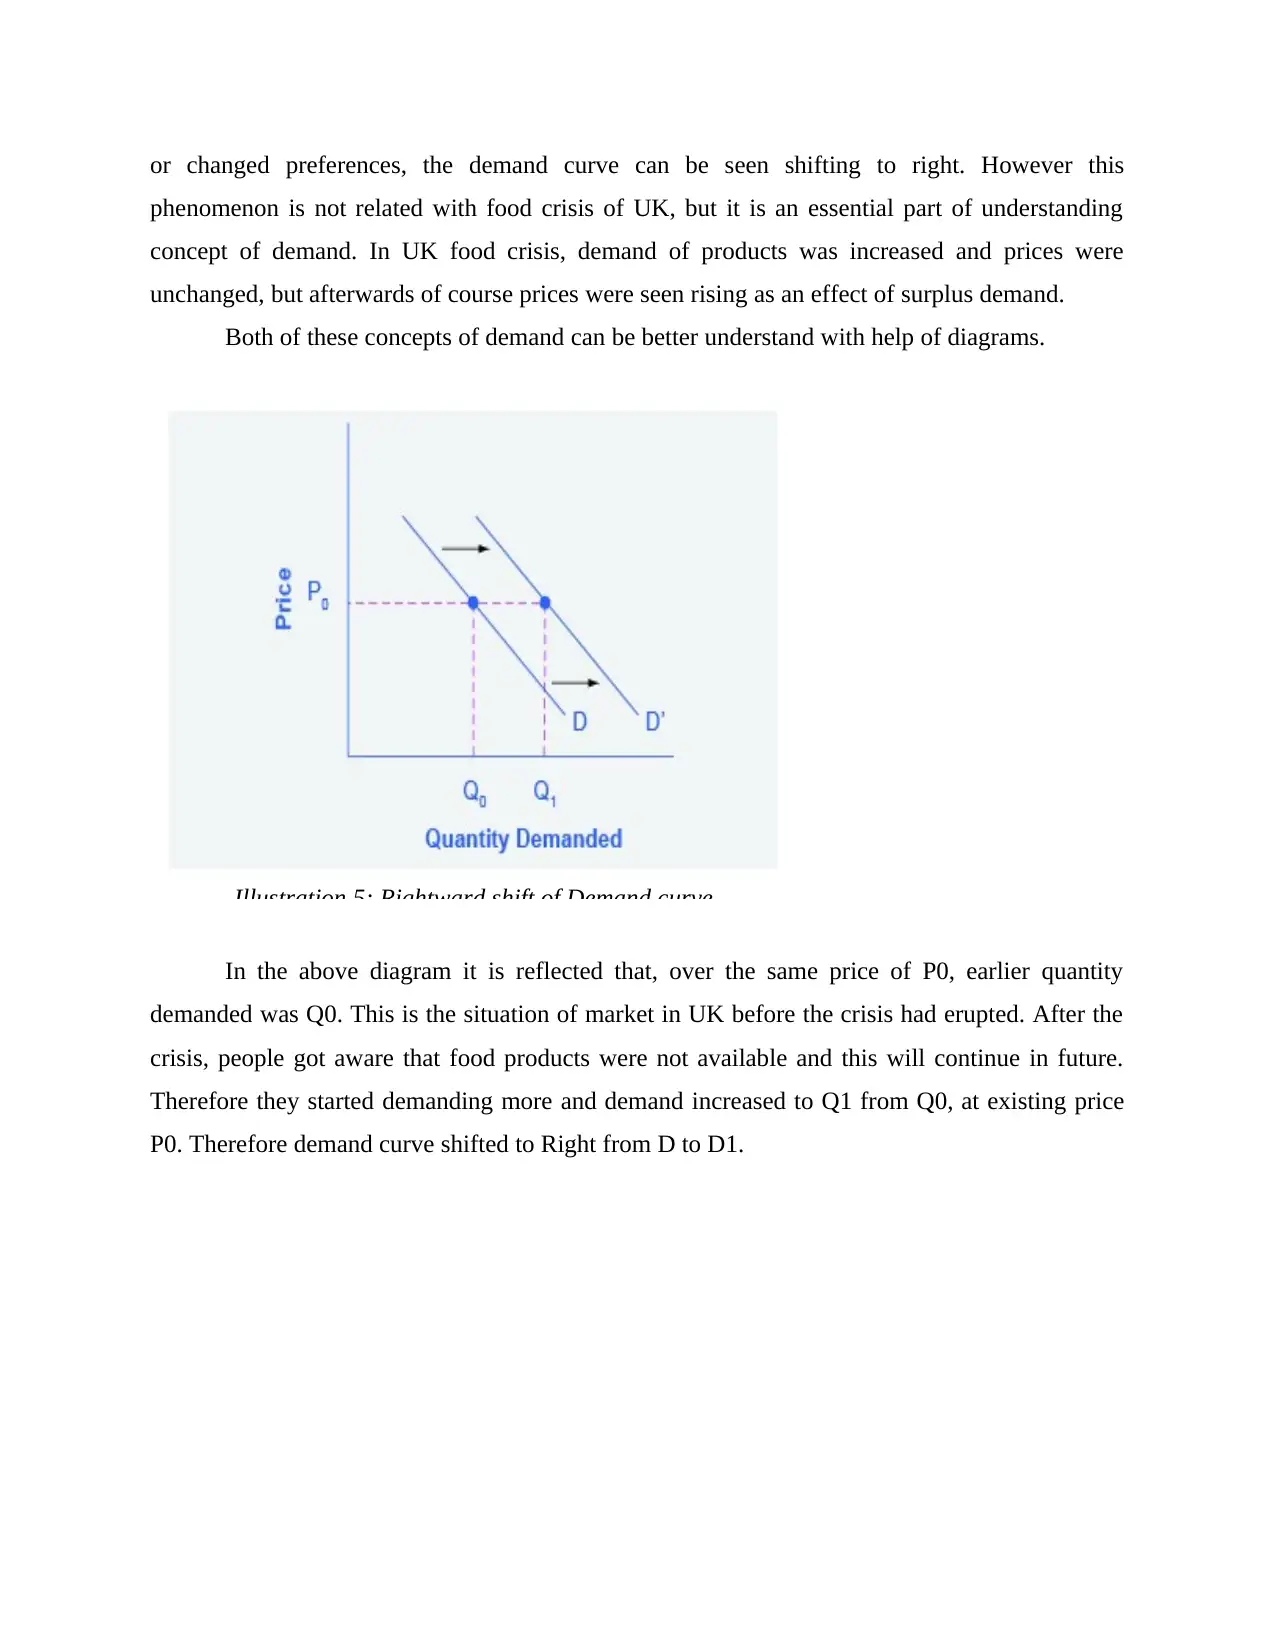
or changed preferences, the demand curve can be seen shifting to right. However this
phenomenon is not related with food crisis of UK, but it is an essential part of understanding
concept of demand. In UK food crisis, demand of products was increased and prices were
unchanged, but afterwards of course prices were seen rising as an effect of surplus demand.
Both of these concepts of demand can be better understand with help of diagrams.
In the above diagram it is reflected that, over the same price of P0, earlier quantity
demanded was Q0. This is the situation of market in UK before the crisis had erupted. After the
crisis, people got aware that food products were not available and this will continue in future.
Therefore they started demanding more and demand increased to Q1 from Q0, at existing price
P0. Therefore demand curve shifted to Right from D to D1.
Illustration 5: Rightward shift of Demand curve
Paraphrase This Document
Need a fresh take? Get an instant paraphrase of this document with our AI Paraphraser
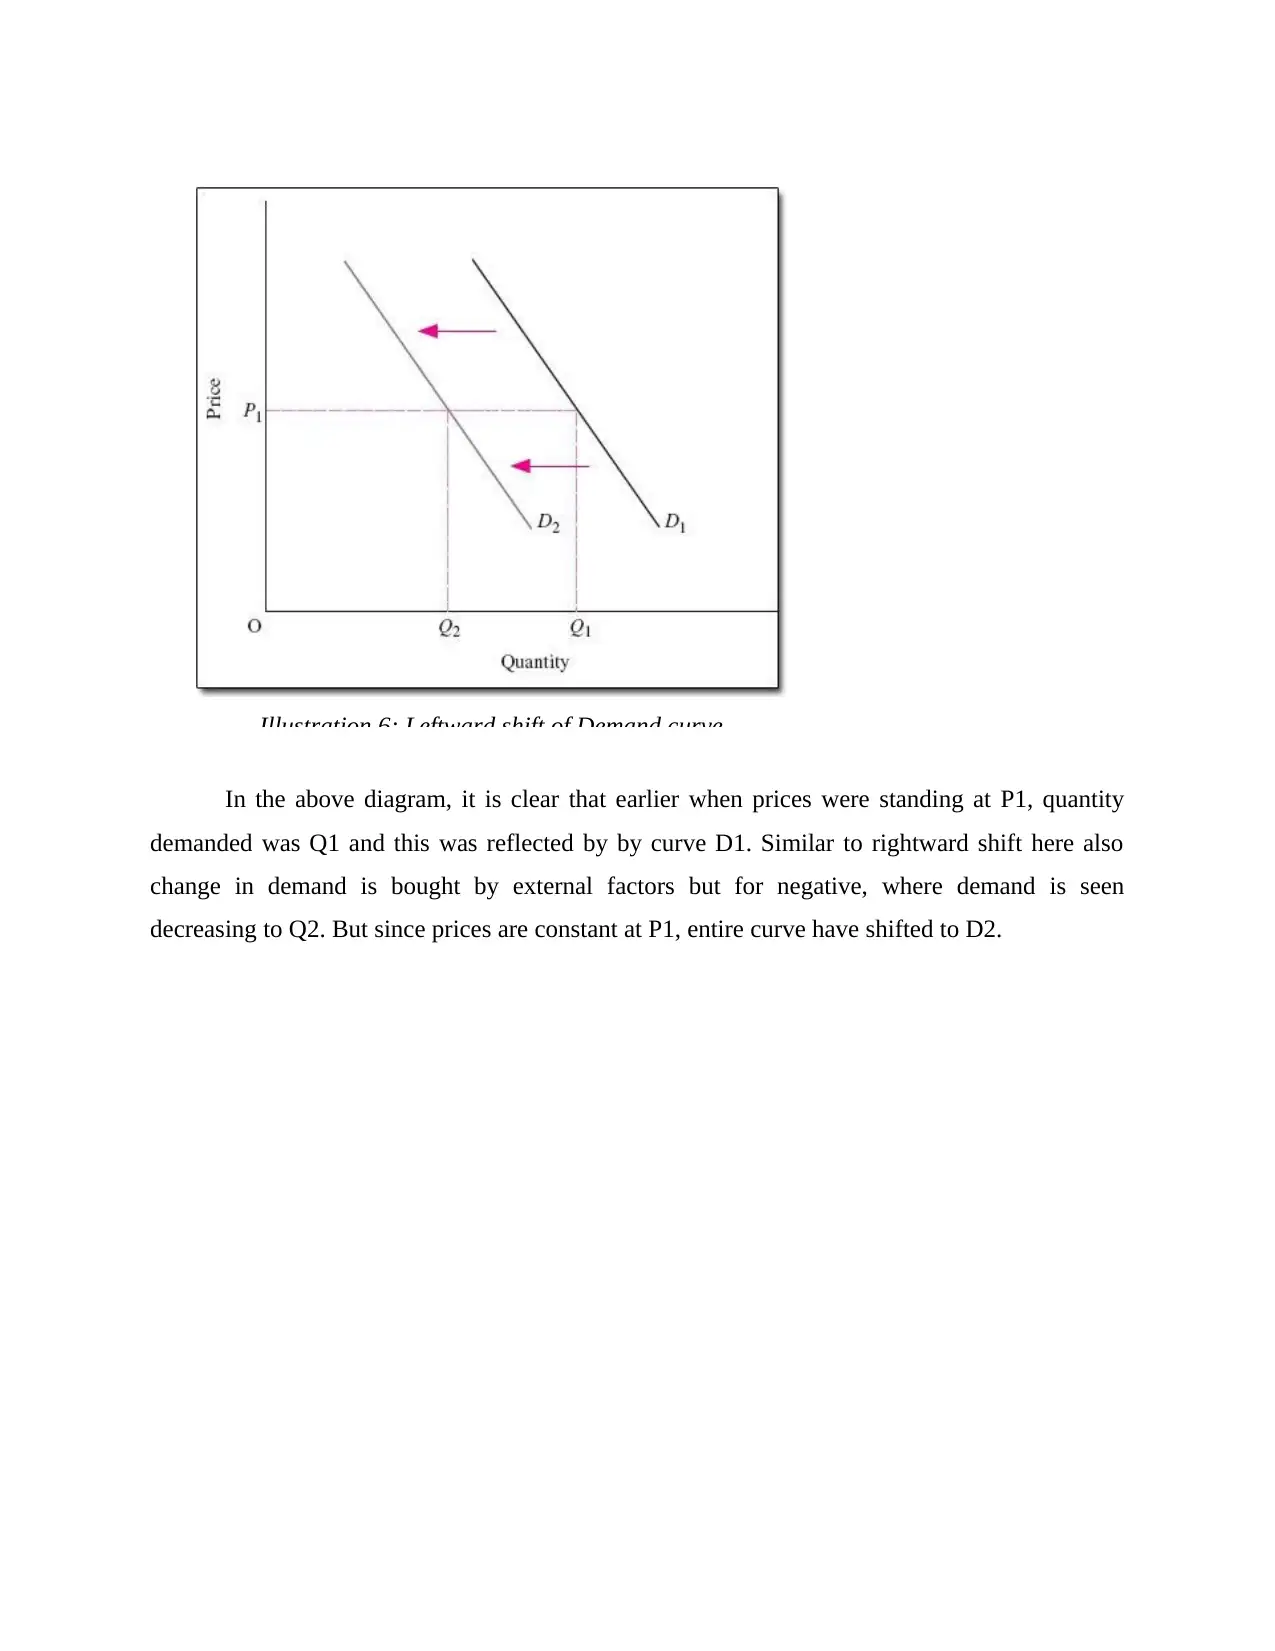
In the above diagram, it is clear that earlier when prices were standing at P1, quantity
demanded was Q1 and this was reflected by by curve D1. Similar to rightward shift here also
change in demand is bought by external factors but for negative, where demand is seen
decreasing to Q2. But since prices are constant at P1, entire curve have shifted to D2.
Illustration 6: Leftward shift of Demand curve
Understanding Equilibrium
Equilibrium is the state of market where factors and market forces are completely seen
stable. According to Krugman and Wells, equilibrium can be regarded as perfect situation. Under
Equilibrium quantity supplied by suppliers are sufficient in meeting quantity demanded. At this
point, the quantity which is demanded and that is equally supplied as well is called Equilibrium
quantity and the price on which this status is established is called Equilibrium Price. Krugman
and Wells noted that, situation of Equilibrium is established when market forces are left free and
there is no intervention from external factors (Tacoli, 2020). Equilibrium is win-win situations
for buyers and suppliers. At the time of UK food crisis, external factors were active and
Equilibrium was disturbed.
Understanding Shortages and Surplus
Shortage-This term indicates excess demand in market. When quantity demanded exceed than
what is supplied by suppliers, shortages arises. At this case prices are seen rising. This was
exactly the case in UK food crisis.
Surplus- This term indicates excess supply in market. This means when demand of products are
insufficient to meet supply. Here, suppliers are seen incurring huge losses, as prices of products
decrease.
Krugman and Wells noted that, Shortages and Surplus, both situations are disturbance to
Equilibrium.
⊘ This is a preview!⊘
Do you want full access?
Subscribe today to unlock all pages.
Trusted by 1+ million students worldwide
1 out of 16
Related Documents


Your All-in-One AI-Powered Toolkit for Academic Success.
+13062052269
info@desklib.com
Available 24*7 on WhatsApp / Email
![[object Object]](/_next/static/media/star-bottom.7253800d.svg)
Unlock your academic potential
Copyright © 2020–2026 A2Z Services. All Rights Reserved. Developed and managed by ZUCOL.