The UK Food Market: Demand, Supply, Equilibrium, and Policy Effects
VerifiedAdded on 2022/12/27
|17
|3768
|24
Report
AI Summary
This report provides an executive summary and analysis of the UK food market, focusing on the fundamental economic principles of demand and supply. It examines the laws of demand and supply, illustrating movements and shifts in the respective curves for food products. The report explores the concept of equilibrium, including the determination of equilibrium price and quantity, and the implications of shortages and surpluses. Furthermore, it analyzes the impact of UK government economic policies, particularly during the COVID-19 pandemic, on the food supply chain and the ability to meet market requirements. The report covers the availability of resources and fiscal policies and their impact on the food market. The report concludes by discussing the effects of the pandemic and government policies on the food supply chain.
ECONOMICS FOR
BUSINESS
BUSINESS
Paraphrase This Document
Need a fresh take? Get an instant paraphrase of this document with our AI Paraphraser
EXECUTIVE SUMMARY
This report shows the law of demand and law of supply of food in UK market. Movement
along with supply curve and demand curve of the food supply. Shift in supply curve and demand
by rightwards and leftward supply and demand of food. Equilibrium level with change in price
and quantity and also concept of shortage and surplus in supply and demand. Lastly, UK
government economic policies that affect the during Covid-19 and unable to meet the
requirements.
Table of Contents
EXECUTIVE SUMMARY.............................................................................................................2
INTRODUCTION...........................................................................................................................4
MAIN BODY...................................................................................................................................4
Task1................................................................................................................................................4
Law of demand and law of Supply..............................................................................................4
Movement in supply curve...........................................................................................................4
Shift in supply curve....................................................................................................................5
Movement in demand in food......................................................................................................7
Shift in demand of food...............................................................................................................8
Equilibrium price and quantity..................................................................................................10
Task 2.............................................................................................................................................12
CONCLUSION..............................................................................................................................14
REFERENCES................................................................................................................................1
⊘ This is a preview!⊘
Do you want full access?
Subscribe today to unlock all pages.
Trusted by 1+ million students worldwide
INTRODUCTION
Demand and supply is the fundamental concept of economics. Demand refer to
interaction between the seller of goods and buyer for that goods. It defines the relationship
between the price of the product and willingness of people to buy that product. Supply refers to
selling of goods by the seller at a time of higher price in market where demand is low and
consumers are willing to purchase less. The demand and supply of UK supply chain is very
dynamic due to their unstable in economic balance (Clapp, and Moseley, 2020).
The demand of supply of UK food chain and how they affected with the prices and other
factors that shift or move demand and supply curve. Equilibrium point of price and quantity and
how equilibrium shift demand and supply curve of the same. Whereas, economic principles are
also stated and their intervention in demand and supply of food related goods with examples are
explained.
MAIN BODY
Task1
Law of demand and law of Supply
Law of supply states that all other factor remains constant, higher the price of goods leads
to higher supply in the market. It means increase in price leads to increase in supply of food in
market by the supplier. To earn more of profit, supplier increased their supplies in market at a
time of high price. But It results in decrease in demand of goods in market. Whereas, at this point
supply of food chain is very high in market.
Law of demand state that, all other factor remains constant, higher the price of good
leads to decrease in demand of that good. It means higher the price of product lower the quantity
demanded. It shows the direct relations between the demand of product and its price of product.
Demand of product will change if price of product changed. The UK food supply has been very
dynamic and changed very frequently. Consumers decrease their demand for foods products that
can not necessary and can be consumed later (Kim, Kim, and Park, 2020). Only those goods will
be consumed that are necessary like rice and wheat, fruits and vegetables. The fluctuation of
price of food products will directly affect its demand and supply in market.
Movement in supply curve.
There is a positive relation between price and supply of goods by the supplier. The
upward movement shows the increase in price result in increase in supply of goods in market. It
Paraphrase This Document
Need a fresh take? Get an instant paraphrase of this document with our AI Paraphraser
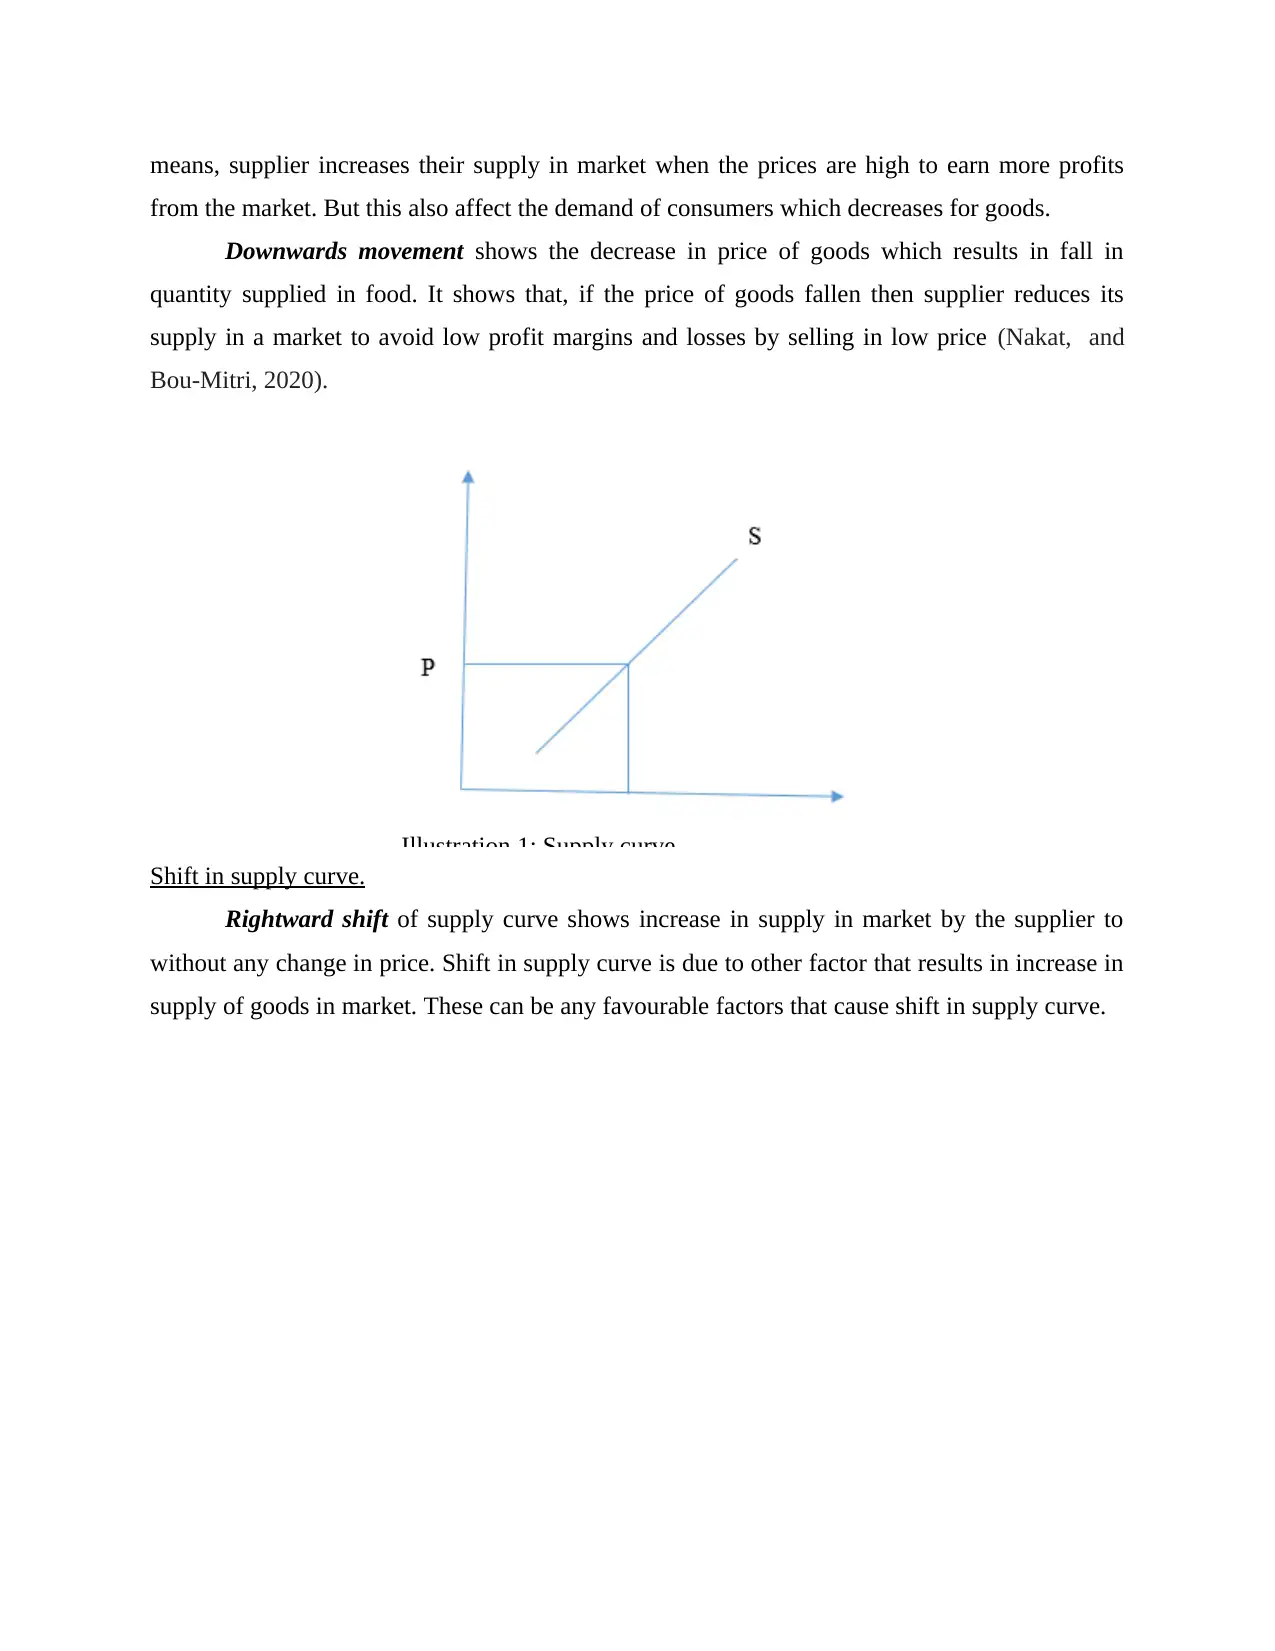
means, supplier increases their supply in market when the prices are high to earn more profits
from the market. But this also affect the demand of consumers which decreases for goods.
Downwards movement shows the decrease in price of goods which results in fall in
quantity supplied in food. It shows that, if the price of goods fallen then supplier reduces its
supply in a market to avoid low profit margins and losses by selling in low price (Nakat, and
Bou-Mitri, 2020).
Illustration 1: Supply curve
Shift in supply curve.
Rightward shift of supply curve shows increase in supply in market by the supplier to
without any change in price. Shift in supply curve is due to other factor that results in increase in
supply of goods in market. These can be any favourable factors that cause shift in supply curve.
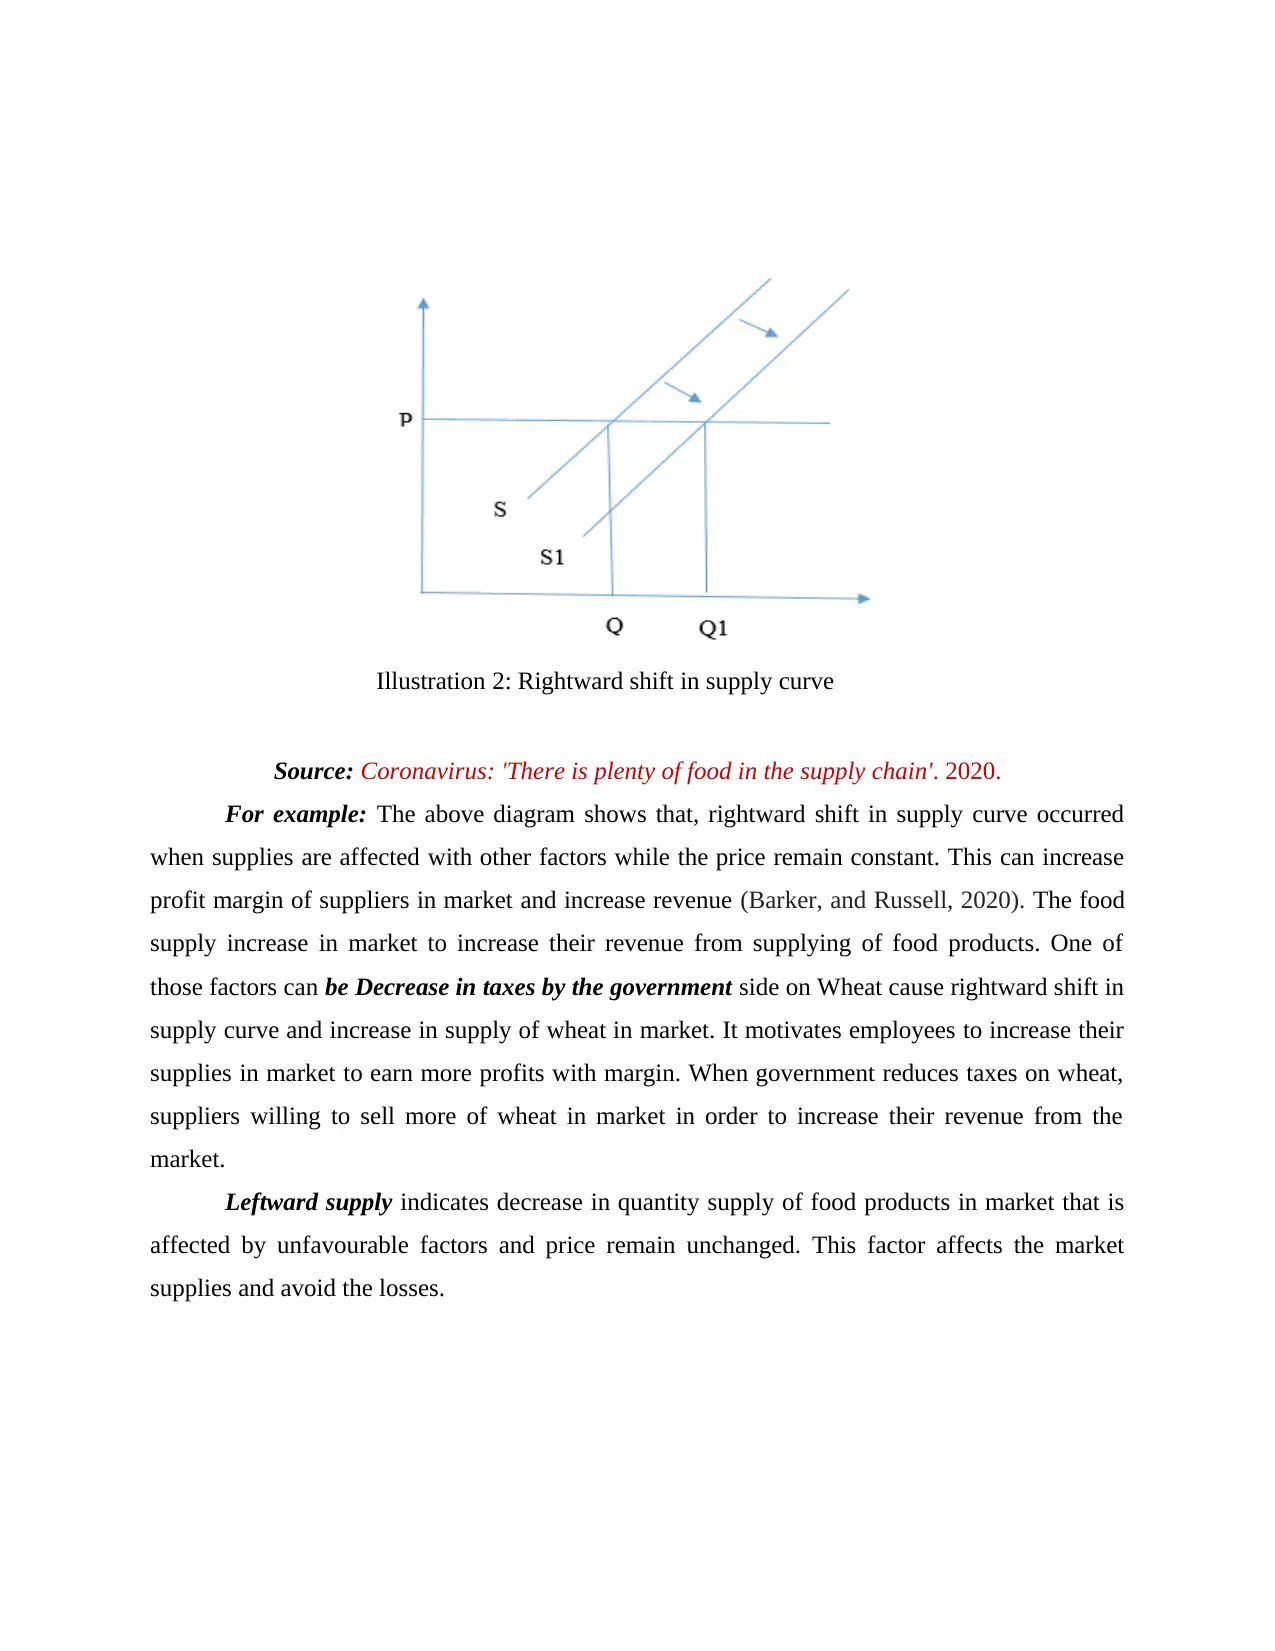
Illustration 2: Rightward shift in supply curve
Source: Coronavirus: 'There is plenty of food in the supply chain'. 2020.
For example: The above diagram shows that, rightward shift in supply curve occurred
when supplies are affected with other factors while the price remain constant. This can increase
profit margin of suppliers in market and increase revenue (Barker, and Russell, 2020). The food
supply increase in market to increase their revenue from supplying of food products. One of
those factors can be Decrease in taxes by the government side on Wheat cause rightward shift in
supply curve and increase in supply of wheat in market. It motivates employees to increase their
supplies in market to earn more profits with margin. When government reduces taxes on wheat,
suppliers willing to sell more of wheat in market in order to increase their revenue from the
market.
Leftward supply indicates decrease in quantity supply of food products in market that is
affected by unfavourable factors and price remain unchanged. This factor affects the market
supplies and avoid the losses.
⊘ This is a preview!⊘
Do you want full access?
Subscribe today to unlock all pages.
Trusted by 1+ million students worldwide
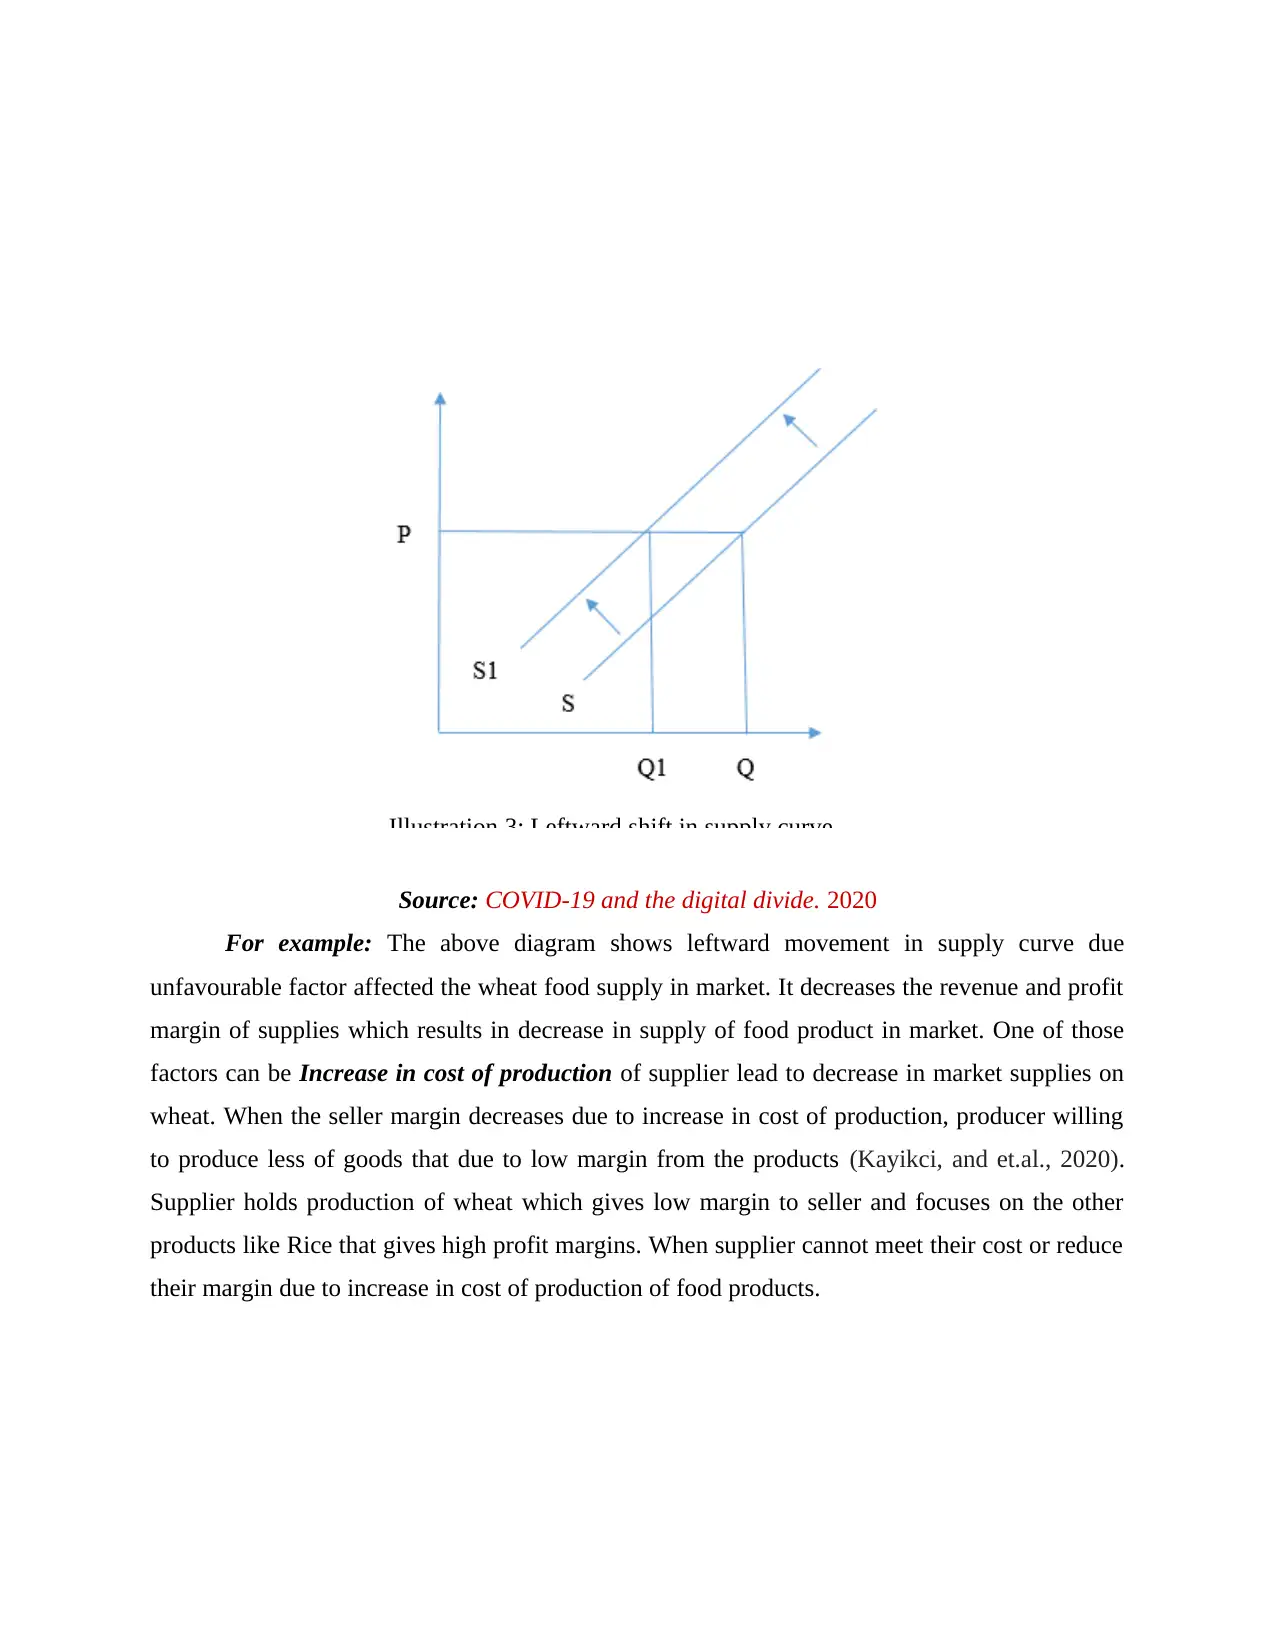
Illustration 3: Leftward shift in supply curve
Source: COVID-19 and the digital divide. 2020
For example: The above diagram shows leftward movement in supply curve due
unfavourable factor affected the wheat food supply in market. It decreases the revenue and profit
margin of supplies which results in decrease in supply of food product in market. One of those
factors can be Increase in cost of production of supplier lead to decrease in market supplies on
wheat. When the seller margin decreases due to increase in cost of production, producer willing
to produce less of goods that due to low margin from the products (Kayikci, and et.al., 2020).
Supplier holds production of wheat which gives low margin to seller and focuses on the other
products like Rice that gives high profit margins. When supplier cannot meet their cost or reduce
their margin due to increase in cost of production of food products.
Paraphrase This Document
Need a fresh take? Get an instant paraphrase of this document with our AI Paraphraser
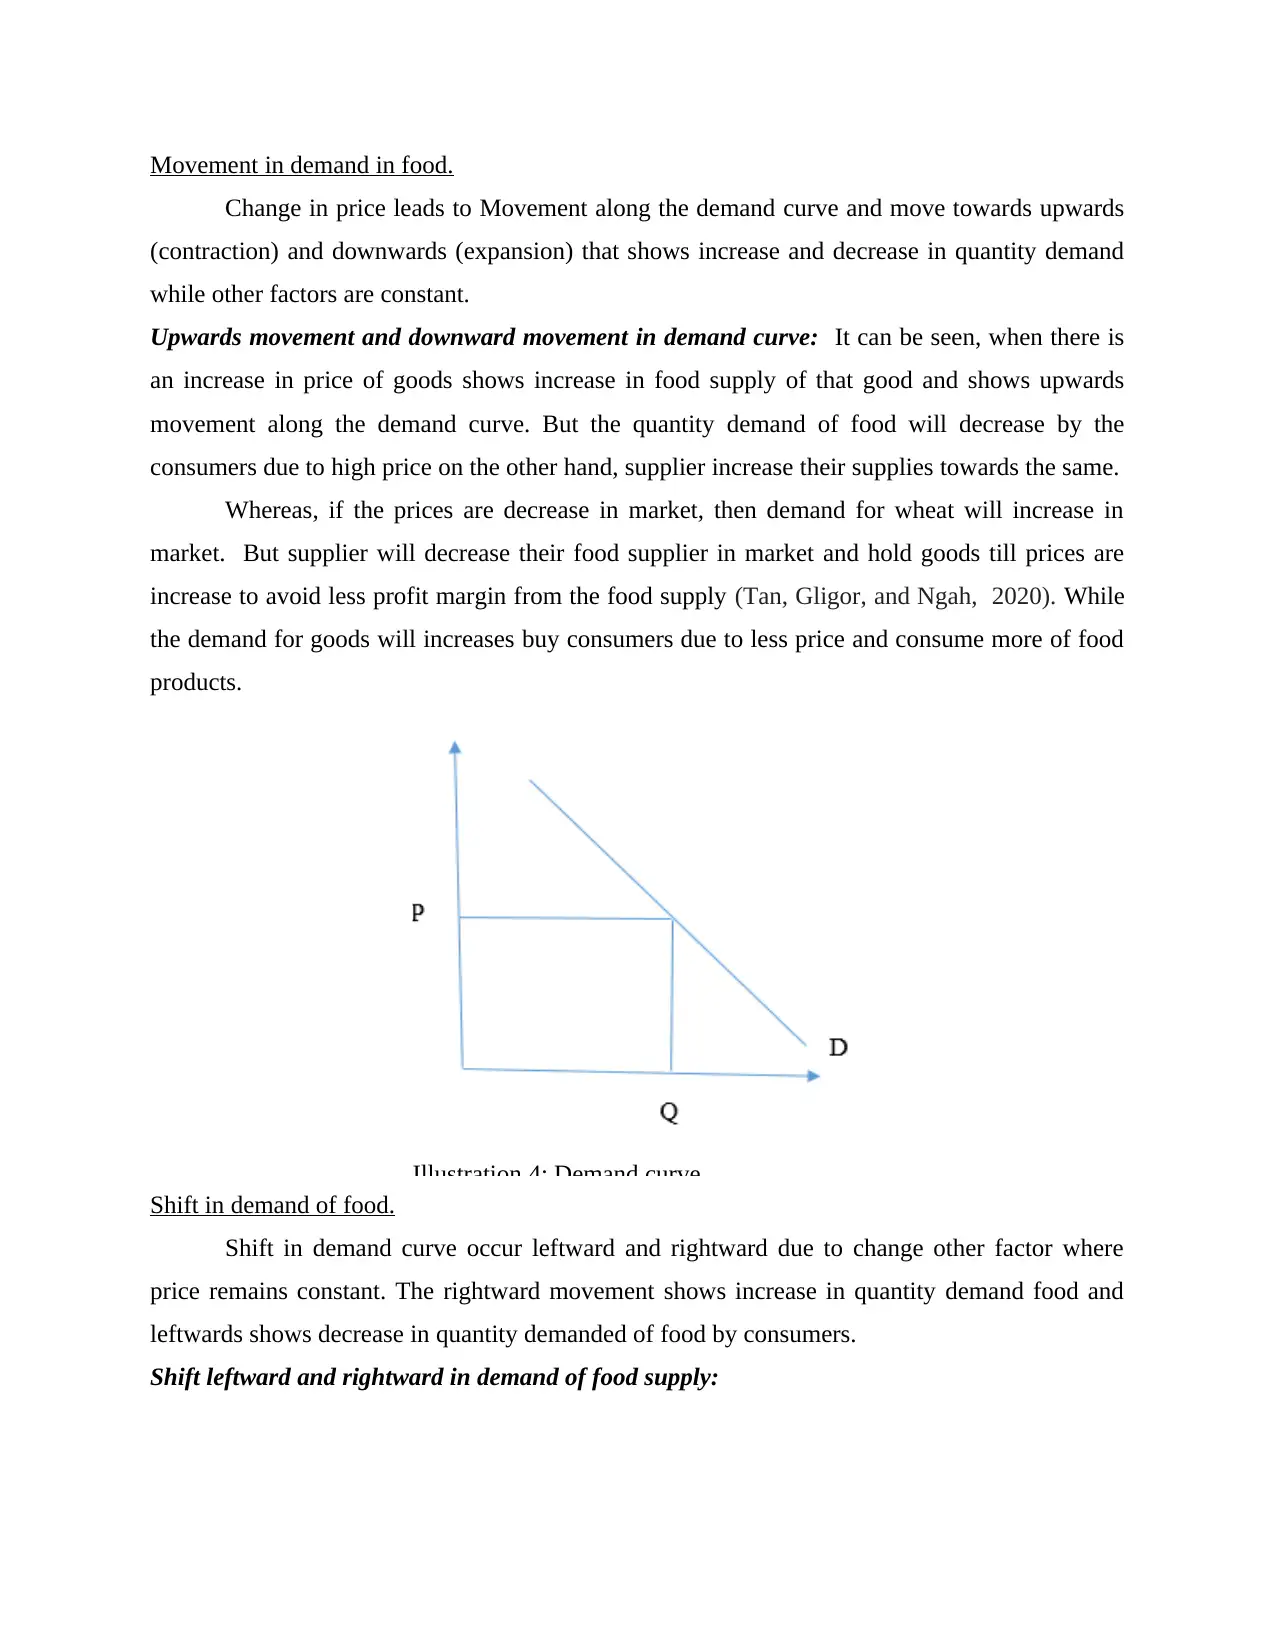
Movement in demand in food.
Change in price leads to Movement along the demand curve and move towards upwards
(contraction) and downwards (expansion) that shows increase and decrease in quantity demand
while other factors are constant.
Upwards movement and downward movement in demand curve: It can be seen, when there is
an increase in price of goods shows increase in food supply of that good and shows upwards
movement along the demand curve. But the quantity demand of food will decrease by the
consumers due to high price on the other hand, supplier increase their supplies towards the same.
Whereas, if the prices are decrease in market, then demand for wheat will increase in
market. But supplier will decrease their food supplier in market and hold goods till prices are
increase to avoid less profit margin from the food supply (Tan, Gligor, and Ngah, 2020). While
the demand for goods will increases buy consumers due to less price and consume more of food
products.
Illustration 4: Demand curve
Shift in demand of food.
Shift in demand curve occur leftward and rightward due to change other factor where
price remains constant. The rightward movement shows increase in quantity demand food and
leftwards shows decrease in quantity demanded of food by consumers.
Shift leftward and rightward in demand of food supply:
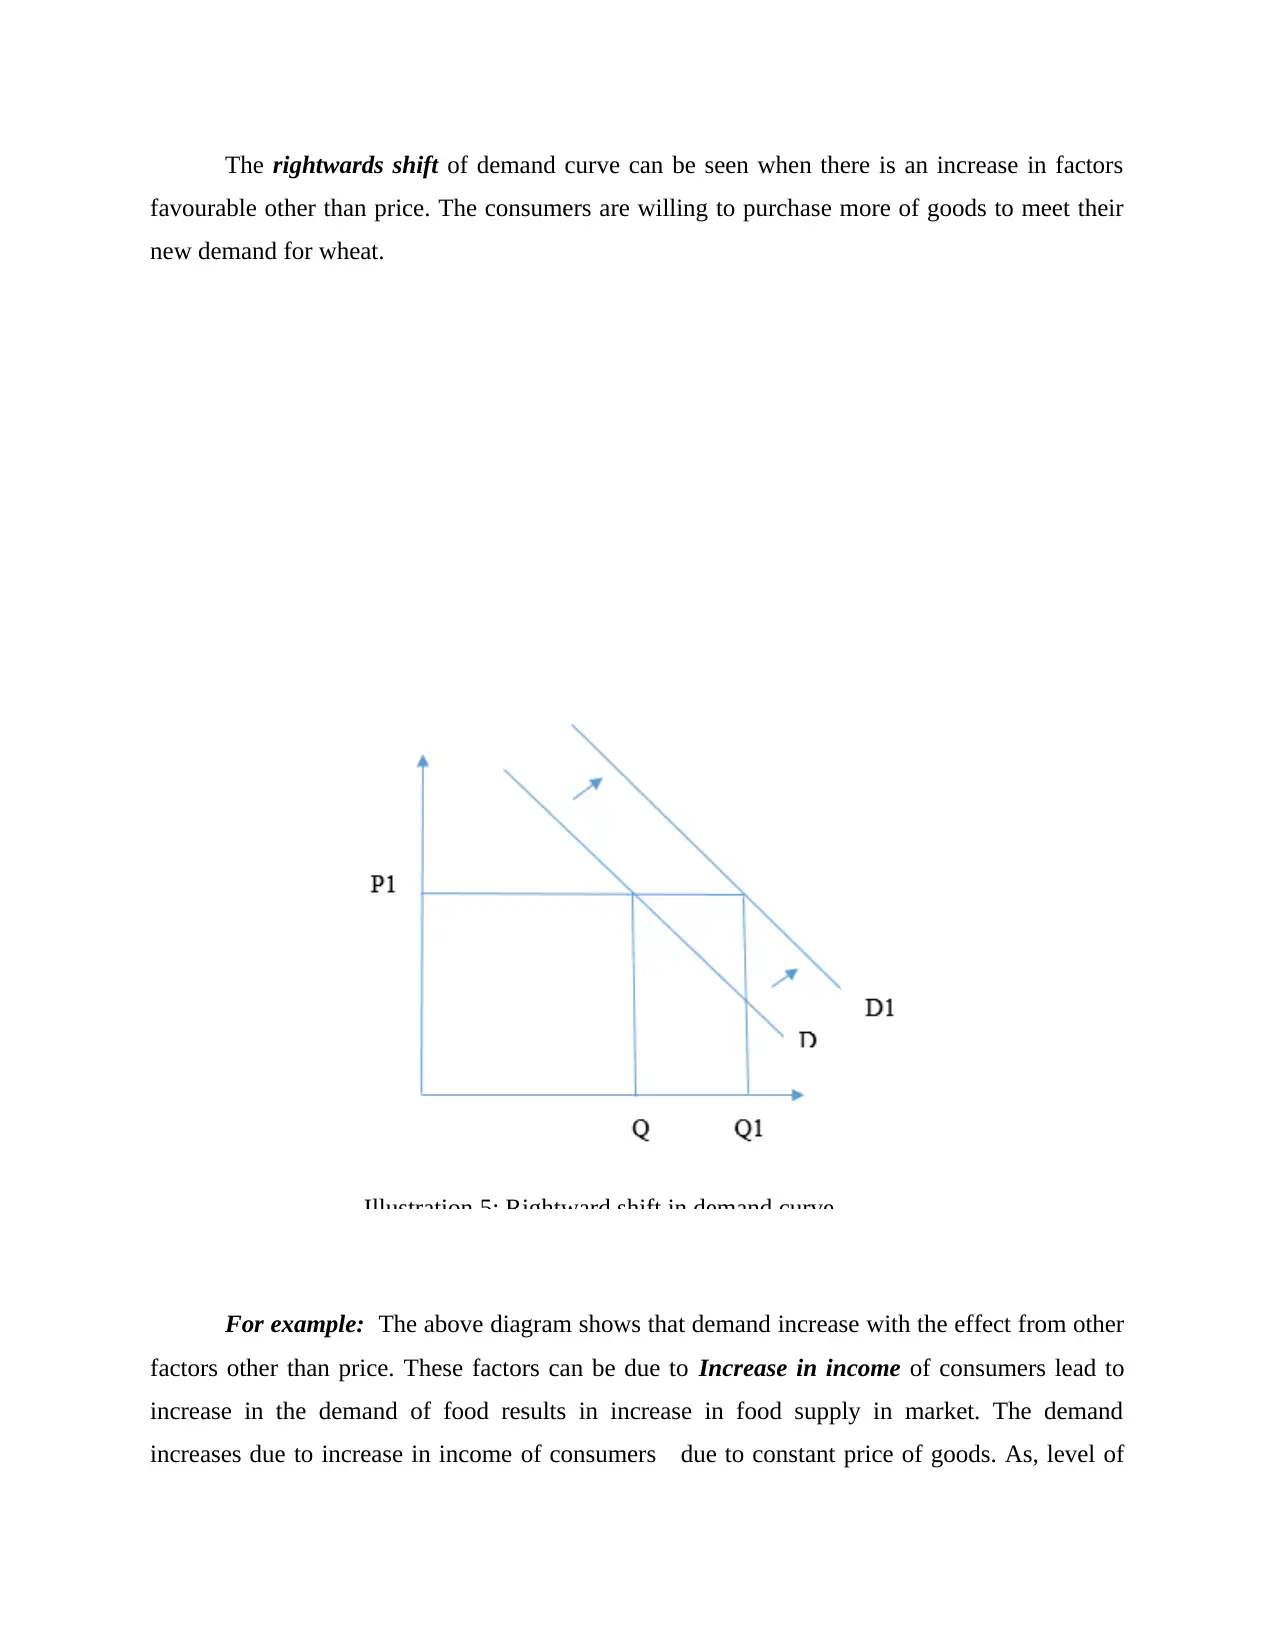
The rightwards shift of demand curve can be seen when there is an increase in factors
favourable other than price. The consumers are willing to purchase more of goods to meet their
new demand for wheat.
Illustration 5: Rightward shift in demand curve
For example: The above diagram shows that demand increase with the effect from other
factors other than price. These factors can be due to Increase in income of consumers lead to
increase in the demand of food results in increase in food supply in market. The demand
increases due to increase in income of consumers due to constant price of goods. As, level of
⊘ This is a preview!⊘
Do you want full access?
Subscribe today to unlock all pages.
Trusted by 1+ million students worldwide
income increases in the market demand of wheat rises and food supplier increases supply
accordingly to meet up with consumer demand. As, the price of goods remain constant,
consumer can purchase more goods with the increased income (de Gorter, and et.al., 2020)
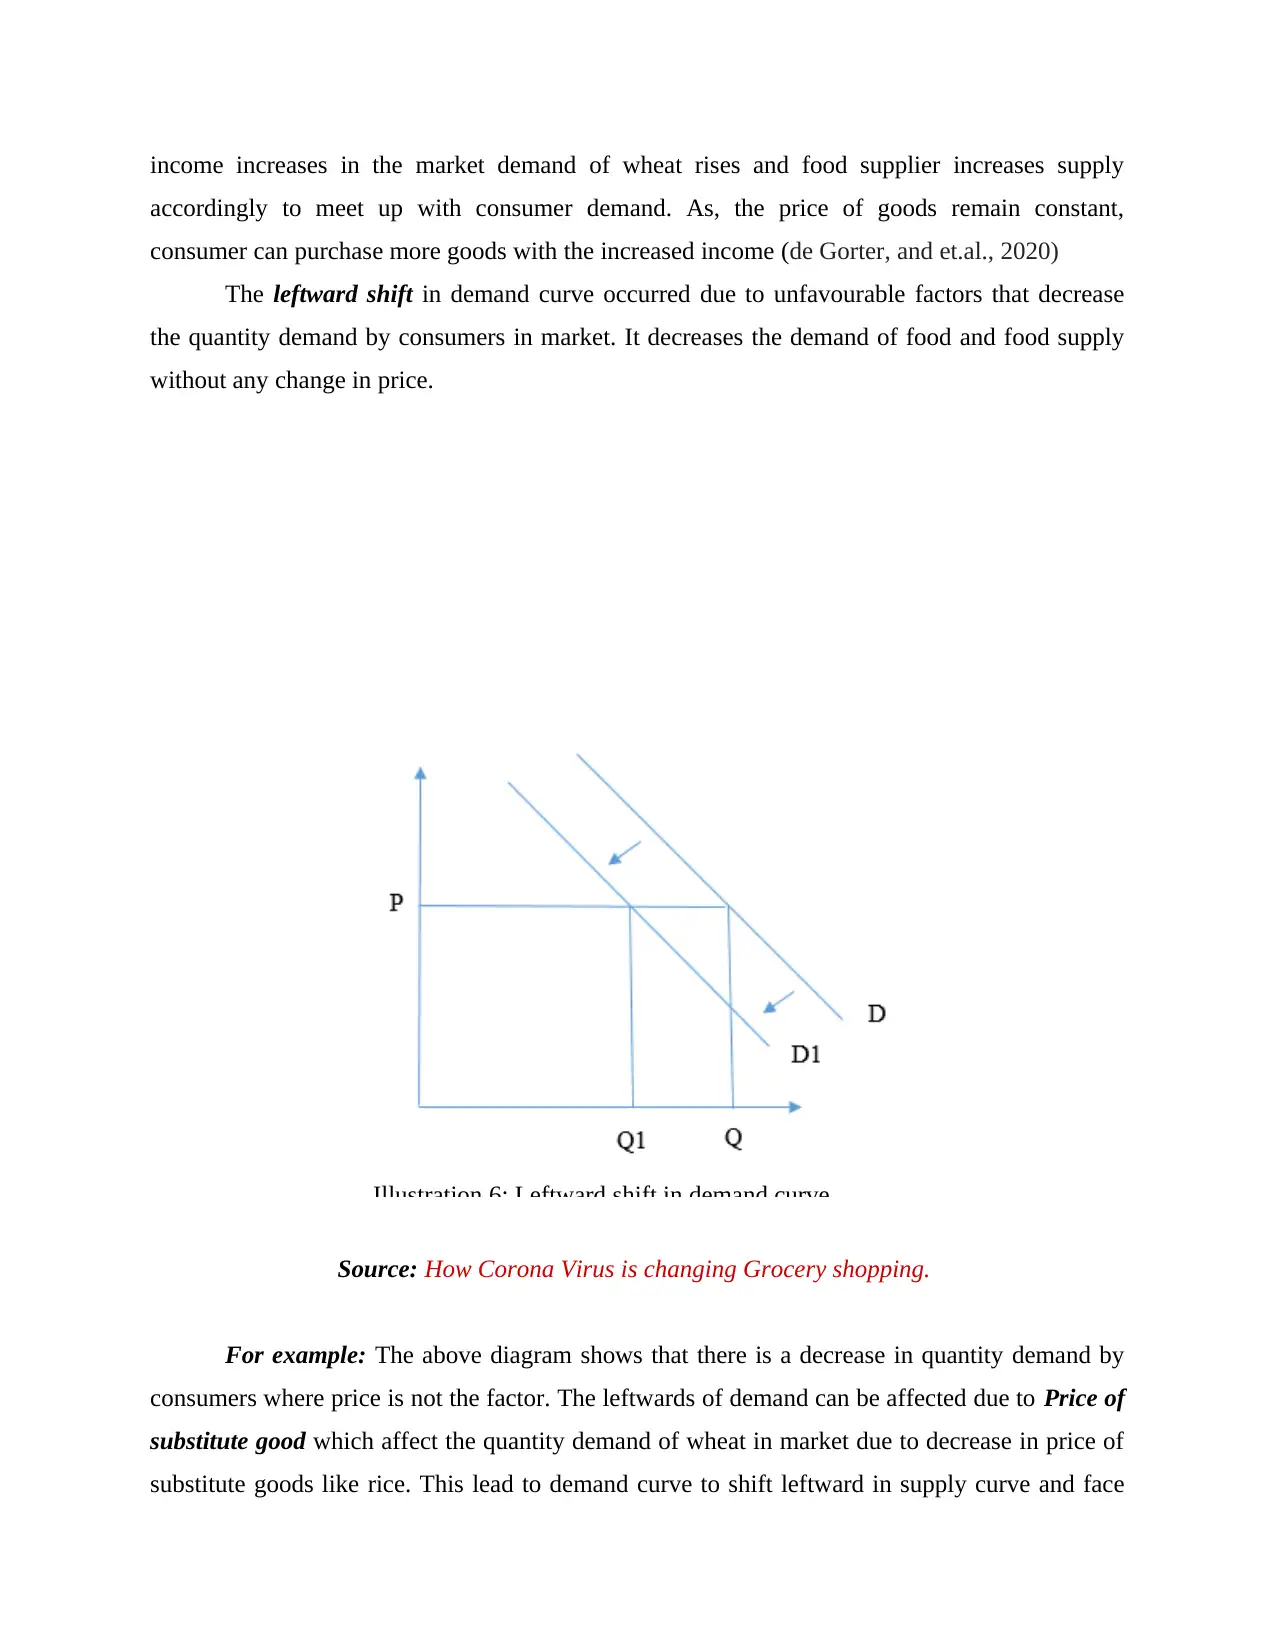
The leftward shift in demand curve occurred due to unfavourable factors that decrease
the quantity demand by consumers in market. It decreases the demand of food and food supply
without any change in price.
Illustration 6: Leftward shift in demand curve
Source: How Corona Virus is changing Grocery shopping.
For example: The above diagram shows that there is a decrease in quantity demand by
consumers where price is not the factor. The leftwards of demand can be affected due to Price of
substitute good which affect the quantity demand of wheat in market due to decrease in price of
substitute goods like rice. This lead to demand curve to shift leftward in supply curve and face
accordingly to meet up with consumer demand. As, the price of goods remain constant,
consumer can purchase more goods with the increased income (de Gorter, and et.al., 2020)
The leftward shift in demand curve occurred due to unfavourable factors that decrease
the quantity demand by consumers in market. It decreases the demand of food and food supply
without any change in price.
Illustration 6: Leftward shift in demand curve
Source: How Corona Virus is changing Grocery shopping.
For example: The above diagram shows that there is a decrease in quantity demand by
consumers where price is not the factor. The leftwards of demand can be affected due to Price of
substitute good which affect the quantity demand of wheat in market due to decrease in price of
substitute goods like rice. This lead to demand curve to shift leftward in supply curve and face
Paraphrase This Document
Need a fresh take? Get an instant paraphrase of this document with our AI Paraphraser
losses from the same. The consumers willing to purchase more of substitute good I.e. rice due to
low price and shift over substitute goods that cause leftward demand curve of food.
Equilibrium price and quantity.
Equilibrium is a state where demand and supply are balanced in market or equilibrium
price is a price where quantity demand is equal to quantity supplied. Whereas, equilibrium
quantity is a point where quantity demand and supplied at a point of equilibrium price (Ben-
Daya, and et.al., 2020).
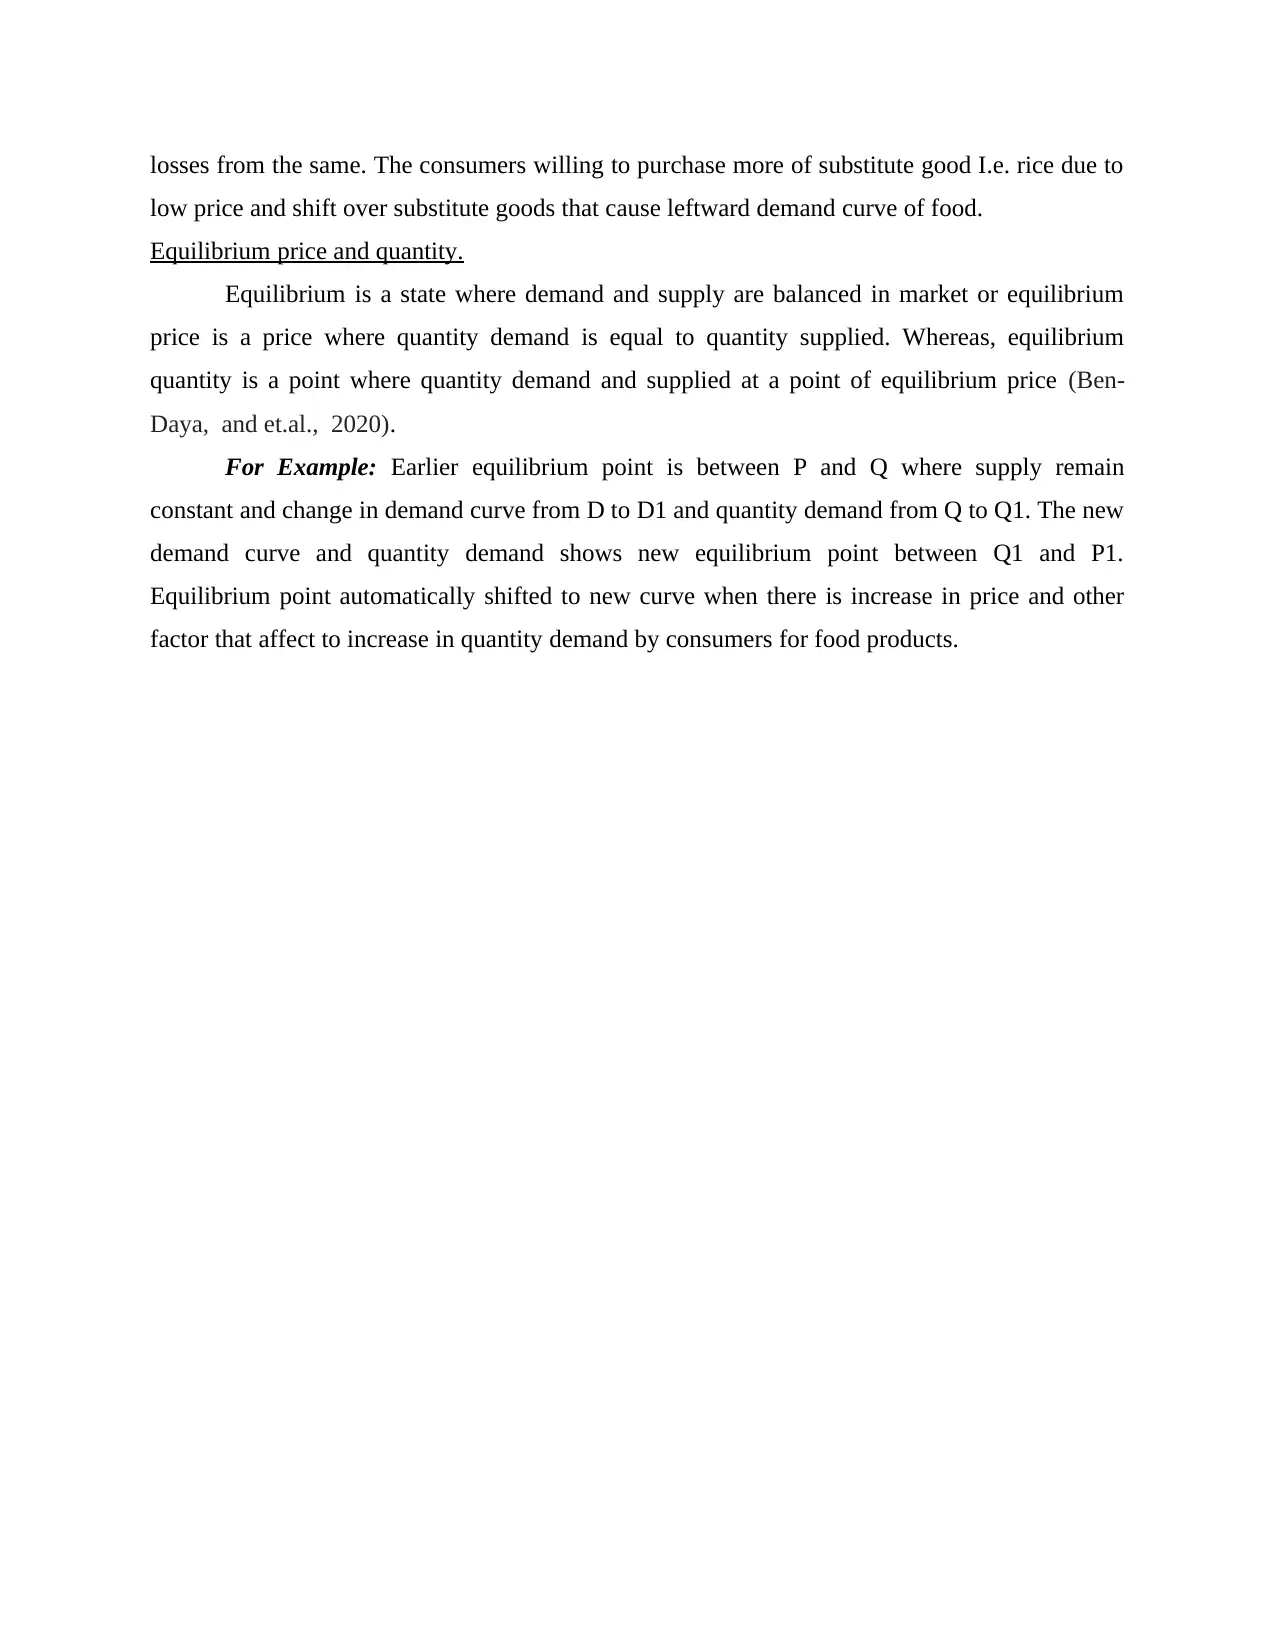
For Example: Earlier equilibrium point is between P and Q where supply remain
constant and change in demand curve from D to D1 and quantity demand from Q to Q1. The new
demand curve and quantity demand shows new equilibrium point between Q1 and P1.
Equilibrium point automatically shifted to new curve when there is increase in price and other
factor that affect to increase in quantity demand by consumers for food products.
low price and shift over substitute goods that cause leftward demand curve of food.
Equilibrium price and quantity.
Equilibrium is a state where demand and supply are balanced in market or equilibrium
price is a price where quantity demand is equal to quantity supplied. Whereas, equilibrium
quantity is a point where quantity demand and supplied at a point of equilibrium price (Ben-
Daya, and et.al., 2020).
For Example: Earlier equilibrium point is between P and Q where supply remain
constant and change in demand curve from D to D1 and quantity demand from Q to Q1. The new
demand curve and quantity demand shows new equilibrium point between Q1 and P1.
Equilibrium point automatically shifted to new curve when there is increase in price and other
factor that affect to increase in quantity demand by consumers for food products.
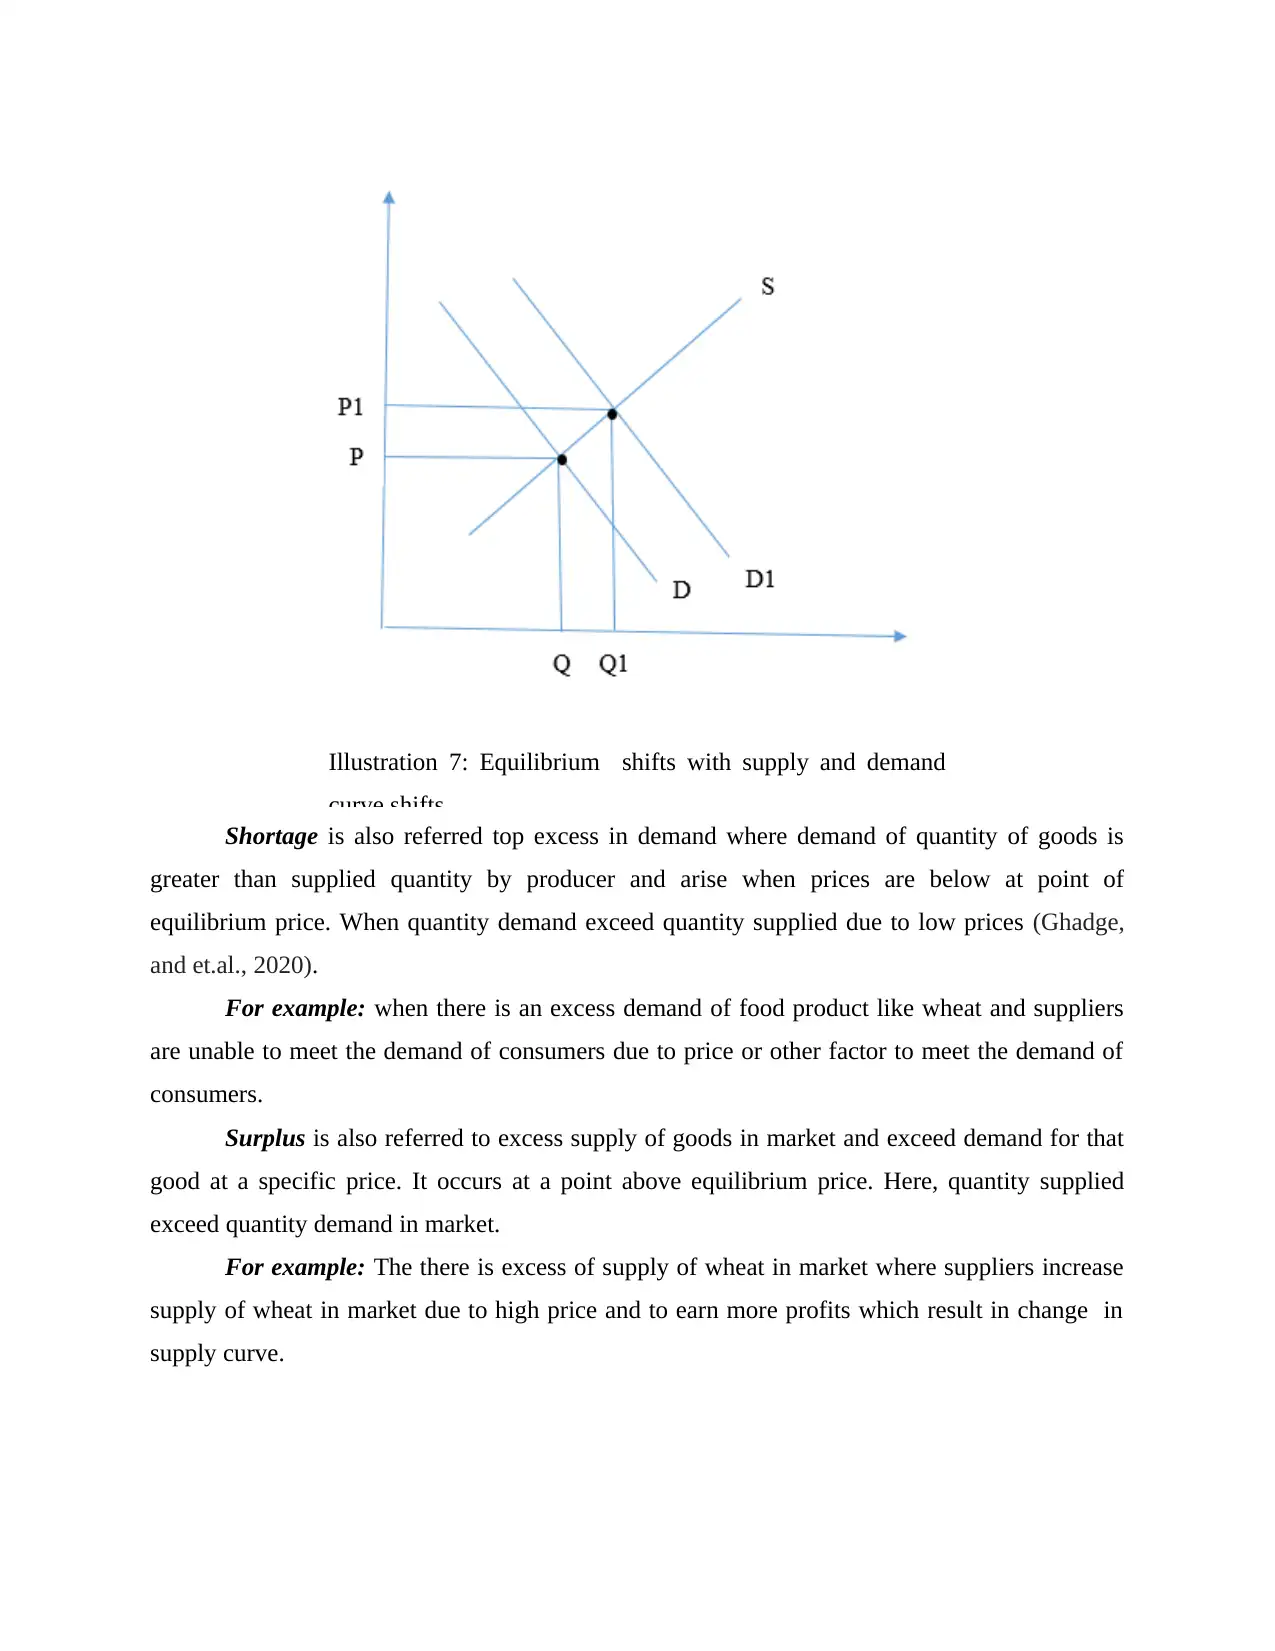
Illustration 7: Equilibrium shifts with supply and demand
curve shifts
Shortage is also referred top excess in demand where demand of quantity of goods is
greater than supplied quantity by producer and arise when prices are below at point of
equilibrium price. When quantity demand exceed quantity supplied due to low prices (Ghadge,
and et.al., 2020).
For example: when there is an excess demand of food product like wheat and suppliers
are unable to meet the demand of consumers due to price or other factor to meet the demand of
consumers.
Surplus is also referred to excess supply of goods in market and exceed demand for that
good at a specific price. It occurs at a point above equilibrium price. Here, quantity supplied
exceed quantity demand in market.
For example: The there is excess of supply of wheat in market where suppliers increase
supply of wheat in market due to high price and to earn more profits which result in change in
supply curve.
⊘ This is a preview!⊘
Do you want full access?
Subscribe today to unlock all pages.
Trusted by 1+ million students worldwide
1 out of 17
Related Documents


Your All-in-One AI-Powered Toolkit for Academic Success.
+13062052269
info@desklib.com
Available 24*7 on WhatsApp / Email
![[object Object]](/_next/static/media/star-bottom.7253800d.svg)
Unlock your academic potential
Copyright © 2020–2026 A2Z Services. All Rights Reserved. Developed and managed by ZUCOL.