An Economic Analysis of the UK Food Supply Chain: Covid Impact
VerifiedAdded on 2021/04/05
|10
|2855
|140
Report
AI Summary
This report provides an economic analysis of the UK food supply chain, particularly focusing on the market failures that occurred during the COVID-19 pandemic. It examines shifts in supply and demand curves, illustrating how factors such as transportation costs and consumer stockpiling affected the equilibrium price and led to food shortages. The report delves into the concept of market failure, explaining how insufficient supply in a free market can arise due to rational consumer behavior and disruptions in the distribution network. Furthermore, it details the governmental interventions undertaken by the Department for Environment, Food, and Rural Affairs (Defra), including measures to aid retailers, support online shopping, and address food waste, to mitigate the economic impact and stabilize the food supply. The analysis underscores the importance of these interventions in bridging the gap between supply and demand and restoring market equilibrium.
Table of Contents
Task 1......................................................................................................................... 3
a) Supply shift towards left:.................................................................................... 3
b) Supply shift towards right:..................................................................................3
c) Supply curve applied to UK food supply:.............................................................4
a) Demand shift towards left:.................................................................................. 4
b) Demand shift towards right:................................................................................ 5
c) UK food demand curve:....................................................................................... 6
Equilibrium price:....................................................................................................... 6
Shortage of food in UK:............................................................................................... 7
Task 2:........................................................................................................................ 7
UK market failure:................................................................................................... 7
Governmental interventions to control market failure:..............................................8
1) Interventions by Defra:....................................................................................... 8
2) Interventions to Aid online shopping:..................................................................8
3) Interventions to protect food waste:...................................................................8
4) Financial Aid to Food redistribution centers:.......................................................9
My perception about UK government intervention to Economic failure:....................9
References:.............................................................................................................. 10
Paraphrase This Document
Need a fresh take? Get an instant paraphrase of this document with our AI Paraphraser
Executive summary:
Economic failure arises in the economy if the aggregate supply did not meet the
aggregate demand for any economy, this report is prepared after a deep study of
food supply in UK. The economic failure in the UK forced UK government to take
interventions in its economy and to bridge the gap between supply curve and
demand curve for UK food distribution. As a result up to greater extend the gap has
been bridged with government interventions.
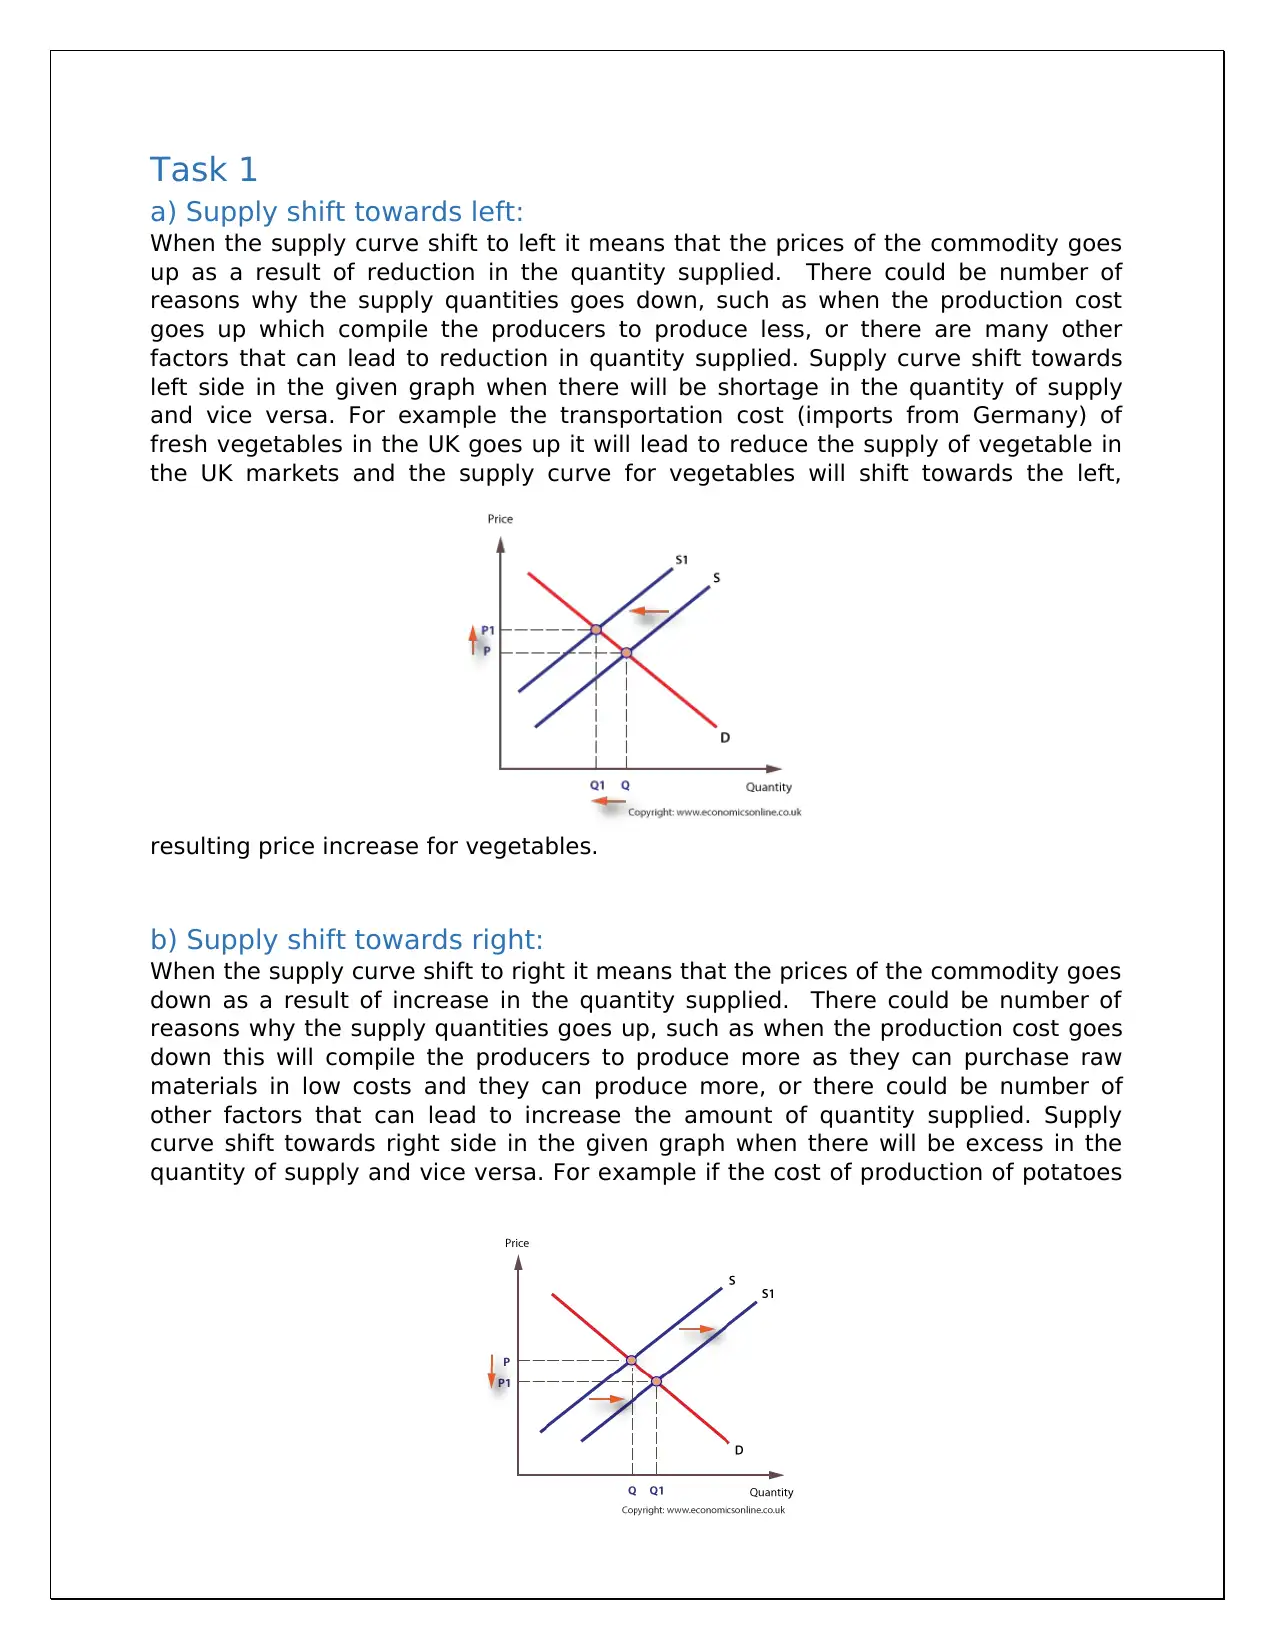
Task 1
a) Supply shift towards left:
When the supply curve shift to left it means that the prices of the commodity goes
up as a result of reduction in the quantity supplied. There could be number of
reasons why the supply quantities goes down, such as when the production cost
goes up which compile the producers to produce less, or there are many other
factors that can lead to reduction in quantity supplied. Supply curve shift towards
left side in the given graph when there will be shortage in the quantity of supply
and vice versa. For example the transportation cost (imports from Germany) of
fresh vegetables in the UK goes up it will lead to reduce the supply of vegetable in
the UK markets and the supply curve for vegetables will shift towards the left,
resulting price increase for vegetables.
b) Supply shift towards right:
When the supply curve shift to right it means that the prices of the commodity goes
down as a result of increase in the quantity supplied. There could be number of
reasons why the supply quantities goes up, such as when the production cost goes
down this will compile the producers to produce more as they can purchase raw
materials in low costs and they can produce more, or there could be number of
other factors that can lead to increase the amount of quantity supplied. Supply
curve shift towards right side in the given graph when there will be excess in the
quantity of supply and vice versa. For example if the cost of production of potatoes
⊘ This is a preview!⊘
Do you want full access?
Subscribe today to unlock all pages.
Trusted by 1+ million students worldwide
in the UK goes down it will lead to the increase in quantity supplied, by reducing the
prices of per Kg tomatoes in the UK markets for consumers.
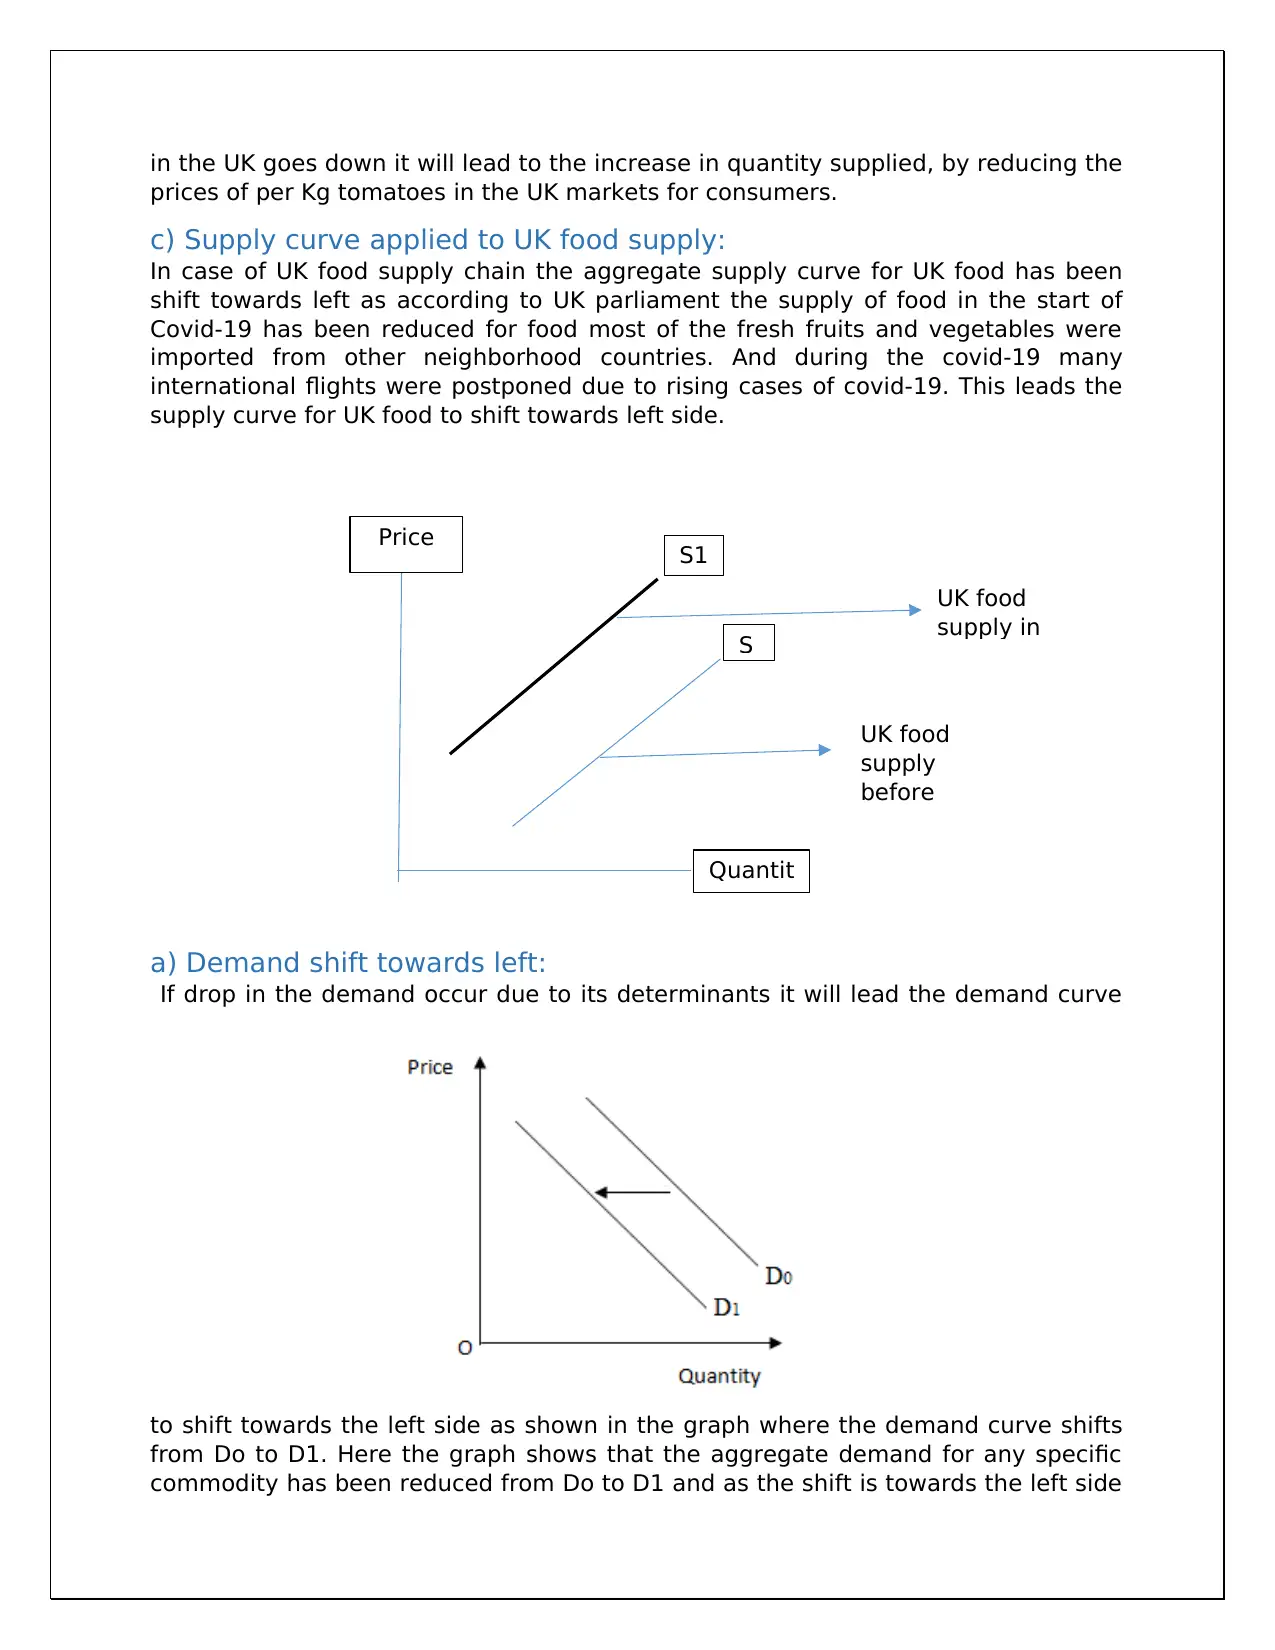
c) Supply curve applied to UK food supply:
In case of UK food supply chain the aggregate supply curve for UK food has been
shift towards left as according to UK parliament the supply of food in the start of
Covid-19 has been reduced for food most of the fresh fruits and vegetables were
imported from other neighborhood countries. And during the covid-19 many
international flights were postponed due to rising cases of covid-19. This leads the
supply curve for UK food to shift towards left side.
a) Demand shift towards left:
If drop in the demand occur due to its determinants it will lead the demand curve
to shift towards the left side as shown in the graph where the demand curve shifts
from Do to D1. Here the graph shows that the aggregate demand for any specific
commodity has been reduced from Do to D1 and as the shift is towards the left side
Price S1
UK food
supply in
S
UK food
supply
before
Quantit
y
prices of per Kg tomatoes in the UK markets for consumers.
c) Supply curve applied to UK food supply:
In case of UK food supply chain the aggregate supply curve for UK food has been
shift towards left as according to UK parliament the supply of food in the start of
Covid-19 has been reduced for food most of the fresh fruits and vegetables were
imported from other neighborhood countries. And during the covid-19 many
international flights were postponed due to rising cases of covid-19. This leads the
supply curve for UK food to shift towards left side.
a) Demand shift towards left:
If drop in the demand occur due to its determinants it will lead the demand curve
to shift towards the left side as shown in the graph where the demand curve shifts
from Do to D1. Here the graph shows that the aggregate demand for any specific
commodity has been reduced from Do to D1 and as the shift is towards the left side
Price S1
UK food
supply in
S
UK food
supply
before
Quantit
y
Paraphrase This Document
Need a fresh take? Get an instant paraphrase of this document with our AI Paraphraser
of the graph it is named as demand shift towards left. The shift in demand towards
left usually happens in the recession period when buyers will buy less as a result of
decline in income of the buyers. The recent covid-19 recession the average wages
rates declined and the demand curve for many products shift towards left side. For
example the demand for luxury products during covid-19 had shift towards left side.
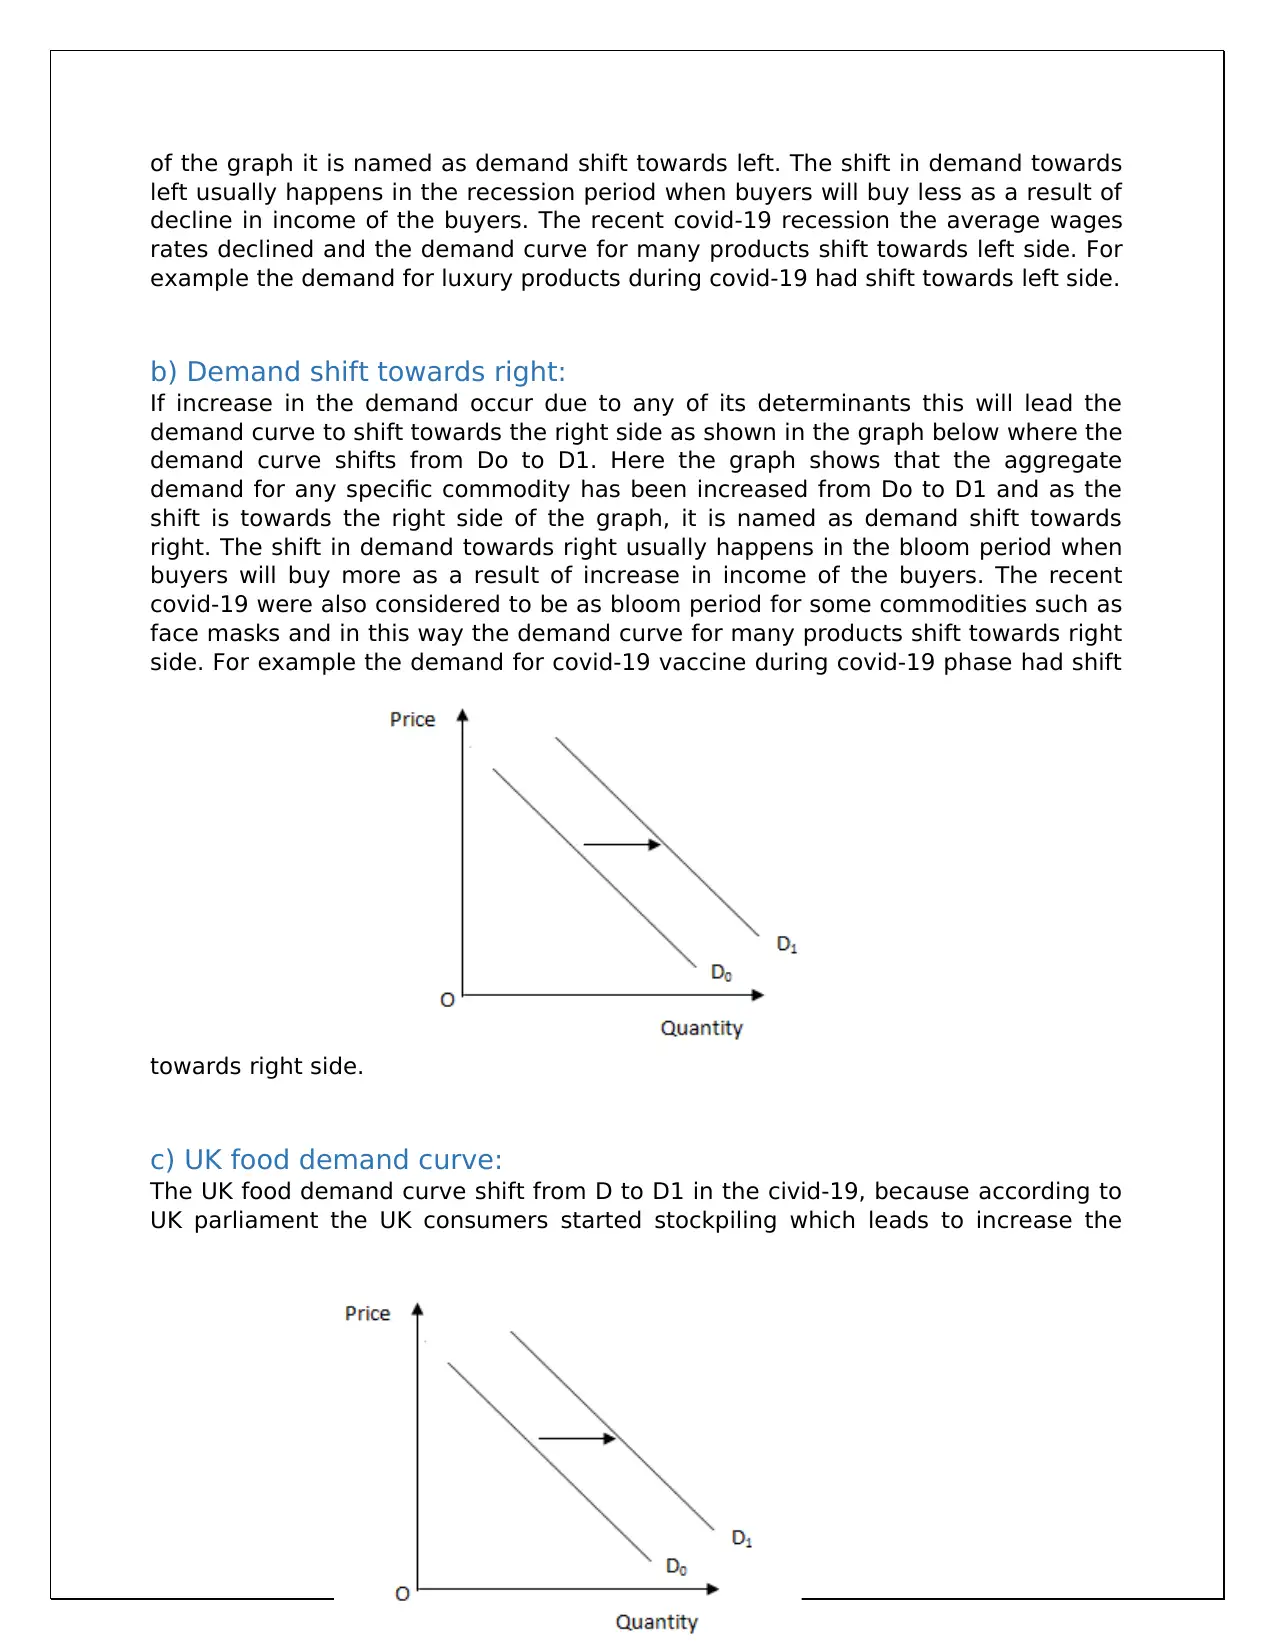
b) Demand shift towards right:
If increase in the demand occur due to any of its determinants this will lead the
demand curve to shift towards the right side as shown in the graph below where the
demand curve shifts from Do to D1. Here the graph shows that the aggregate
demand for any specific commodity has been increased from Do to D1 and as the
shift is towards the right side of the graph, it is named as demand shift towards
right. The shift in demand towards right usually happens in the bloom period when
buyers will buy more as a result of increase in income of the buyers. The recent
covid-19 were also considered to be as bloom period for some commodities such as
face masks and in this way the demand curve for many products shift towards right
side. For example the demand for covid-19 vaccine during covid-19 phase had shift
towards right side.
c) UK food demand curve:
The UK food demand curve shift from D to D1 in the civid-19, because according to
UK parliament the UK consumers started stockpiling which leads to increase the
left usually happens in the recession period when buyers will buy less as a result of
decline in income of the buyers. The recent covid-19 recession the average wages
rates declined and the demand curve for many products shift towards left side. For
example the demand for luxury products during covid-19 had shift towards left side.
b) Demand shift towards right:
If increase in the demand occur due to any of its determinants this will lead the
demand curve to shift towards the right side as shown in the graph below where the
demand curve shifts from Do to D1. Here the graph shows that the aggregate
demand for any specific commodity has been increased from Do to D1 and as the
shift is towards the right side of the graph, it is named as demand shift towards
right. The shift in demand towards right usually happens in the bloom period when
buyers will buy more as a result of increase in income of the buyers. The recent
covid-19 were also considered to be as bloom period for some commodities such as
face masks and in this way the demand curve for many products shift towards right
side. For example the demand for covid-19 vaccine during covid-19 phase had shift
towards right side.
c) UK food demand curve:
The UK food demand curve shift from D to D1 in the civid-19, because according to
UK parliament the UK consumers started stockpiling which leads to increase the
demand for food and it shift the demand curve toward right side as shown in the
graph.
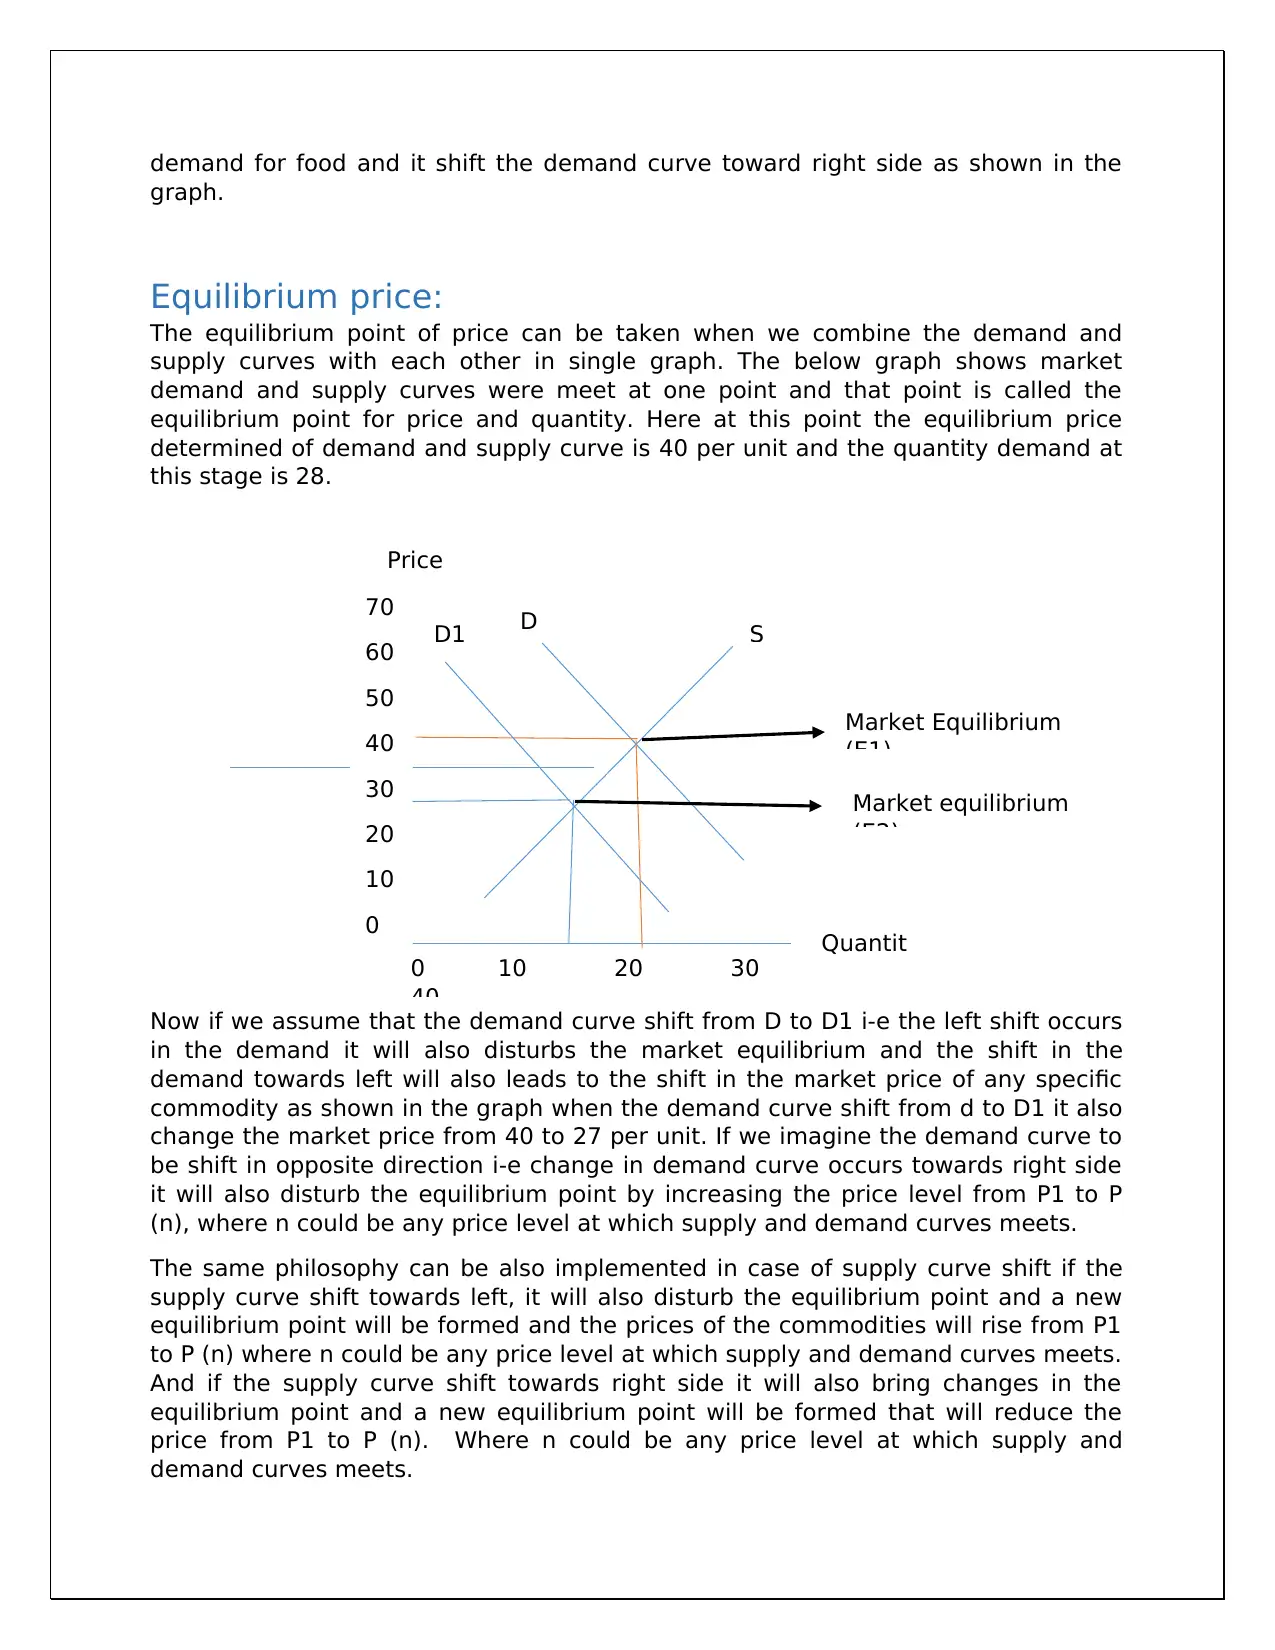
Equilibrium price:
The equilibrium point of price can be taken when we combine the demand and
supply curves with each other in single graph. The below graph shows market
demand and supply curves were meet at one point and that point is called the
equilibrium point for price and quantity. Here at this point the equilibrium price
determined of demand and supply curve is 40 per unit and the quantity demand at
this stage is 28.
Now if we assume that the demand curve shift from D to D1 i-e the left shift occurs
in the demand it will also disturbs the market equilibrium and the shift in the
demand towards left will also leads to the shift in the market price of any specific
commodity as shown in the graph when the demand curve shift from d to D1 it also
change the market price from 40 to 27 per unit. If we imagine the demand curve to
be shift in opposite direction i-e change in demand curve occurs towards right side
it will also disturb the equilibrium point by increasing the price level from P1 to P
(n), where n could be any price level at which supply and demand curves meets.
The same philosophy can be also implemented in case of supply curve shift if the
supply curve shift towards left, it will also disturb the equilibrium point and a new
equilibrium point will be formed and the prices of the commodities will rise from P1
to P (n) where n could be any price level at which supply and demand curves meets.
And if the supply curve shift towards right side it will also bring changes in the
equilibrium point and a new equilibrium point will be formed that will reduce the
price from P1 to P (n). Where n could be any price level at which supply and
demand curves meets.
Price
70
60
50
40
30
20
10
0
D1 S
D
Market Equilibrium
(E1)
Quantit
y0 10 20 30
40
Market equilibrium
(E2)
graph.
Equilibrium price:
The equilibrium point of price can be taken when we combine the demand and
supply curves with each other in single graph. The below graph shows market
demand and supply curves were meet at one point and that point is called the
equilibrium point for price and quantity. Here at this point the equilibrium price
determined of demand and supply curve is 40 per unit and the quantity demand at
this stage is 28.
Now if we assume that the demand curve shift from D to D1 i-e the left shift occurs
in the demand it will also disturbs the market equilibrium and the shift in the
demand towards left will also leads to the shift in the market price of any specific
commodity as shown in the graph when the demand curve shift from d to D1 it also
change the market price from 40 to 27 per unit. If we imagine the demand curve to
be shift in opposite direction i-e change in demand curve occurs towards right side
it will also disturb the equilibrium point by increasing the price level from P1 to P
(n), where n could be any price level at which supply and demand curves meets.
The same philosophy can be also implemented in case of supply curve shift if the
supply curve shift towards left, it will also disturb the equilibrium point and a new
equilibrium point will be formed and the prices of the commodities will rise from P1
to P (n) where n could be any price level at which supply and demand curves meets.
And if the supply curve shift towards right side it will also bring changes in the
equilibrium point and a new equilibrium point will be formed that will reduce the
price from P1 to P (n). Where n could be any price level at which supply and
demand curves meets.
Price
70
60
50
40
30
20
10
0
D1 S
D
Market Equilibrium
(E1)
Quantit
y0 10 20 30
40
Market equilibrium
(E2)
⊘ This is a preview!⊘
Do you want full access?
Subscribe today to unlock all pages.
Trusted by 1+ million students worldwide
Shortage of food in UK:
As during covid-19 the market price for food in UK was above than equilibrium
price, this leads to shortage of food in UK during 2020, where quantity of food
supplied were less than quantity demanded for food. Demand was increased due to
stockpiling while supply were limited to the proportion of food demanded.
Task 2:
UK market failure:
A market failure is an economic situation where there will be insufficient supply of
food in free market. Sometimes market failure issue arises due to the fact that each
individual is using their rational behavior i-e every individual consumer wants to buy
more in recession situation. Same happened to the UK market of food during covid-
19 and food consumers started stockpiling, on the other hand the supply side for UK
food and its food distribution channels faced challenges during lockdown imposed
on 23/3/2020. This differences in demand and supply curves for UK food supply
caused an economic situation known as market failure. This were also known as
steady-state disequilibrium where quantity supplied were not able to fulfill the
quantity demanded. Usually there are two forms of market failure one is ideal case
and its occurrence is almost equal to zero, this is a situation where quantity supply
is almost zero and it fails to fulfill the quantity demanded. While the other from of
market failure is most common and happens often here the quantity supply is not
equal to zero rather there will be some amount of quantity supplied, problem here
with it is that this quantity supplied is unable to meet the quantity demanded. The
UK food supply market also faced this form of market failure during 2020, where
quantity supply for food was unable to fulfill the quantity demanded for the food.
Governmental interventions to control market failure:
1) Interventions by Defra:
It is considered that, when the crises for food shortage occurs, the (Defra)
department for food and rural affairs started their best to manage the critical
situation faced by the country, they took measures to help retailers for sudden
increase in demand for food as result of corona virus.
Although, it is said that the government had not calculated the amount increased
for food in the retails stores, which may cause disruptive effect on food supply for
consumers. Besides this empty shelves for food in some arias had already been
noticed.
The government of UK is somehow satisfied from the performance of (Defra)
department regarding food distribution to its subjects and will try to continue their
struggles regarding food distribution channels through retailers. The government of
Paraphrase This Document
Need a fresh take? Get an instant paraphrase of this document with our AI Paraphraser
UK uses the CCS technique for monitoring the whole food distribution channels, CCS
means (Civil Contingencies Secretariat). According to government of UK empty
shelves for food had also been recorded in different counties with different
proportions. Like for example in Italy relatively small increase for food demand was
reported in the mid-late of February, 2020. But there was a great deal of demand
for food in Spain, their demand curve shift sharply toward right side during corona
virus in the mid of march. In case of UK the demand for different food products also
rose in starting weeks of the lockdown. But the government started their
interventions in this economic failure situation by work with retails and food
distribution channels and they were somehow successful in it. The UK government
is trying to cope the increase in demand by working with distribution channels. The
government of UK is trying their best to reduce shortage faced to the country with
partnering food distribution channels.by the end of June 2020, government got
success in refilling the empty shelves.
2) Interventions to Aid online shopping:
As in corona virus the demand for online shopping had increased sharply, so to
reduce the impact of economic failure faced to UK government of UK is trying their
best to work with food sector to bridge the gap between quantity demanded and
quantity supplied for food. The government of UK are making online delivery system
on easy terms and conditions for online shops and online grocery shopping. The
government temporary give relaxation for online grocery shops. People of UK prefer
to buy by just “click and deliver” as they many people lives are more vulnerable to
be affected badly with corona virus as many of them are over aged in UK, so
government is trying to facilitate them by giving temporary relaxation to inline
grocery stores.
3) Interventions to protect food waste:
Food banks are the other sector through government of UK tried to reduce the gap
between demand and supply for food, the use of food banks was increasingly going
up before the pandemic but it get even doubled during covid-19. Food banks
usually helps those who has low income and low social support. The government of
UK announced a £16million financial aid with food banks to distribute food among poor class
and lower income workers. The government also announced £6.5bn for those who get affected
by covid-19 pandemic.
4) Financial Aid to Food redistribution centers:
Other major issue with UK food supply is the food waste trend, saving food from
waste should be first priority of the governments normally but it must be considered
as top 1st action to be performed by the government when the country face a
recession economic period. The government of UK has two main aims regarding
food redistributions and food waste reduction. 1st sustainable developing goal with a
target of 50% or 12.3 reduction of food waste till 2030 and other with aims of
reducing food waste up to 20% till 2025 (C205) with the planning of Courtauld
commitment 2025.
My perception about UK government intervention to
Economic failure:
As during corona virus stages all world economies got suffered similarly UK
economies suffered during 2020, there was economic failure in the country as a
result of gaps between quantity supplied of food and quantity demanded for the
food. There are many reason subject to this gaps like stockpiling by food consumers
leads to empty shelves of food at retails. The interventions of government
discussed above are good steps taken by UK government during covid-19. All step
taken by government to control food supply had a positive impact on overall UK
food supply system, and all interventions had its own contribution to overcome the
gap between food supply and food demand.
References:
B. Dean, 2021. ”UK confirms move to curb ‘junk food’ promos”. [Online] Available
at:< https://www.just-food.com/news/uk-confirms-move-to-curb-junk-food-
⊘ This is a preview!⊘
Do you want full access?
Subscribe today to unlock all pages.
Trusted by 1+ million students worldwide
promos_id144964.aspx#:~:text=From%20April%2C%20UK%20grocers%20will,or
%20'3%20for%202’ > [Accessed 8 March 2021]
Economics online, 2021. “Shift in supply”. [Online] Available at:
<https://www.economicsonline.co.uk/Competitive_markets/Shifts_in_supply.html >
[Accessed 9 March 2021].
Investopedia, nd. “Market failure”. [Online] Available at:
<https://www.investopedia.com/terms/m/marketfailure.asp#:~:text=What%20is
%20Market%20Failure%3F,rational%20outcomes%20for%20the%20group >
[Accessed 8 March 2021].
MIcRoEconOMIc, 2013. “Economic of Chatime” [online] Available at: <
http://microeconomicworld.blogspot.com/2013/ > [Accessed 8 March 2021].
Parliament, Uk. 2020. “COVID-19 and food supply: Government Response to the
Committee’s First Report” [online] Available at:
<https://publications.parliament.uk/pa/cm5801/cmselect/cmenvfru/841/84102.htm
> [Accessed 8 March 2021].
R. Margaret, A. Anderson, P. Krugman, R. Wells. 2015. “Krugman’s Economics for
AP” 2nd ed. New York: SAGE
UK Parliament. 2020, “Effects of COVID-19 on the food supply system”. [Online]
Available at:
<https://post.parliament.uk/effects-of-covid-19-on-the-food-supply-system/ >
[Accessed 8 March 2021].
US stranger. 2016. “How to draw Demand Curve on Microsoft Word” [video].
YouTube. Retrieved from https://www.youtube.com/watch?v=N5YO9r25uJM.
1 out of 10
Related Documents


Your All-in-One AI-Powered Toolkit for Academic Success.
+13062052269
info@desklib.com
Available 24*7 on WhatsApp / Email
![[object Object]](/_next/static/media/star-bottom.7253800d.svg)
Unlock your academic potential
Copyright © 2020–2026 A2Z Services. All Rights Reserved. Developed and managed by ZUCOL.