Analysis of UK Food Market: Demand, Supply, and Government Policies
VerifiedAdded on 2022/12/26
|15
|3714
|36
Report
AI Summary
This report provides an executive summary of the UK food market, focusing on the laws of supply and demand, and their application to the food industry. It explores movements and shifts along the demand and supply curves, explaining how factors such as price changes, technology, and consumer preferences influence market dynamics. The report also examines the concept of equilibrium, including how changes in price and quantity affect market outcomes, and discusses the implications of shortages and surpluses. Furthermore, it analyzes the impact of UK government economic policies, particularly during the COVID-19 pandemic, on the food supply chain. The analysis includes diagrams and examples to illustrate key concepts, offering a comprehensive overview of the economic principles governing the UK food market.
ECONOMICS FOR
BUSINESS
BUSINESS
Paraphrase This Document
Need a fresh take? Get an instant paraphrase of this document with our AI Paraphraser
EXECUTIVE SUMMARY
This report shows the law of supply and law of demand of food in UK market. Movement
along with demand curve and supply curve of the food supply. Shift in supply curve and demand
curve by leftward and rightwards supply and demand of food products. Further, Equilibrium
level which leads to change in quantity and change in price with few concepts of shortage and
surplus in demand and supply of food chain. Lastly, economic policies of UK government that
affect during Covid-19 pandemic and unable to meet the demand and supply of food chain in
UK market.
Table of Contents
EXECUTIVE SUMMARY.............................................................................................................2
INTRODUCTION...........................................................................................................................4
MAIN BODY...................................................................................................................................4
Task 1...............................................................................................................................................4
Movement in supply curve...........................................................................................................5
Shift in supply curve....................................................................................................................6
Movement along with demand curve...........................................................................................7
Shift in demand curve..................................................................................................................8
Equilibrium price and quantity....................................................................................................9
Task 2.............................................................................................................................................11
CONCLUSION..............................................................................................................................13
REFERENCES................................................................................................................................1
⊘ This is a preview!⊘
Do you want full access?
Subscribe today to unlock all pages.
Trusted by 1+ million students worldwide
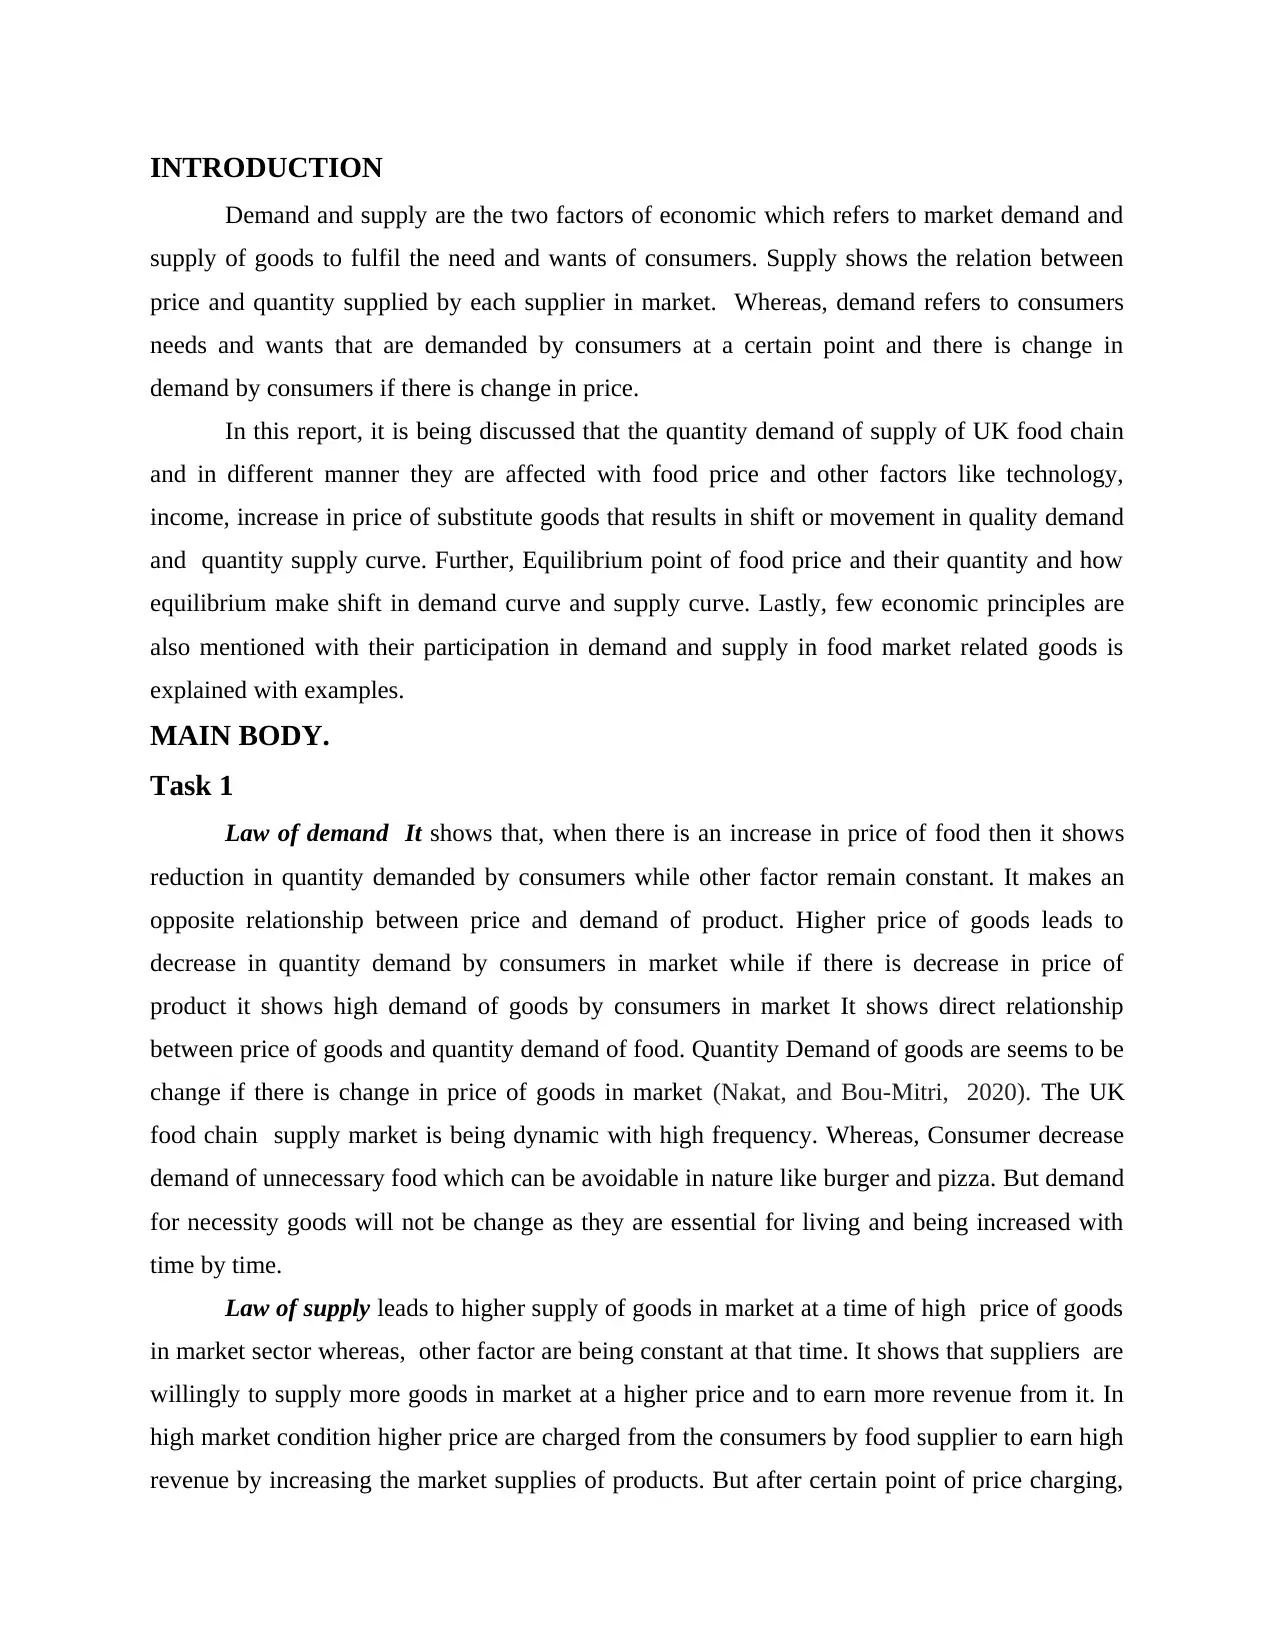
INTRODUCTION
Demand and supply are the two factors of economic which refers to market demand and
supply of goods to fulfil the need and wants of consumers. Supply shows the relation between
price and quantity supplied by each supplier in market. Whereas, demand refers to consumers
needs and wants that are demanded by consumers at a certain point and there is change in
demand by consumers if there is change in price.
In this report, it is being discussed that the quantity demand of supply of UK food chain
and in different manner they are affected with food price and other factors like technology,
income, increase in price of substitute goods that results in shift or movement in quality demand
and quantity supply curve. Further, Equilibrium point of food price and their quantity and how
equilibrium make shift in demand curve and supply curve. Lastly, few economic principles are
also mentioned with their participation in demand and supply in food market related goods is
explained with examples.
MAIN BODY.
Task 1
Law of demand It shows that, when there is an increase in price of food then it shows
reduction in quantity demanded by consumers while other factor remain constant. It makes an
opposite relationship between price and demand of product. Higher price of goods leads to
decrease in quantity demand by consumers in market while if there is decrease in price of
product it shows high demand of goods by consumers in market It shows direct relationship
between price of goods and quantity demand of food. Quantity Demand of goods are seems to be
change if there is change in price of goods in market (Nakat, and Bou-Mitri, 2020). The UK
food chain supply market is being dynamic with high frequency. Whereas, Consumer decrease
demand of unnecessary food which can be avoidable in nature like burger and pizza. But demand
for necessity goods will not be change as they are essential for living and being increased with
time by time.
Law of supply leads to higher supply of goods in market at a time of high price of goods
in market sector whereas, other factor are being constant at that time. It shows that suppliers are
willingly to supply more goods in market at a higher price and to earn more revenue from it. In
high market condition higher price are charged from the consumers by food supplier to earn high
revenue by increasing the market supplies of products. But after certain point of price charging,
Paraphrase This Document
Need a fresh take? Get an instant paraphrase of this document with our AI Paraphraser
it leads to decrease in demand of goods in food market. However, there is a direct relationship
between price and quantity supplied in market.
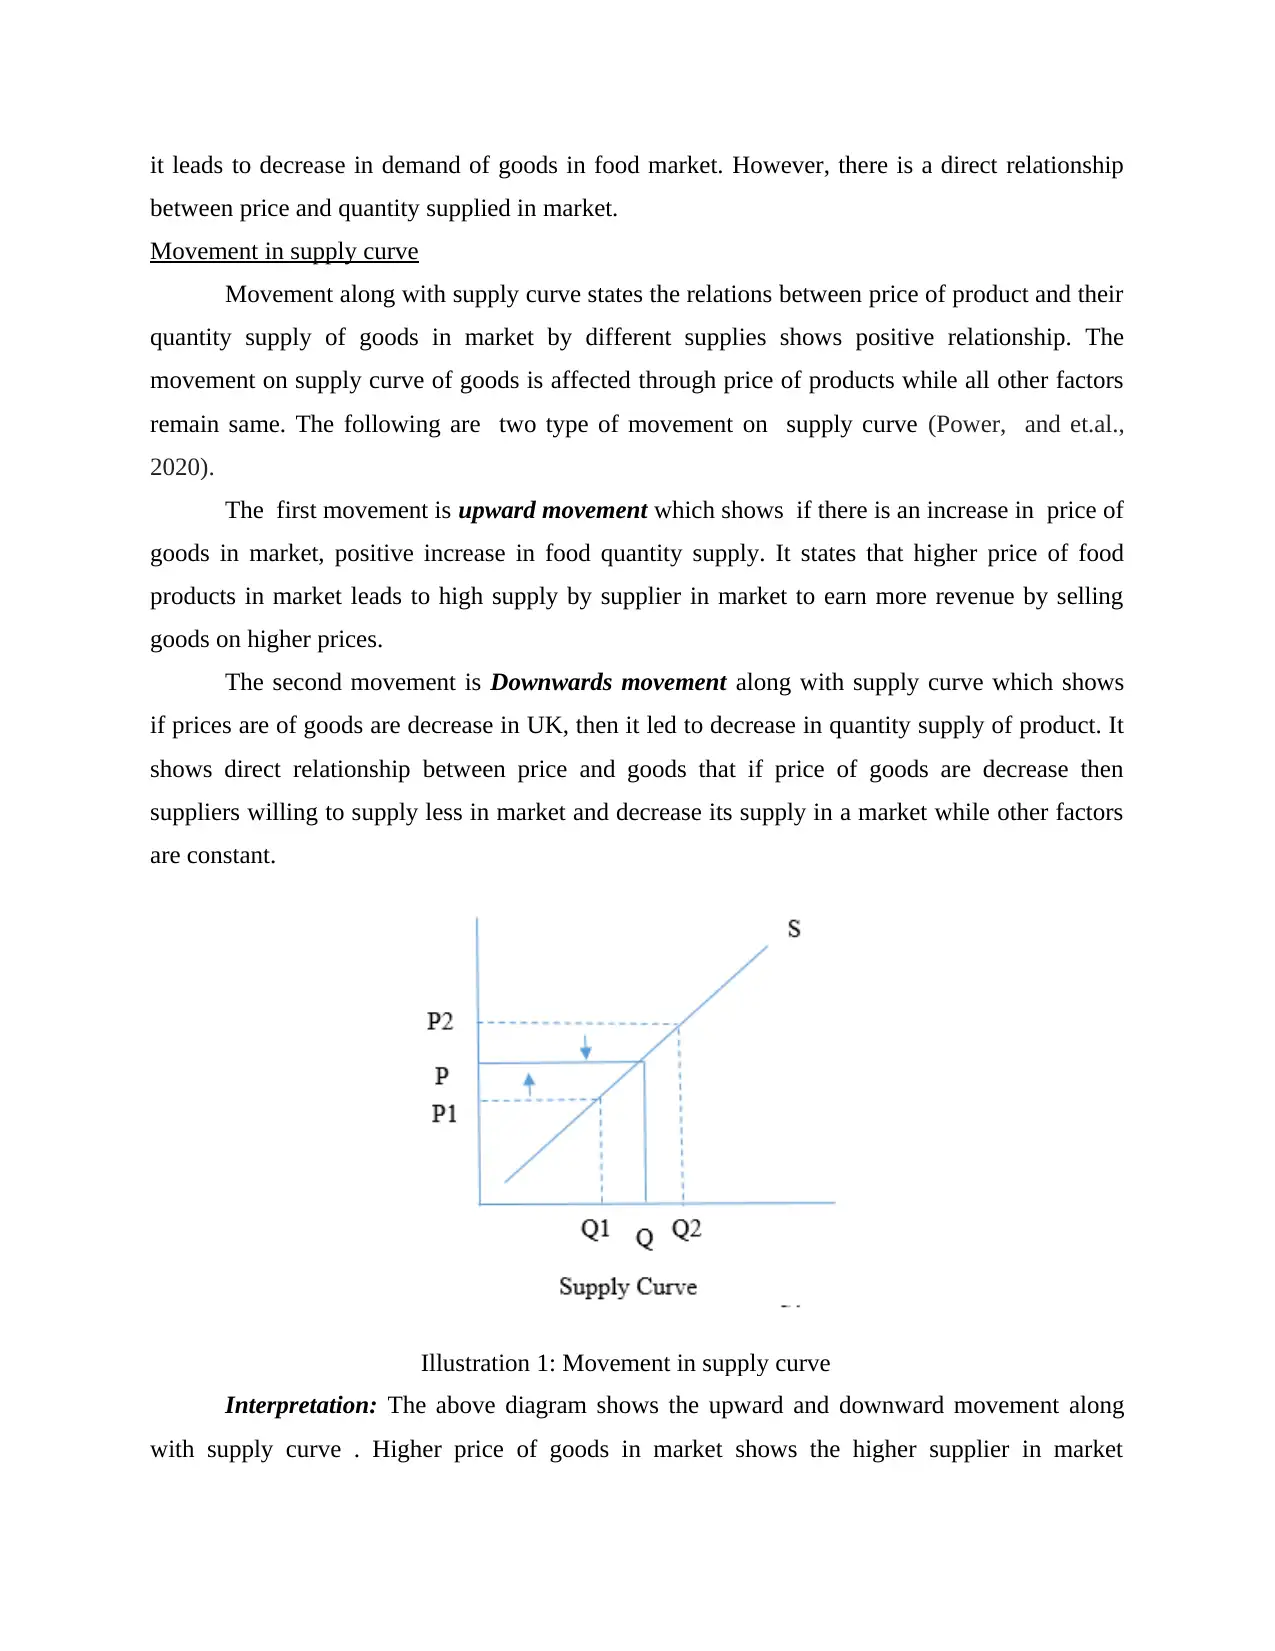
Movement in supply curve
Movement along with supply curve states the relations between price of product and their
quantity supply of goods in market by different supplies shows positive relationship. The
movement on supply curve of goods is affected through price of products while all other factors
remain same. The following are two type of movement on supply curve (Power, and et.al.,
2020).
The first movement is upward movement which shows if there is an increase in price of
goods in market, positive increase in food quantity supply. It states that higher price of food
products in market leads to high supply by supplier in market to earn more revenue by selling
goods on higher prices.
The second movement is Downwards movement along with supply curve which shows
if prices are of goods are decrease in UK, then it led to decrease in quantity supply of product. It
shows direct relationship between price and goods that if price of goods are decrease then
suppliers willing to supply less in market and decrease its supply in a market while other factors
are constant.
Illustration 1: Movement in supply curve
Interpretation: The above diagram shows the upward and downward movement along
with supply curve . Higher price of goods in market shows the higher supplier in market
between price and quantity supplied in market.
Movement in supply curve
Movement along with supply curve states the relations between price of product and their
quantity supply of goods in market by different supplies shows positive relationship. The
movement on supply curve of goods is affected through price of products while all other factors
remain same. The following are two type of movement on supply curve (Power, and et.al.,
2020).
The first movement is upward movement which shows if there is an increase in price of
goods in market, positive increase in food quantity supply. It states that higher price of food
products in market leads to high supply by supplier in market to earn more revenue by selling
goods on higher prices.
The second movement is Downwards movement along with supply curve which shows
if prices are of goods are decrease in UK, then it led to decrease in quantity supply of product. It
shows direct relationship between price and goods that if price of goods are decrease then
suppliers willing to supply less in market and decrease its supply in a market while other factors
are constant.
Illustration 1: Movement in supply curve
Interpretation: The above diagram shows the upward and downward movement along
with supply curve . Higher price of goods in market shows the higher supplier in market
whereas, decrease in price of products leads to decrease in market supply by supplier in market
in order to avoid the losses.
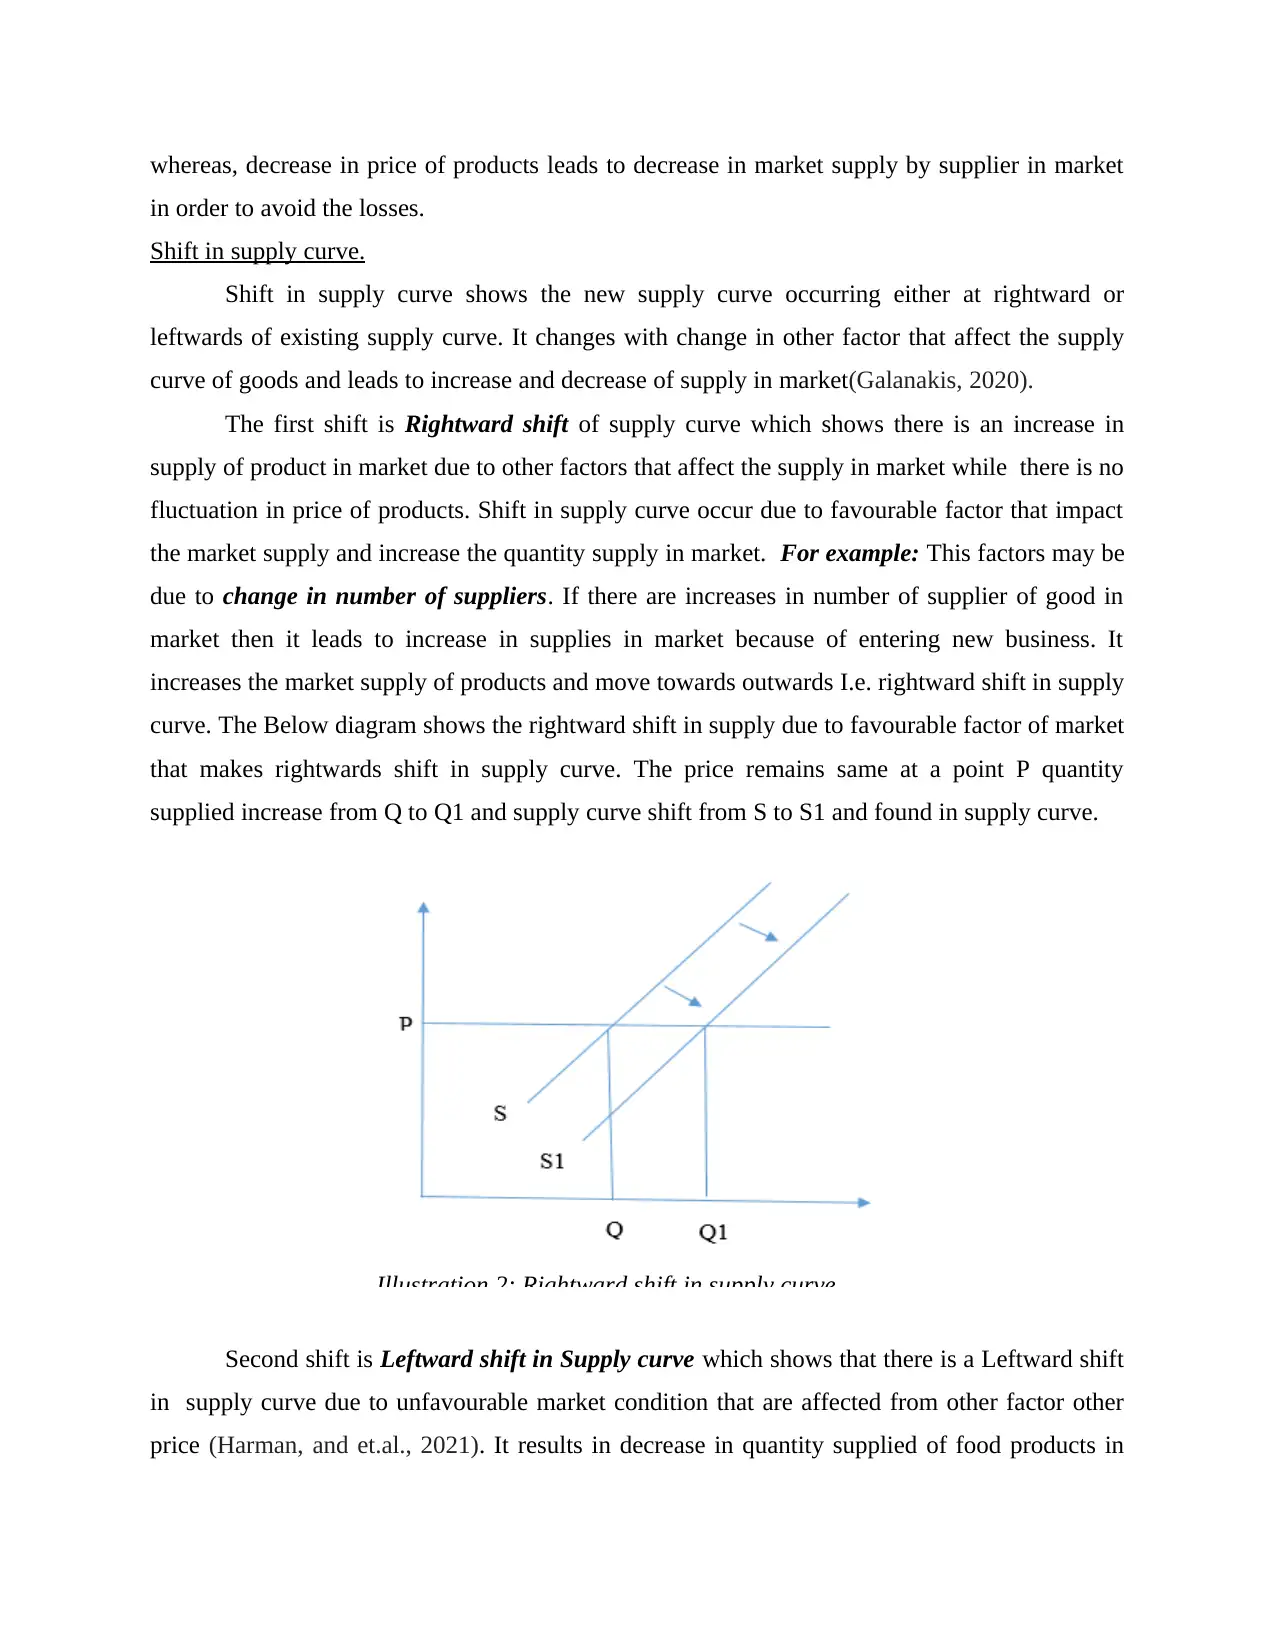
Shift in supply curve.
Shift in supply curve shows the new supply curve occurring either at rightward or
leftwards of existing supply curve. It changes with change in other factor that affect the supply
curve of goods and leads to increase and decrease of supply in market(Galanakis, 2020).
The first shift is Rightward shift of supply curve which shows there is an increase in
supply of product in market due to other factors that affect the supply in market while there is no
fluctuation in price of products. Shift in supply curve occur due to favourable factor that impact
the market supply and increase the quantity supply in market. For example: This factors may be
due to change in number of suppliers. If there are increases in number of supplier of good in
market then it leads to increase in supplies in market because of entering new business. It
increases the market supply of products and move towards outwards I.e. rightward shift in supply
curve. The Below diagram shows the rightward shift in supply due to favourable factor of market
that makes rightwards shift in supply curve. The price remains same at a point P quantity
supplied increase from Q to Q1 and supply curve shift from S to S1 and found in supply curve.
Illustration 2: Rightward shift in supply curve
Second shift is Leftward shift in Supply curve which shows that there is a Leftward shift
in supply curve due to unfavourable market condition that are affected from other factor other
price (Harman, and et.al., 2021). It results in decrease in quantity supplied of food products in
in order to avoid the losses.
Shift in supply curve.
Shift in supply curve shows the new supply curve occurring either at rightward or
leftwards of existing supply curve. It changes with change in other factor that affect the supply
curve of goods and leads to increase and decrease of supply in market(Galanakis, 2020).
The first shift is Rightward shift of supply curve which shows there is an increase in
supply of product in market due to other factors that affect the supply in market while there is no
fluctuation in price of products. Shift in supply curve occur due to favourable factor that impact
the market supply and increase the quantity supply in market. For example: This factors may be
due to change in number of suppliers. If there are increases in number of supplier of good in
market then it leads to increase in supplies in market because of entering new business. It
increases the market supply of products and move towards outwards I.e. rightward shift in supply
curve. The Below diagram shows the rightward shift in supply due to favourable factor of market
that makes rightwards shift in supply curve. The price remains same at a point P quantity
supplied increase from Q to Q1 and supply curve shift from S to S1 and found in supply curve.
Illustration 2: Rightward shift in supply curve
Second shift is Leftward shift in Supply curve which shows that there is a Leftward shift
in supply curve due to unfavourable market condition that are affected from other factor other
price (Harman, and et.al., 2021). It results in decrease in quantity supplied of food products in
⊘ This is a preview!⊘
Do you want full access?
Subscribe today to unlock all pages.
Trusted by 1+ million students worldwide
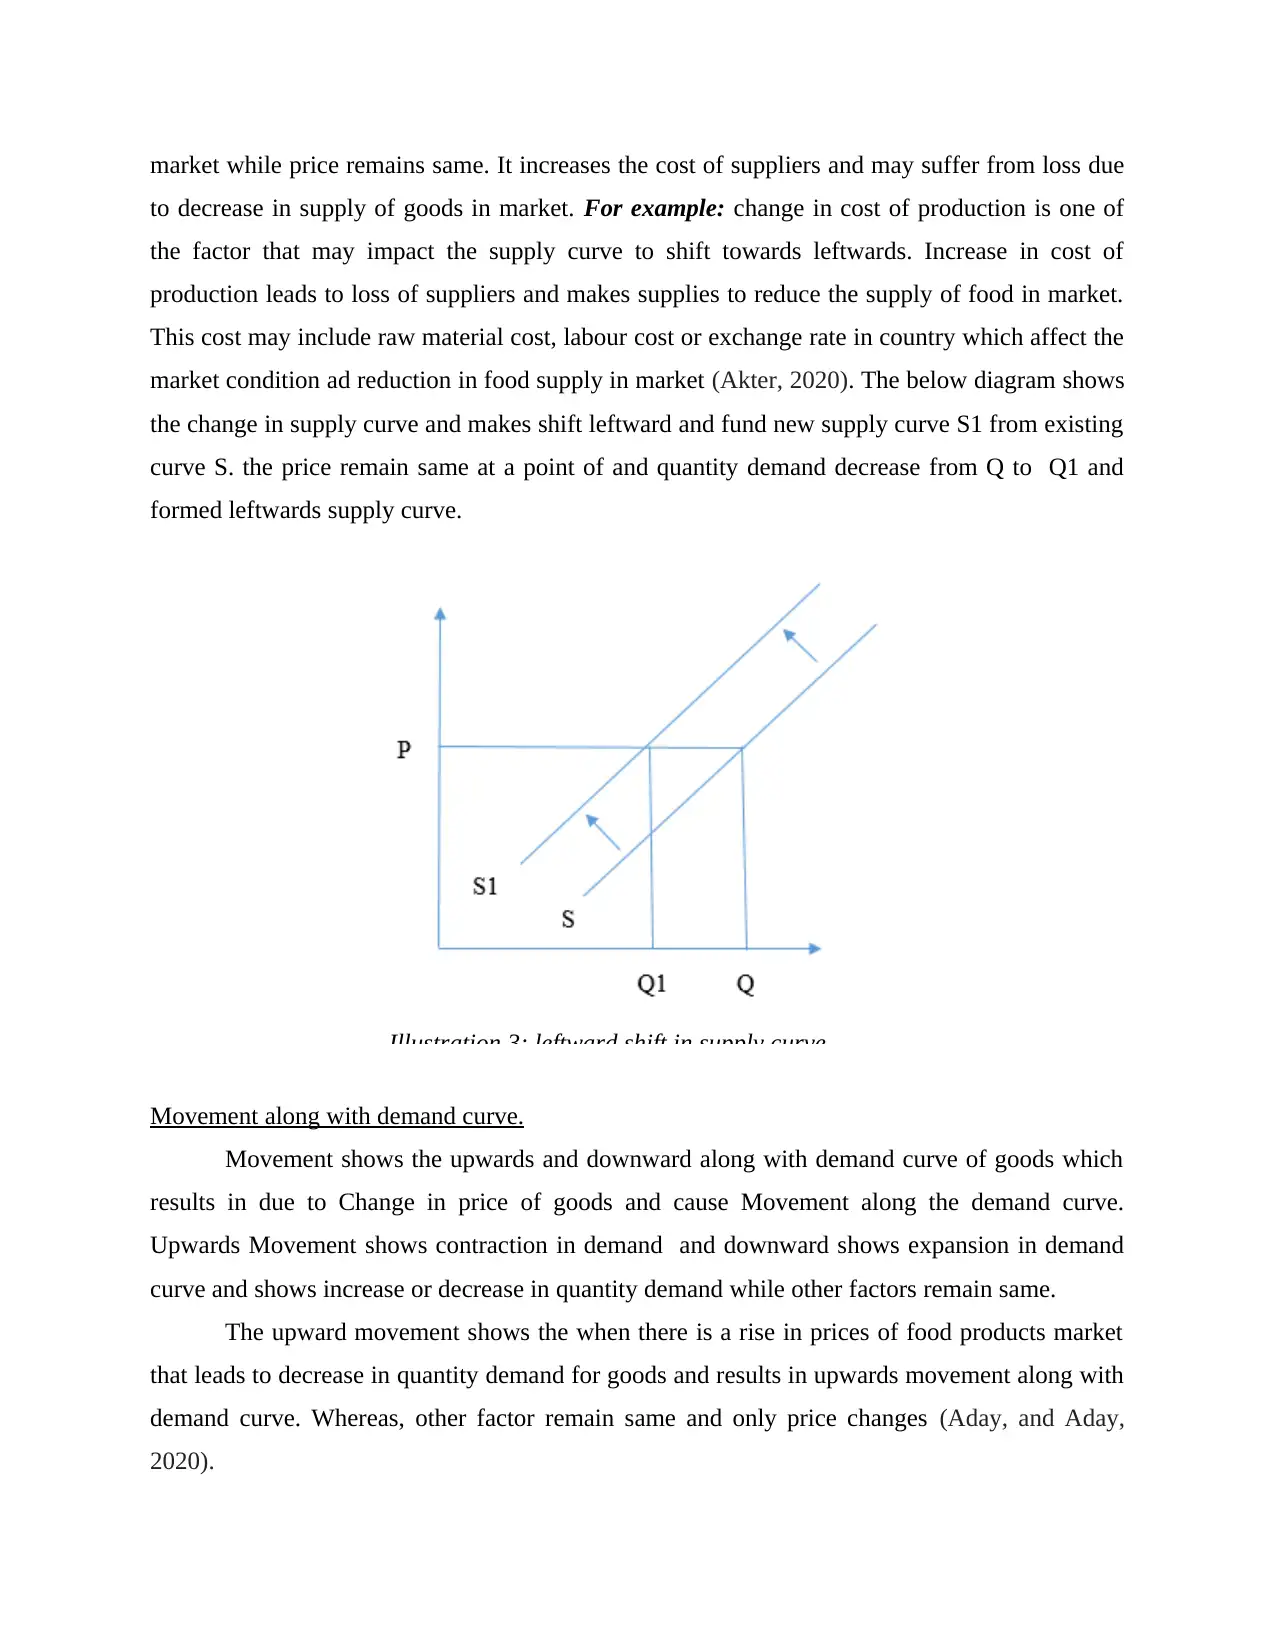
market while price remains same. It increases the cost of suppliers and may suffer from loss due
to decrease in supply of goods in market. For example: change in cost of production is one of
the factor that may impact the supply curve to shift towards leftwards. Increase in cost of
production leads to loss of suppliers and makes supplies to reduce the supply of food in market.
This cost may include raw material cost, labour cost or exchange rate in country which affect the
market condition ad reduction in food supply in market (Akter, 2020). The below diagram shows
the change in supply curve and makes shift leftward and fund new supply curve S1 from existing
curve S. the price remain same at a point of and quantity demand decrease from Q to Q1 and
formed leftwards supply curve.
Illustration 3: leftward shift in supply curve
Movement along with demand curve.
Movement shows the upwards and downward along with demand curve of goods which
results in due to Change in price of goods and cause Movement along the demand curve.
Upwards Movement shows contraction in demand and downward shows expansion in demand
curve and shows increase or decrease in quantity demand while other factors remain same.
The upward movement shows the when there is a rise in prices of food products market
that leads to decrease in quantity demand for goods and results in upwards movement along with
demand curve. Whereas, other factor remain same and only price changes (Aday, and Aday,
2020).
Paraphrase This Document
Need a fresh take? Get an instant paraphrase of this document with our AI Paraphraser
On the other hand, downwards movement of demand curve shows when increase in
quantity demanded by consumers of food product in market due to decrease in price of goods. It
shows the behaviour of consumers that are willing to purchase more goods at lower price and
consume more of goods. It makes the downward movement along with demand curve while
other factors remain constant.
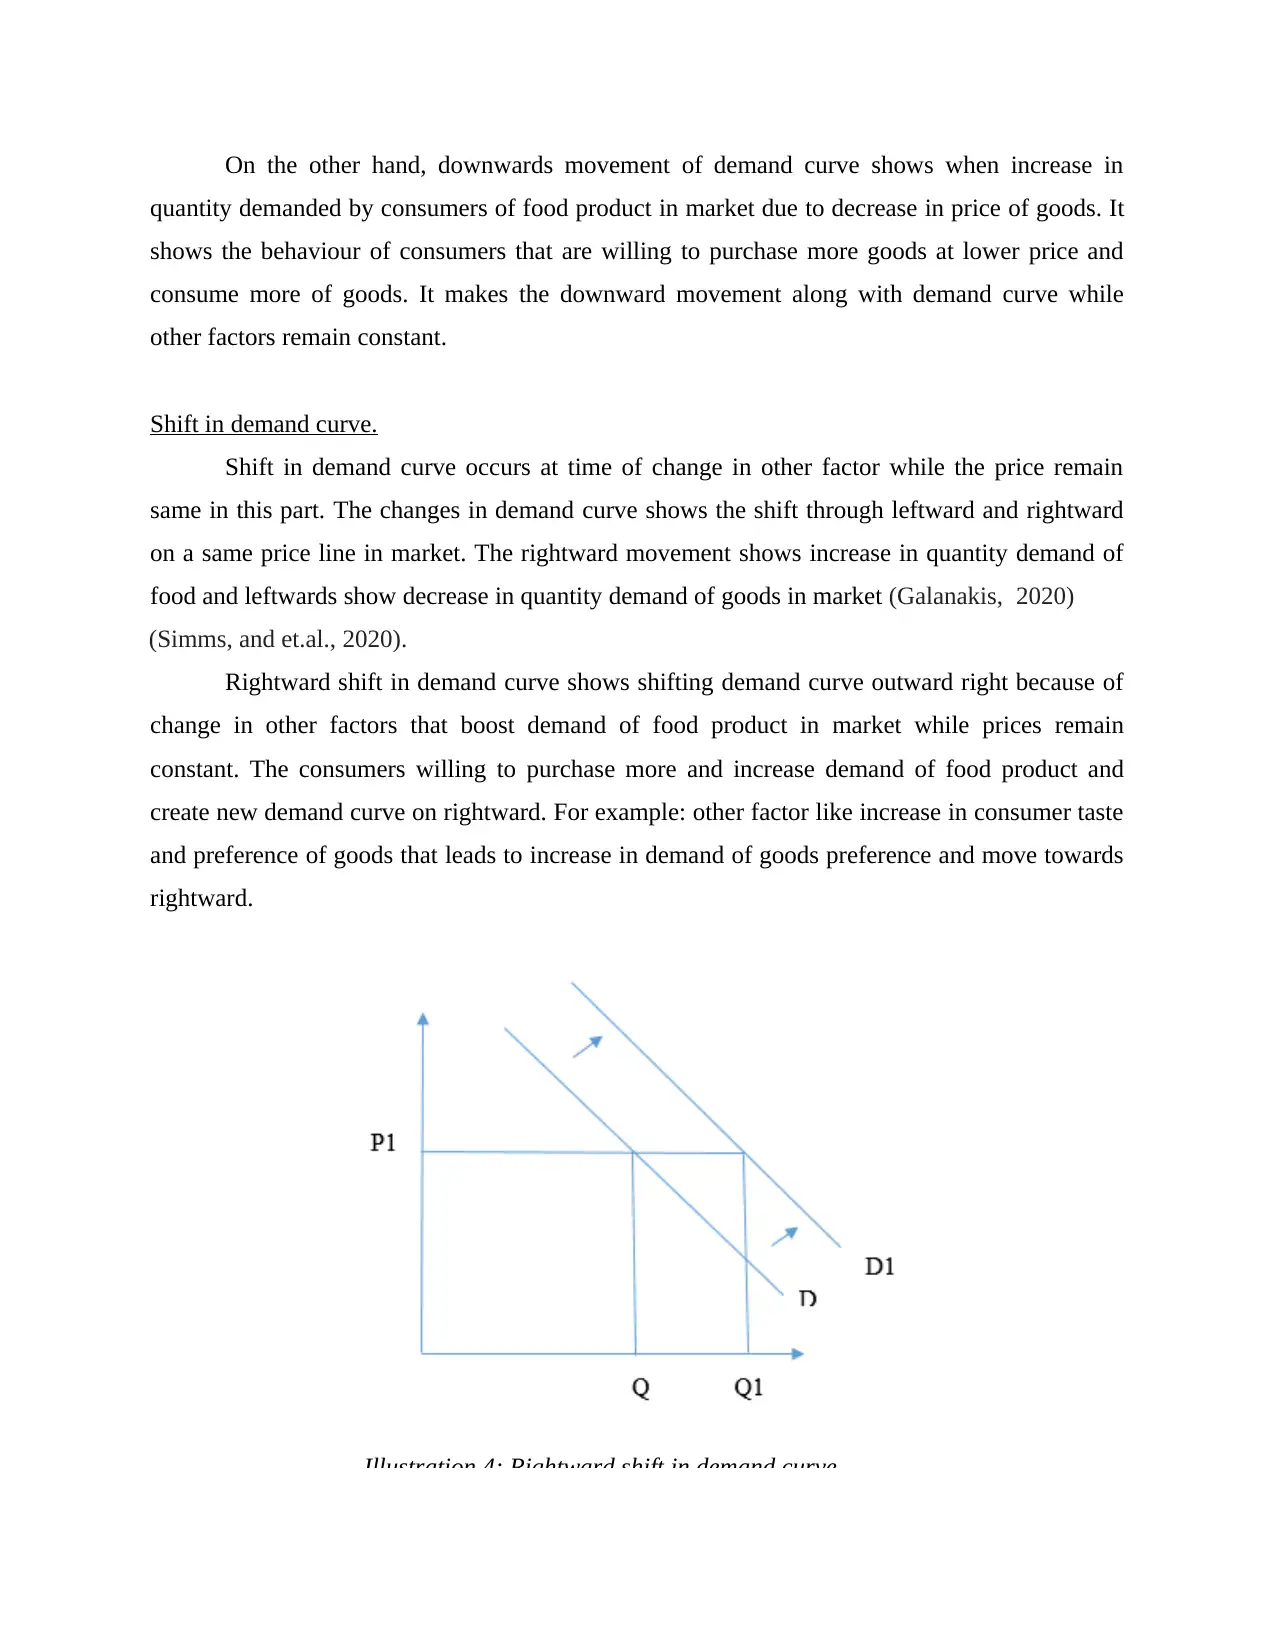
Shift in demand curve.
Shift in demand curve occurs at time of change in other factor while the price remain
same in this part. The changes in demand curve shows the shift through leftward and rightward
on a same price line in market. The rightward movement shows increase in quantity demand of
food and leftwards show decrease in quantity demand of goods in market (Galanakis, 2020)
(Simms, and et.al., 2020).
Rightward shift in demand curve shows shifting demand curve outward right because of
change in other factors that boost demand of food product in market while prices remain
constant. The consumers willing to purchase more and increase demand of food product and
create new demand curve on rightward. For example: other factor like increase in consumer taste
and preference of goods that leads to increase in demand of goods preference and move towards
rightward.
Illustration 4: Rightward shift in demand curve
quantity demanded by consumers of food product in market due to decrease in price of goods. It
shows the behaviour of consumers that are willing to purchase more goods at lower price and
consume more of goods. It makes the downward movement along with demand curve while
other factors remain constant.
Shift in demand curve.
Shift in demand curve occurs at time of change in other factor while the price remain
same in this part. The changes in demand curve shows the shift through leftward and rightward
on a same price line in market. The rightward movement shows increase in quantity demand of
food and leftwards show decrease in quantity demand of goods in market (Galanakis, 2020)
(Simms, and et.al., 2020).
Rightward shift in demand curve shows shifting demand curve outward right because of
change in other factors that boost demand of food product in market while prices remain
constant. The consumers willing to purchase more and increase demand of food product and
create new demand curve on rightward. For example: other factor like increase in consumer taste
and preference of goods that leads to increase in demand of goods preference and move towards
rightward.
Illustration 4: Rightward shift in demand curve
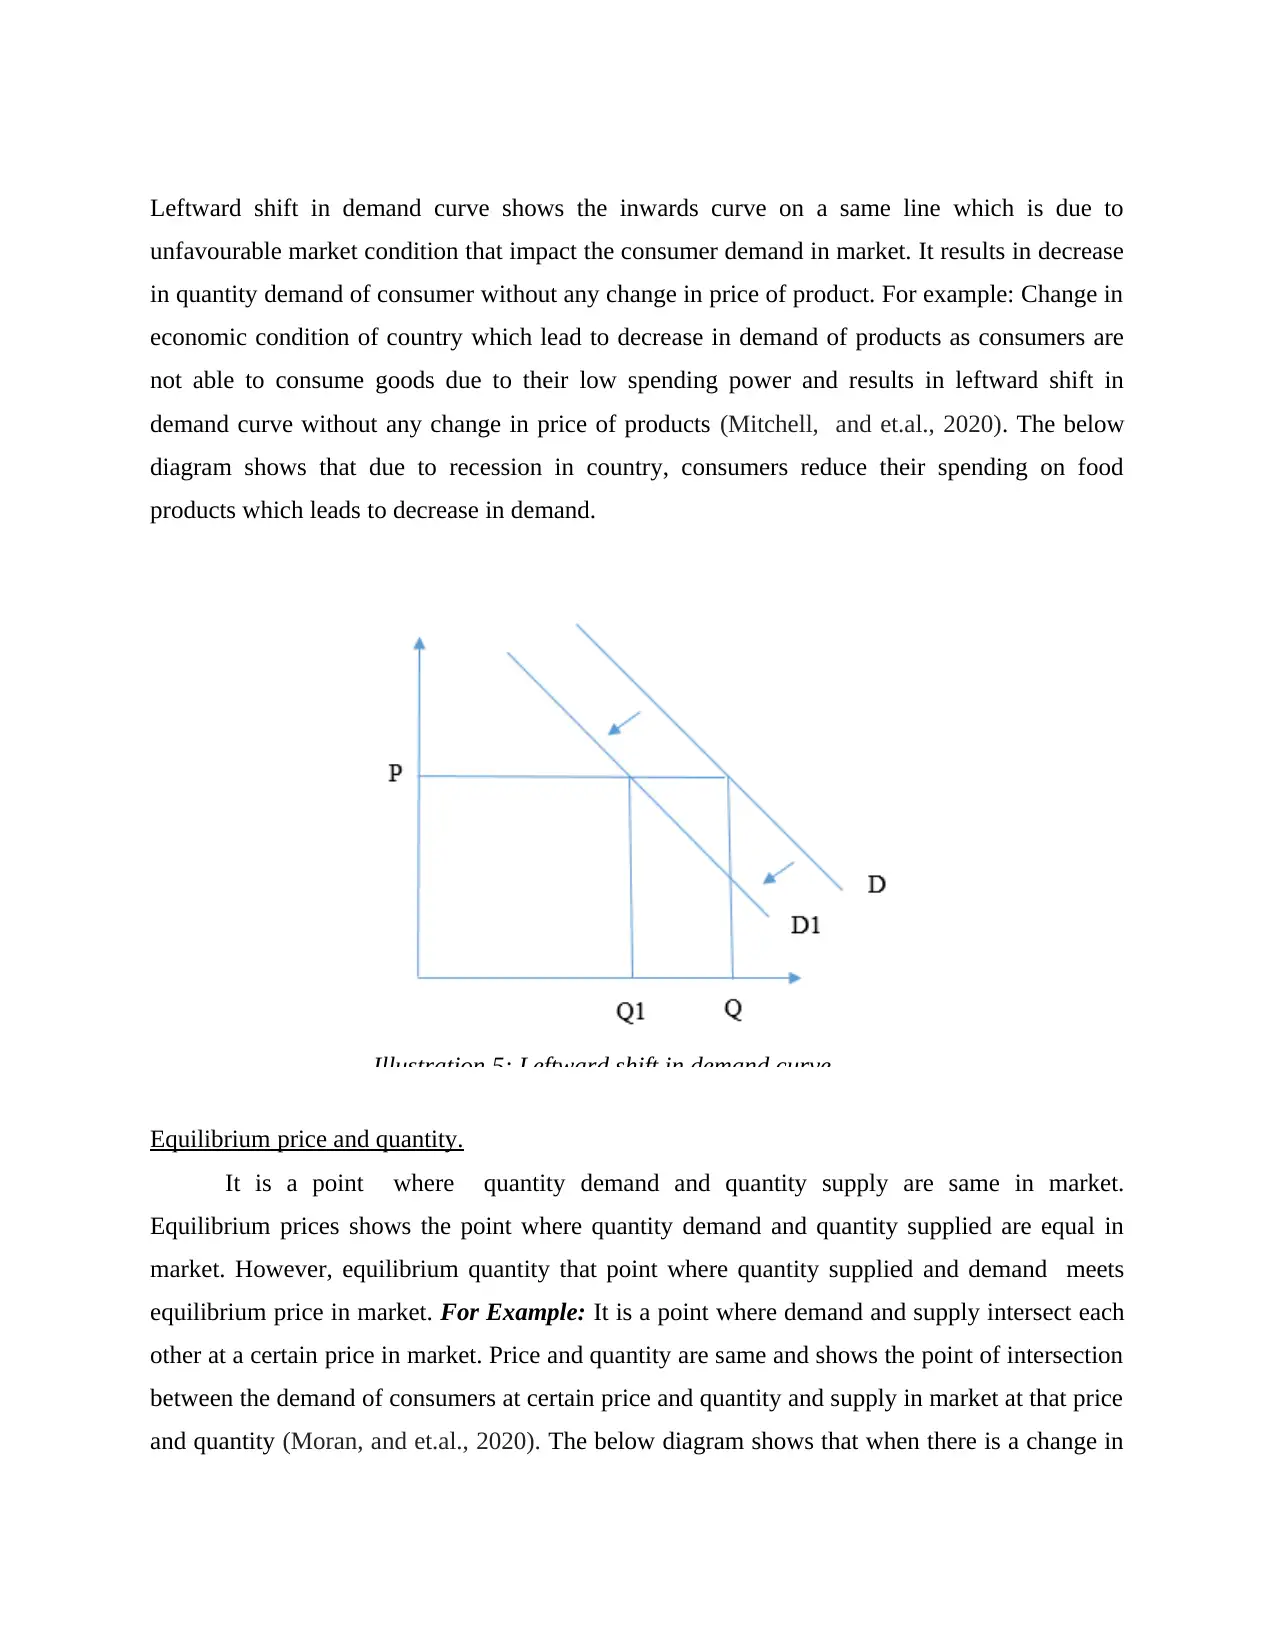
Leftward shift in demand curve shows the inwards curve on a same line which is due to
unfavourable market condition that impact the consumer demand in market. It results in decrease
in quantity demand of consumer without any change in price of product. For example: Change in
economic condition of country which lead to decrease in demand of products as consumers are
not able to consume goods due to their low spending power and results in leftward shift in
demand curve without any change in price of products (Mitchell, and et.al., 2020). The below
diagram shows that due to recession in country, consumers reduce their spending on food
products which leads to decrease in demand.
Illustration 5: Leftward shift in demand curve
Equilibrium price and quantity.
It is a point where quantity demand and quantity supply are same in market.
Equilibrium prices shows the point where quantity demand and quantity supplied are equal in
market. However, equilibrium quantity that point where quantity supplied and demand meets
equilibrium price in market. For Example: It is a point where demand and supply intersect each
other at a certain price in market. Price and quantity are same and shows the point of intersection
between the demand of consumers at certain price and quantity and supply in market at that price
and quantity (Moran, and et.al., 2020). The below diagram shows that when there is a change in
⊘ This is a preview!⊘
Do you want full access?
Subscribe today to unlock all pages.
Trusted by 1+ million students worldwide
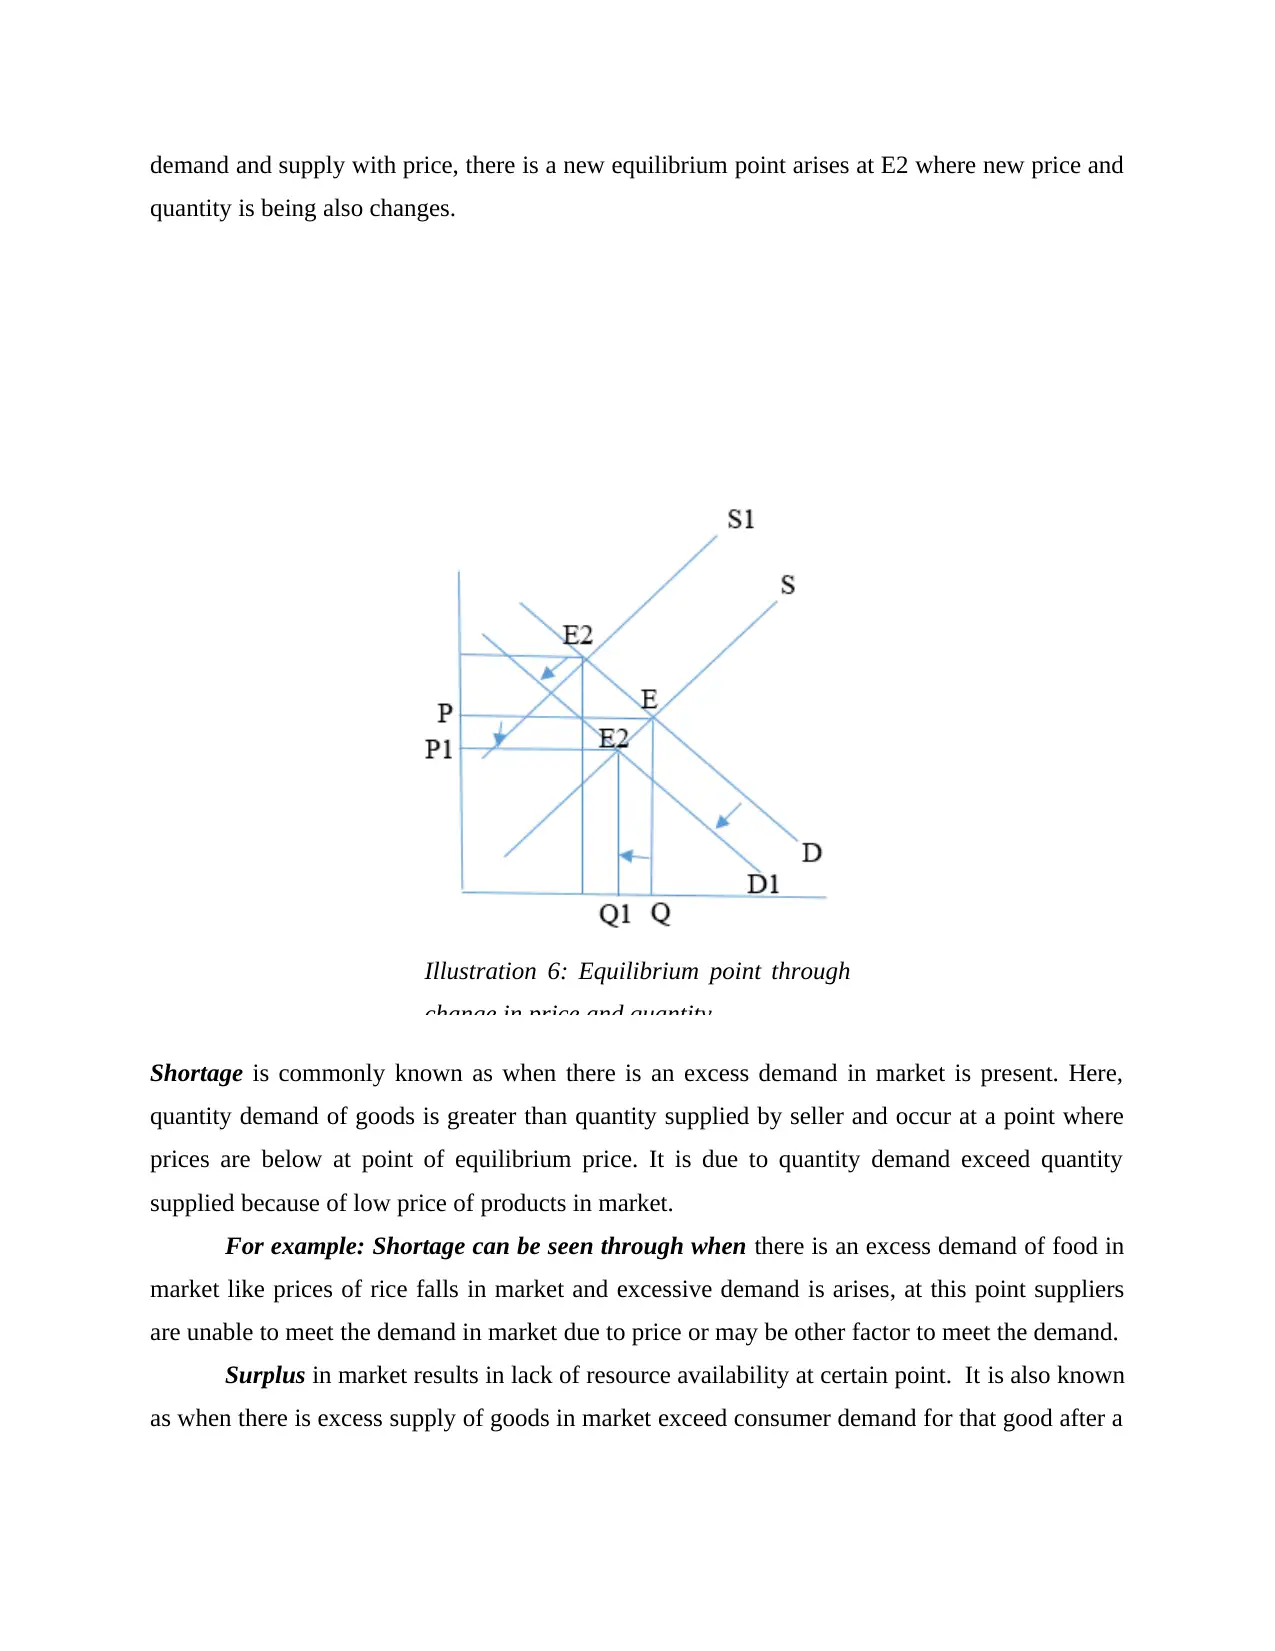
demand and supply with price, there is a new equilibrium point arises at E2 where new price and
quantity is being also changes.
Shortage is commonly known as when there is an excess demand in market is present. Here,
quantity demand of goods is greater than quantity supplied by seller and occur at a point where
prices are below at point of equilibrium price. It is due to quantity demand exceed quantity
supplied because of low price of products in market.
For example: Shortage can be seen through when there is an excess demand of food in
market like prices of rice falls in market and excessive demand is arises, at this point suppliers
are unable to meet the demand in market due to price or may be other factor to meet the demand.
Surplus in market results in lack of resource availability at certain point. It is also known
as when there is excess supply of goods in market exceed consumer demand for that good after a
Illustration 6: Equilibrium point through
change in price and quantity
Paraphrase This Document
Need a fresh take? Get an instant paraphrase of this document with our AI Paraphraser
specific price. It shows at a point above equilibrium price. However, surplus shows when
quantity supplied exceed quantity demand in market.
For example: The there is excess of supply of Rice in market where suppliers increase
supply of rice in market because of high price and to generate good revenue which results in
supply curve changes.
Task 2
1. Price control: During the Covid-19 pandemic, demand for food had increase rapidly
within few days after the lock down had being announced. It increases the demand of
food products high due to increase in demanded but it makes shortage of food in country
where suppliers are unavailable to meet demand of UK citizen. It creates high price of
food in market and increase in consumer expenditure in country. There is a high demand
for necessity goods like Packed drinking water, food, safety kit to protect from Covid-19
like marks and sanitizer had increased with and results in increase in price and supply.
To protect consumers from high prices charges by supplier, UK government had enforced
price control policy in country. However, supplier are not restricted to sell goods above
certain price fixed by government for all goods in market (Hunklinger, and Ferch, 2020)
UK's government had work on the strategy to protect consumer interest and allow fair trading of
goods by suppliers in market. Necessity goods like food, suppliers are charging high prices in
market to earn more revenue while government implied price policy for protecting consumer by
fair trading policy by suppliers. It leads to balanced supply chain of food products with fixed
prices.2. Availability of resources: Covid-19 pandemic leads to unavailability of resources, UK
supply chain had highly suffered from pandemic due to lack of resource availability.
Food supplier had to face many problems in order to fulfil consumer demand for food in
market. During lock-down, consumer demand had increased in faster rate which results
in lack of food availability. On the other hand, non-durable food items like fruits and
vegetables are damage before reaching to consumer (Dean, and et.al., 2020). However,
shortage of food in medium term and short-term food supply chain due to high
dependency globally. It is affected on UK's government Covid-19 due to unstable
economy of country which directly impact food supply chain. UK's dependency on food
is on other countries by which import is being decrease and lead to unavailability of food
as UK is dependent on other countries for food through imports.3. Taxation: Government had reduced the taxes in almost all field of operation due to
impact of Covid-19. The UK economy is falling after the pandemic as it almost affected
the working cycle of country. The taxes are reduces to increase the consumers spending
and increase the investment by consumers in country to bring back the economy at
inflation point. Taxes on food chain is being reduced highly to maintain the price of food
products low, that can be afforded by each UK citizen. To increase he supply chains of
food, government reduce taxes and provide subsidies to motivate supplies to maintain the
food supply in market and meet the demand of consumers during pandemic. Consumers
demand had increase rapidly during the lock down in country, suppliers are unable to
maintain the supply of food in market. Though, government initiated with suppliers to
maintain the flow of supply chain and meet the consumer demand (Ghadge, and et.al.,
2020).4. Other social welfare strategies: government and other NGO and institutions are working
during the Lock down In country for providing food and packaged water bottles to poor
people and other who are unavailable to purchase goods or can sustain during the
pandemic. NGO volunteers are working with the help of government to maintain the life
of those who are unable to meet their necessary items from earning. Those people are
provided with food, water and some other essential items that is necessary at time to
sustain the pandemic.
5. Fiscal Policy: For maintain the economic condition, UK government had being using
automatic fiscal stabilizer to balance economic shocks and alteration of demand and
supply. To determinant economic stabilizer, government absorb risk of income and
people crises faced by each household and firms during pandemic. The effect of
pandemic cause high unemployment in country, recession which is stabilized through tax
payment decline by government or benefits on payment. High rate of unemployment in
country leads to housing and some other benefit's payment kick-off with 10-15%. It also
affects the aggregate demand and aggregate supply of food chain when there is a change
in fiscal policy of UK government. High Demand by consumers during Covid-19 but
insufficient supply of food are available to consumers to meet basic demand.
⊘ This is a preview!⊘
Do you want full access?
Subscribe today to unlock all pages.
Trusted by 1+ million students worldwide
1 out of 15
Related Documents


Your All-in-One AI-Powered Toolkit for Academic Success.
+13062052269
info@desklib.com
Available 24*7 on WhatsApp / Email
![[object Object]](/_next/static/media/star-bottom.7253800d.svg)
Unlock your academic potential
Copyright © 2020–2026 A2Z Services. All Rights Reserved. Developed and managed by ZUCOL.