Report: Profit Distribution and Performance of UK Food Manufacturers
VerifiedAdded on 2020/10/22
|13
|3636
|102
Report
AI Summary
This individual report provides a detailed analysis of the UK food manufacturing sector, examining various aspects of profitability and performance. The report begins with an introduction to data analysis and its application in understanding the food manufacturing sector. It analyzes profit distribution across organizations, comparing profit margins between SMEs and large companies, and evaluating return on shareholder funds. The study also explores the distribution of profit rates based on business activity, comparing food manufacturers with those engaged in other business activities. Furthermore, it investigates the relationship between the main activity of food manufacturers and business size using cross-tabulation. The analysis employs descriptive statistics, histograms, hypothesis tests, cross-tab analysis, correlation analysis, and bivariate regression to derive insights. The report concludes with a summary of findings and references used throughout the analysis.

INDIVIDUAL REPORT
Paraphrase This Document
Need a fresh take? Get an instant paraphrase of this document with our AI Paraphraser
TABLE OF CONTENTS
INTRODUCTION...........................................................................................................................1
A. Analysis of profit distribution across every organization..................................................1
B. Analysis of distribution of profit rate as compared to large and SME..............................2
C. Analysis of distribution of Return to shareholder funds as compared to large and SME food
manufacturers.........................................................................................................................3
D. Analysis of distribution of profit rate comparing with food manufacturers with type of
activity....................................................................................................................................5
E. Analysis of main activity of food manufacturer with reference to size of business..........6
F. Analysis of profit rate of all manufacturer associated with other quantitative variable....6
G. Analysing credit limit offered to UK food manufacturers with other quantitative variables.8
CONCLUSION................................................................................................................................8
REFERENCES................................................................................................................................9
APPENDICES...............................................................................................................................10
A...........................................................................................................................................10
E............................................................................................................................................10
G...........................................................................................................................................11
INTRODUCTION
Data analysis is considered as process of transforming, inspecting, modelling and cleansing
data with main objective for discovering important information, to support decision making
along with giving conclusion. The present report will discuss about food manufacturers who are
operating in United Kingdom along with consistent data on multiple variables. The main purpose
of this analysis is on basis of understanding food manufacturing sector to target future
investment. The variables of this data set are profit margin, number of employees, cost of
production, salaries as percentage turnover, credit limit, return on shareholders fund, business
activity, exporter and type of company. In this analysis, there will be implication of descriptive
statistics, histograms, hypothesis tests, cross tab analysis, correlation analysis and bivariate
regression with appropriate explanation.
A. Analysis of profit distribution across every organization
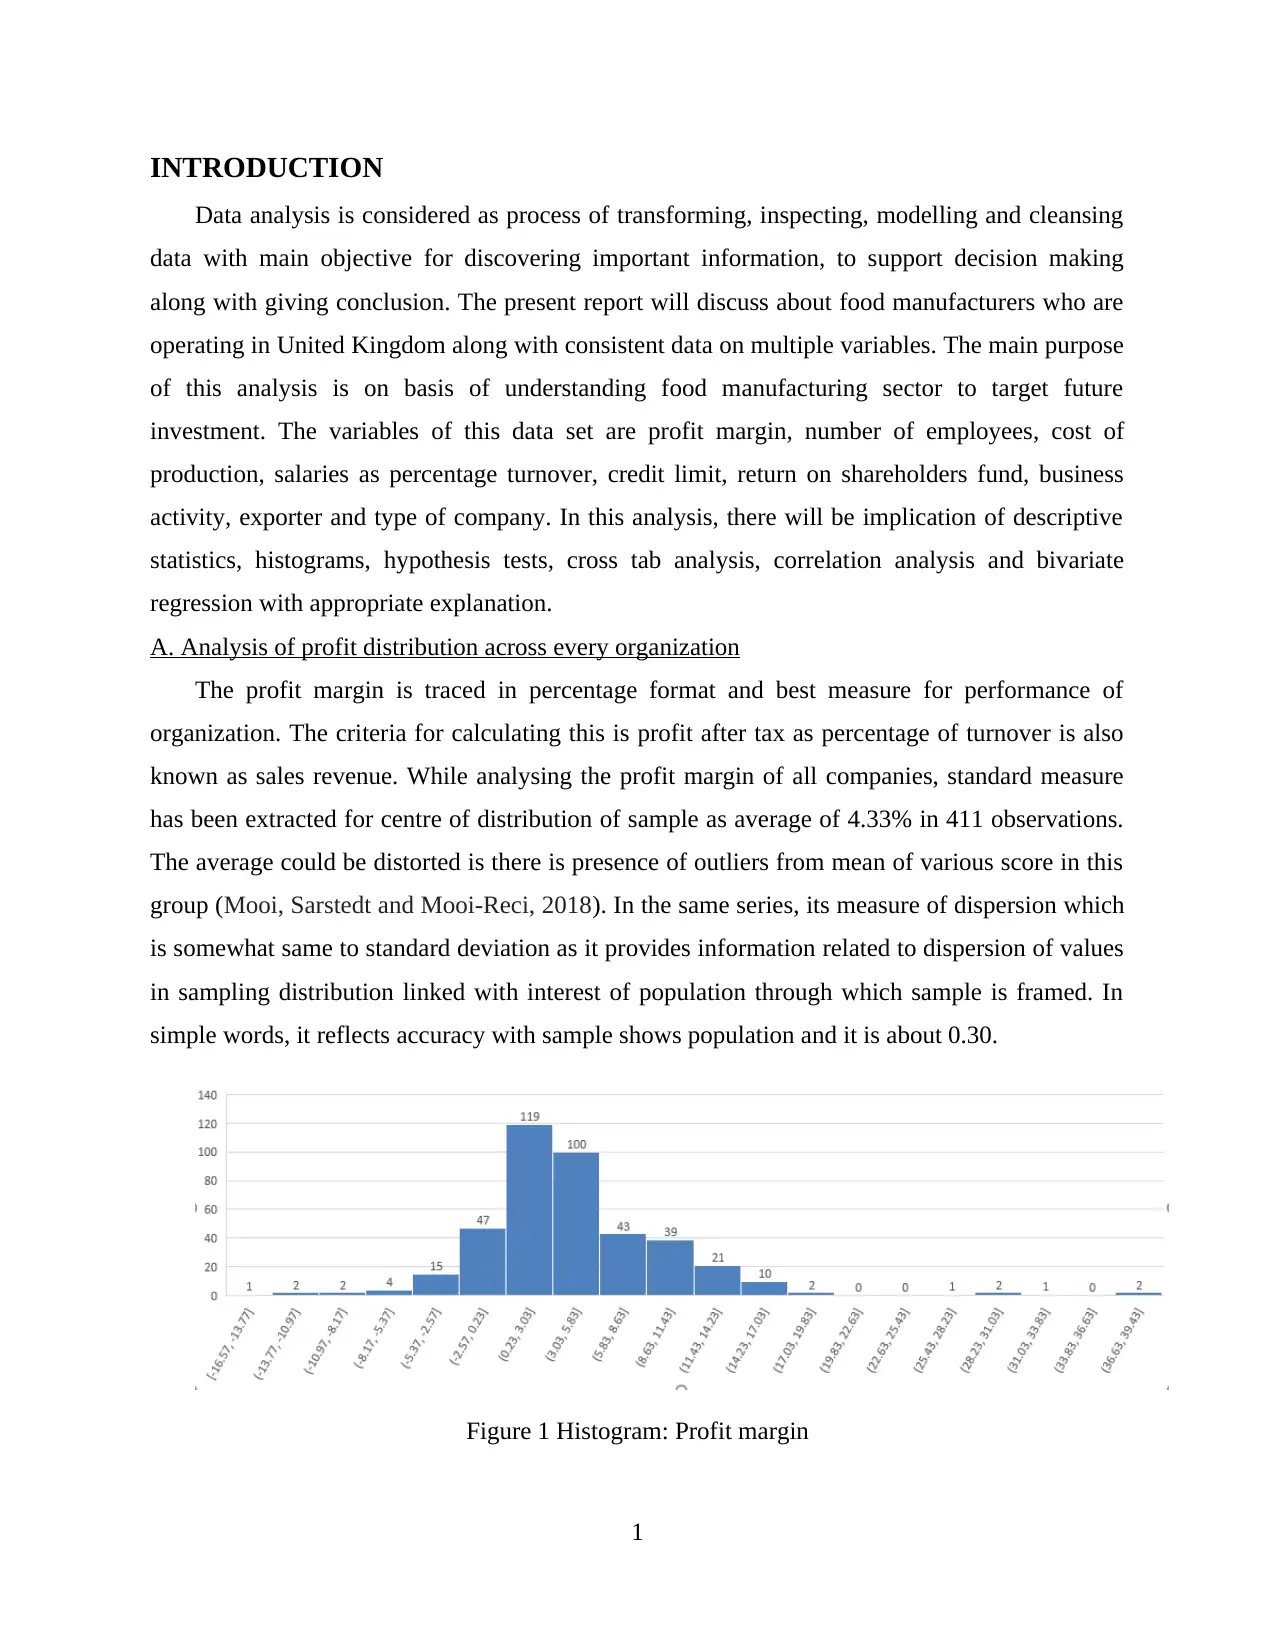
The profit margin is traced in percentage format and best measure for performance of
organization. The criteria for calculating this is profit after tax as percentage of turnover is also
known as sales revenue. While analysing the profit margin of all companies, standard measure
has been extracted for centre of distribution of sample as average of 4.33% in 411 observations.
The average could be distorted is there is presence of outliers from mean of various score in this
group (Mooi, Sarstedt and Mooi-Reci, 2018). In the same series, its measure of dispersion which
is somewhat same to standard deviation as it provides information related to dispersion of values
in sampling distribution linked with interest of population through which sample is framed. In
simple words, it reflects accuracy with sample shows population and it is about 0.30.
Figure 1 Histogram: Profit margin
1
Data analysis is considered as process of transforming, inspecting, modelling and cleansing
data with main objective for discovering important information, to support decision making
along with giving conclusion. The present report will discuss about food manufacturers who are
operating in United Kingdom along with consistent data on multiple variables. The main purpose
of this analysis is on basis of understanding food manufacturing sector to target future
investment. The variables of this data set are profit margin, number of employees, cost of
production, salaries as percentage turnover, credit limit, return on shareholders fund, business
activity, exporter and type of company. In this analysis, there will be implication of descriptive
statistics, histograms, hypothesis tests, cross tab analysis, correlation analysis and bivariate
regression with appropriate explanation.
A. Analysis of profit distribution across every organization
The profit margin is traced in percentage format and best measure for performance of
organization. The criteria for calculating this is profit after tax as percentage of turnover is also
known as sales revenue. While analysing the profit margin of all companies, standard measure
has been extracted for centre of distribution of sample as average of 4.33% in 411 observations.
The average could be distorted is there is presence of outliers from mean of various score in this
group (Mooi, Sarstedt and Mooi-Reci, 2018). In the same series, its measure of dispersion which
is somewhat same to standard deviation as it provides information related to dispersion of values
in sampling distribution linked with interest of population through which sample is framed. In
simple words, it reflects accuracy with sample shows population and it is about 0.30.
Figure 1 Histogram: Profit margin
1
⊘ This is a preview!⊘
Do you want full access?
Subscribe today to unlock all pages.
Trusted by 1+ million students worldwide
Median and mode are referred as other measure of central tendency as its median is 3.42
which is middle value on scale which divides scale in equal halves. Its mode is 0.81 which is
frequent score in this time scale. In the similar aspect, standard deviation by 5.93% which shows
range of scores or movement about mean in this distribution. The variance is average of squared
variation through mean as its outcome is 35.14. The kurtosis is 7.99 which indicates that
distribution has heavy tail and very sharp peak comparatively to normal distribution. The tail of
distribution is pointed towards right so value of skewness is 1.67. The difference on maximum
(39.23) and minimum (-16.57) value is range as 55.8 which reflects interval that consist of all
data values.
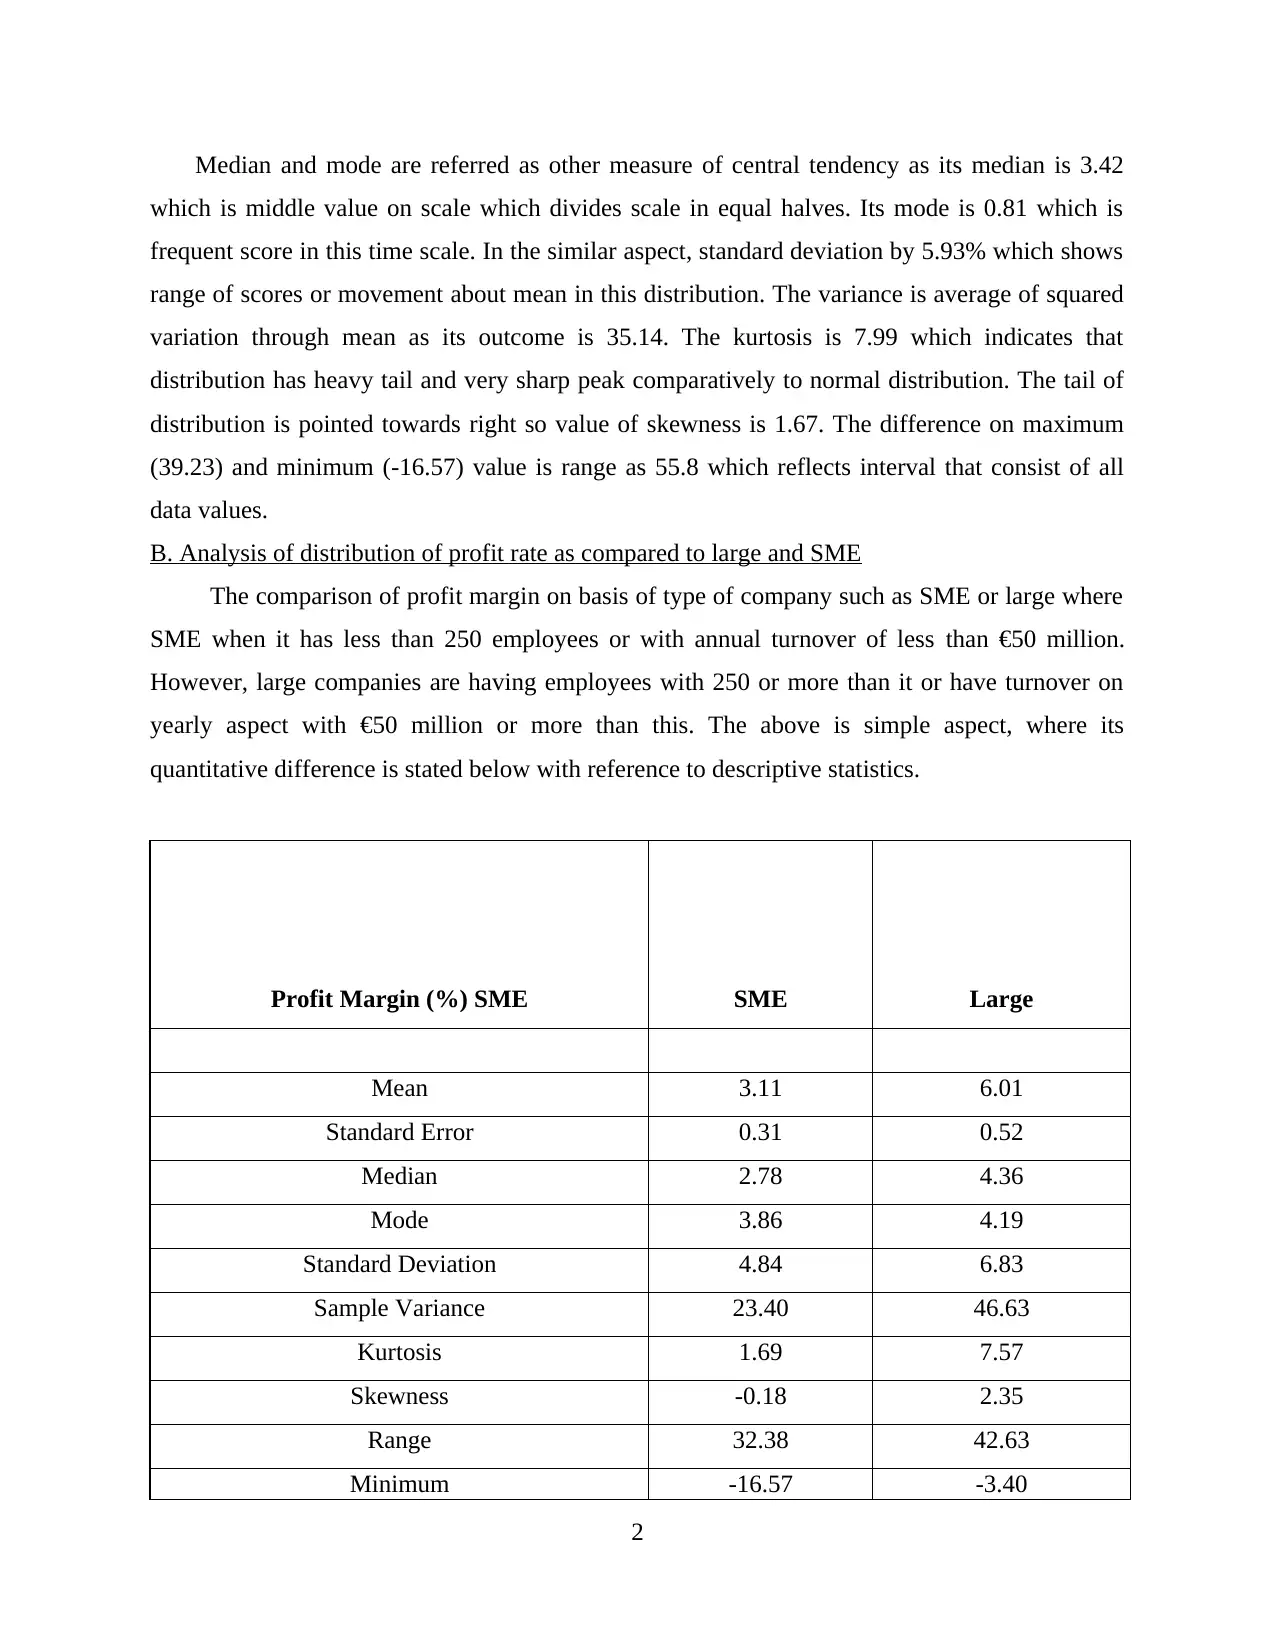
B. Analysis of distribution of profit rate as compared to large and SME
The comparison of profit margin on basis of type of company such as SME or large where
SME when it has less than 250 employees or with annual turnover of less than €50 million.
However, large companies are having employees with 250 or more than it or have turnover on
yearly aspect with €50 million or more than this. The above is simple aspect, where its
quantitative difference is stated below with reference to descriptive statistics.
Profit Margin (%) SME SME Large
Mean 3.11 6.01
Standard Error 0.31 0.52
Median 2.78 4.36
Mode 3.86 4.19
Standard Deviation 4.84 6.83
Sample Variance 23.40 46.63
Kurtosis 1.69 7.57
Skewness -0.18 2.35
Range 32.38 42.63
Minimum -16.57 -3.40
2
which is middle value on scale which divides scale in equal halves. Its mode is 0.81 which is
frequent score in this time scale. In the similar aspect, standard deviation by 5.93% which shows
range of scores or movement about mean in this distribution. The variance is average of squared
variation through mean as its outcome is 35.14. The kurtosis is 7.99 which indicates that
distribution has heavy tail and very sharp peak comparatively to normal distribution. The tail of
distribution is pointed towards right so value of skewness is 1.67. The difference on maximum
(39.23) and minimum (-16.57) value is range as 55.8 which reflects interval that consist of all
data values.
B. Analysis of distribution of profit rate as compared to large and SME
The comparison of profit margin on basis of type of company such as SME or large where
SME when it has less than 250 employees or with annual turnover of less than €50 million.
However, large companies are having employees with 250 or more than it or have turnover on
yearly aspect with €50 million or more than this. The above is simple aspect, where its
quantitative difference is stated below with reference to descriptive statistics.
Profit Margin (%) SME SME Large
Mean 3.11 6.01
Standard Error 0.31 0.52
Median 2.78 4.36
Mode 3.86 4.19
Standard Deviation 4.84 6.83
Sample Variance 23.40 46.63
Kurtosis 1.69 7.57
Skewness -0.18 2.35
Range 32.38 42.63
Minimum -16.57 -3.40
2
Paraphrase This Document
Need a fresh take? Get an instant paraphrase of this document with our AI Paraphraser
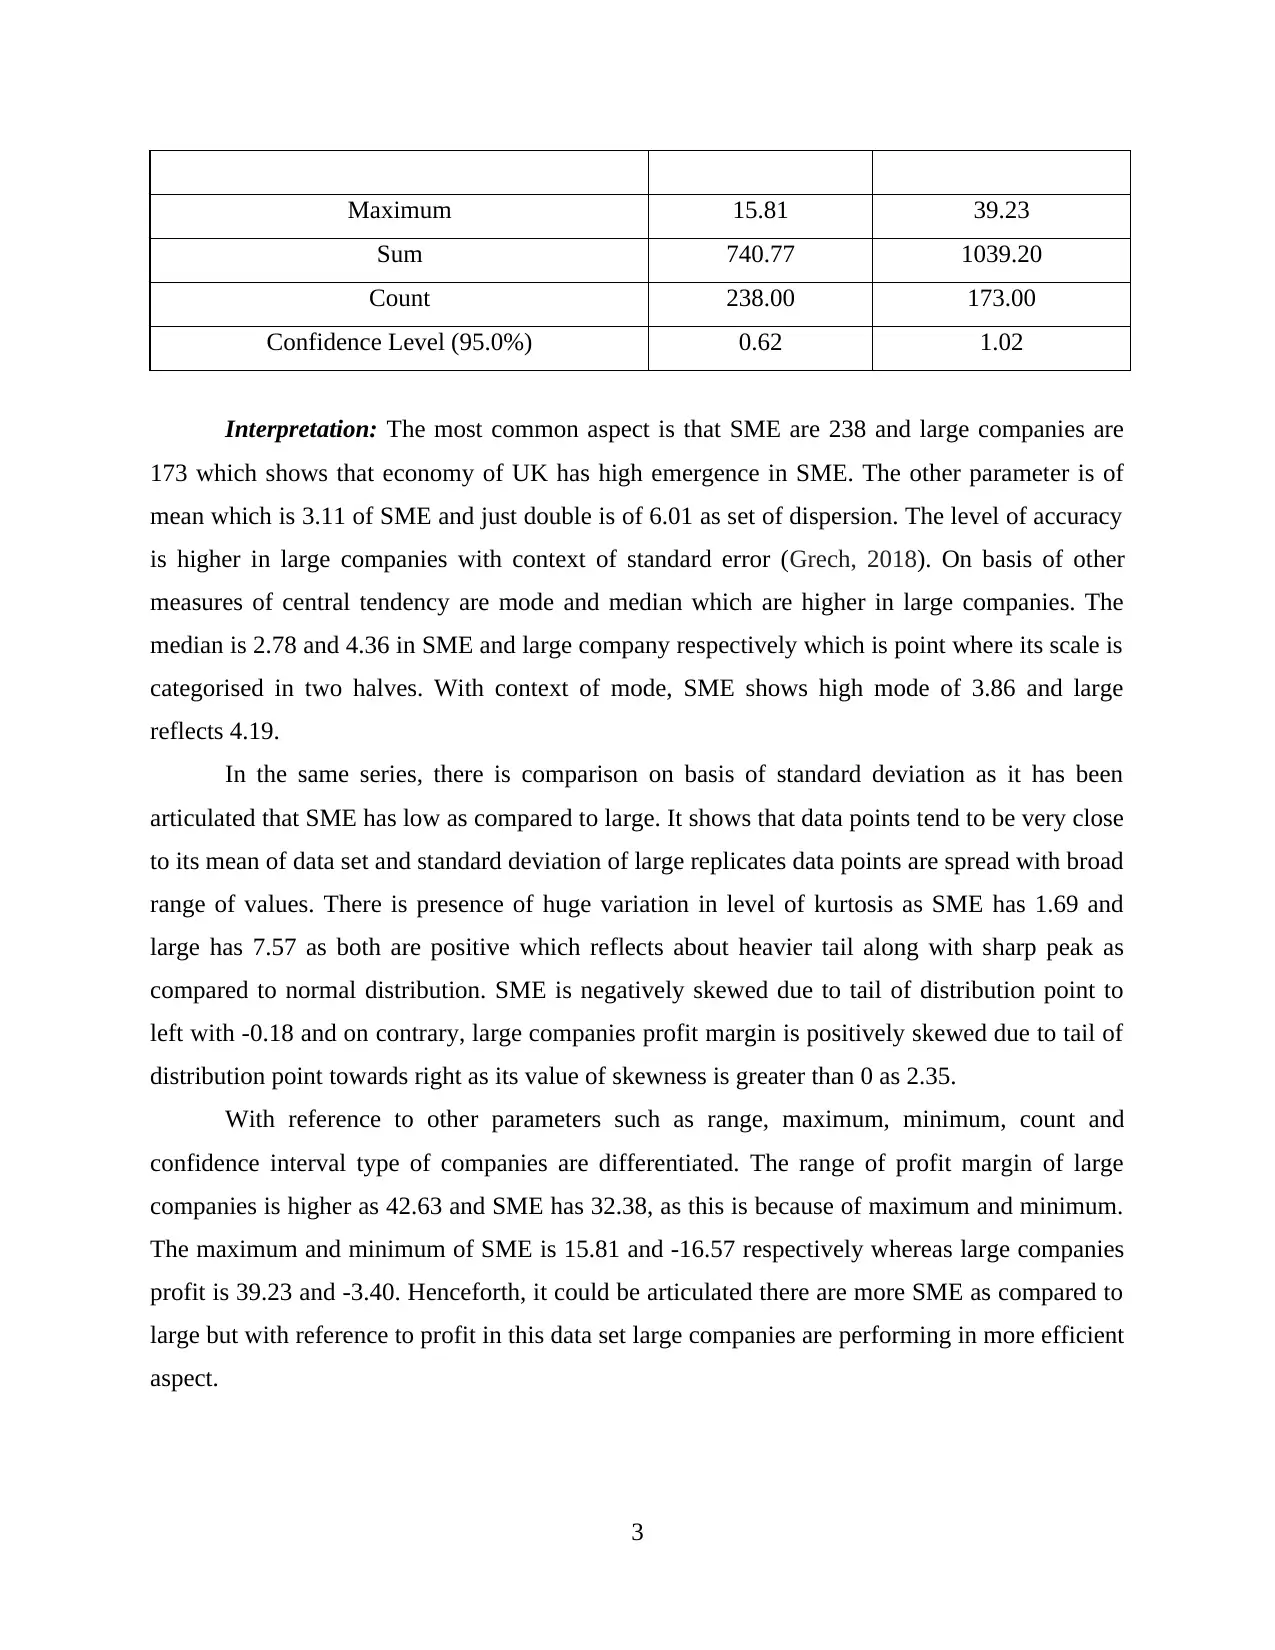
Maximum 15.81 39.23
Sum 740.77 1039.20
Count 238.00 173.00
Confidence Level (95.0%) 0.62 1.02
Interpretation: The most common aspect is that SME are 238 and large companies are
173 which shows that economy of UK has high emergence in SME. The other parameter is of
mean which is 3.11 of SME and just double is of 6.01 as set of dispersion. The level of accuracy
is higher in large companies with context of standard error (Grech, 2018). On basis of other
measures of central tendency are mode and median which are higher in large companies. The
median is 2.78 and 4.36 in SME and large company respectively which is point where its scale is
categorised in two halves. With context of mode, SME shows high mode of 3.86 and large
reflects 4.19.
In the same series, there is comparison on basis of standard deviation as it has been
articulated that SME has low as compared to large. It shows that data points tend to be very close
to its mean of data set and standard deviation of large replicates data points are spread with broad
range of values. There is presence of huge variation in level of kurtosis as SME has 1.69 and
large has 7.57 as both are positive which reflects about heavier tail along with sharp peak as
compared to normal distribution. SME is negatively skewed due to tail of distribution point to
left with -0.18 and on contrary, large companies profit margin is positively skewed due to tail of
distribution point towards right as its value of skewness is greater than 0 as 2.35.
With reference to other parameters such as range, maximum, minimum, count and
confidence interval type of companies are differentiated. The range of profit margin of large
companies is higher as 42.63 and SME has 32.38, as this is because of maximum and minimum.
The maximum and minimum of SME is 15.81 and -16.57 respectively whereas large companies
profit is 39.23 and -3.40. Henceforth, it could be articulated there are more SME as compared to
large but with reference to profit in this data set large companies are performing in more efficient
aspect.
3
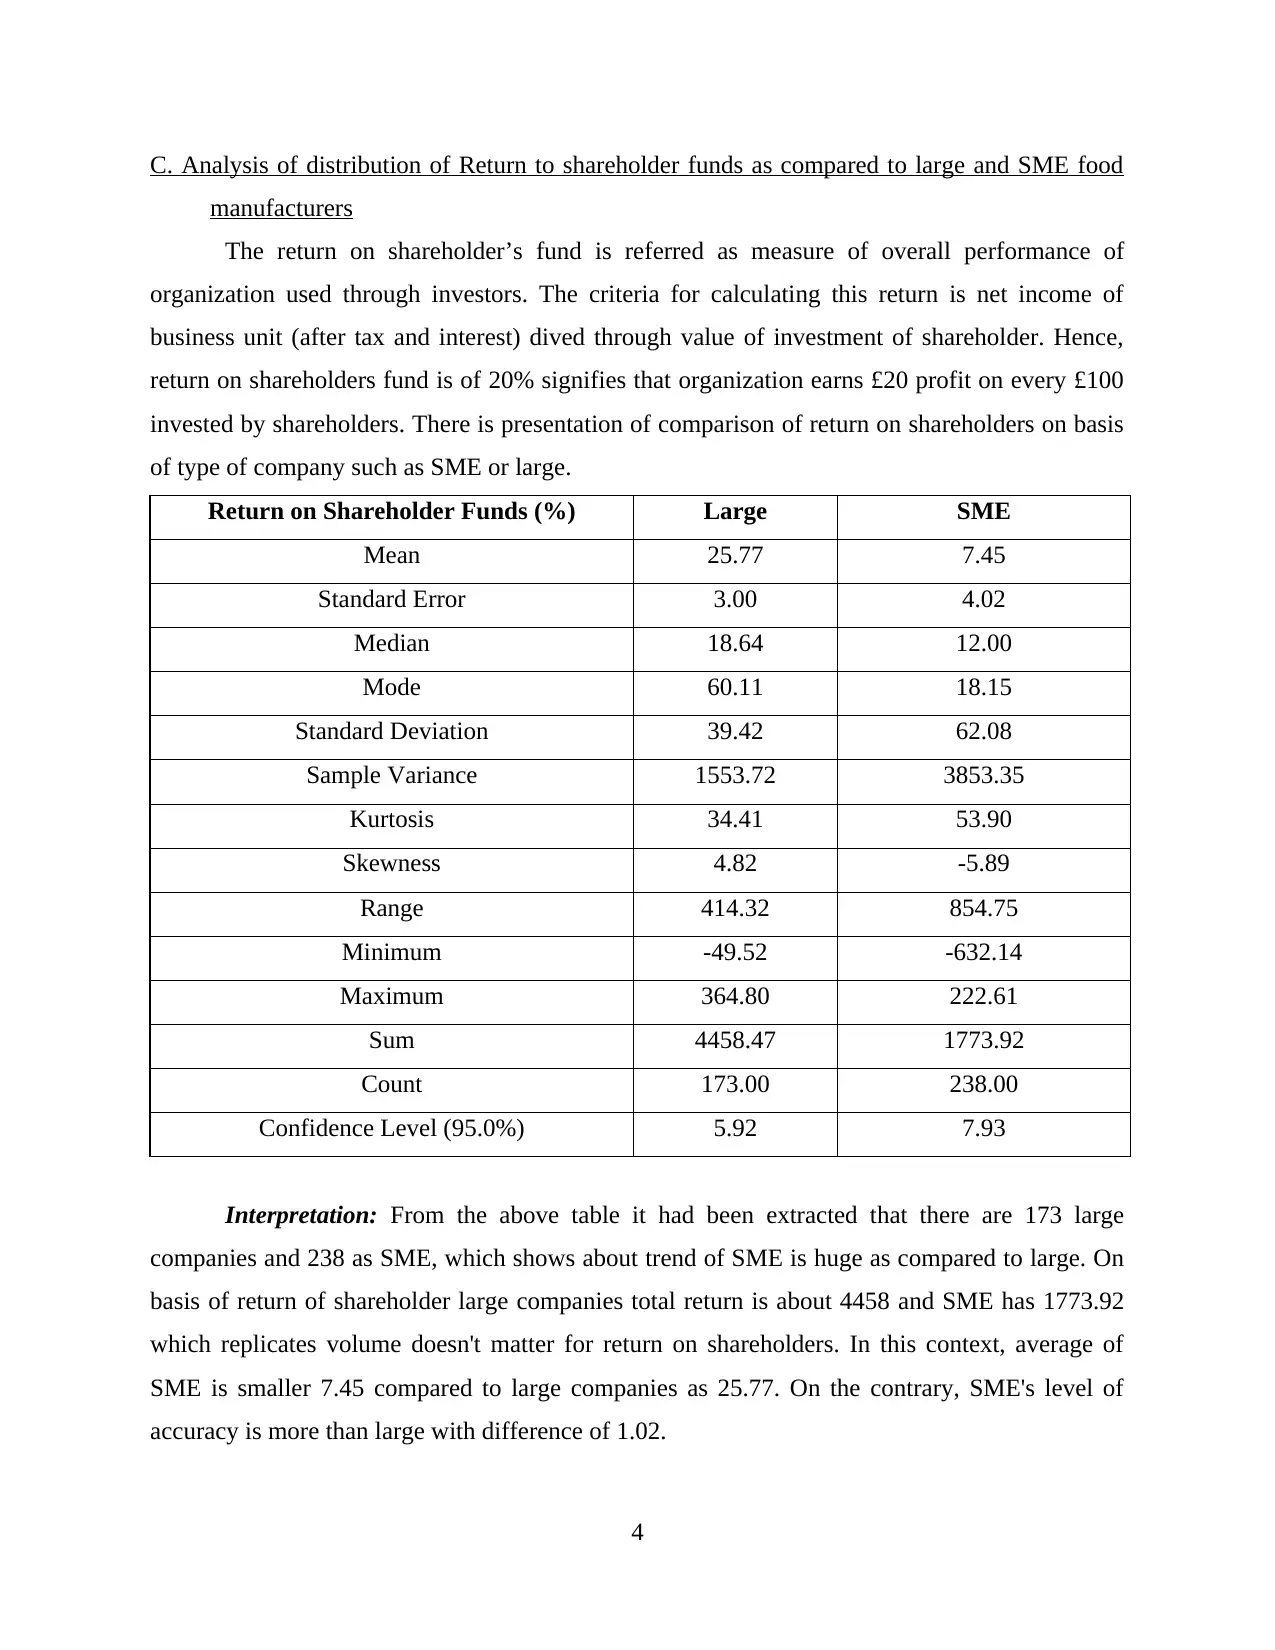
C. Analysis of distribution of Return to shareholder funds as compared to large and SME food
manufacturers
The return on shareholder’s fund is referred as measure of overall performance of
organization used through investors. The criteria for calculating this return is net income of
business unit (after tax and interest) dived through value of investment of shareholder. Hence,
return on shareholders fund is of 20% signifies that organization earns £20 profit on every £100
invested by shareholders. There is presentation of comparison of return on shareholders on basis
of type of company such as SME or large.
Return on Shareholder Funds (%) Large SME
Mean 25.77 7.45
Standard Error 3.00 4.02
Median 18.64 12.00
Mode 60.11 18.15
Standard Deviation 39.42 62.08
Sample Variance 1553.72 3853.35
Kurtosis 34.41 53.90
Skewness 4.82 -5.89
Range 414.32 854.75
Minimum -49.52 -632.14
Maximum 364.80 222.61
Sum 4458.47 1773.92
Count 173.00 238.00
Confidence Level (95.0%) 5.92 7.93
Interpretation: From the above table it had been extracted that there are 173 large
companies and 238 as SME, which shows about trend of SME is huge as compared to large. On
basis of return of shareholder large companies total return is about 4458 and SME has 1773.92
which replicates volume doesn't matter for return on shareholders. In this context, average of
SME is smaller 7.45 compared to large companies as 25.77. On the contrary, SME's level of
accuracy is more than large with difference of 1.02.
4
⊘ This is a preview!⊘
Do you want full access?
Subscribe today to unlock all pages.
Trusted by 1+ million students worldwide
As mean, mode and median and referred as measure of central tendency as in these types
of companies as far variation among both as 60.11 is of large and 18.15 is of SME. Furthermore,
standard deviation helps in quantifying amount of variation or dispersion of set of multiple data
values (Popoola and et.al., 2018). In this aspect, large companies have risk of movement of 39.42
and SME has 62.08 far from the mean of dataset related to return on shareholders fund. While
measuring kurtosis, peakedness of distribution is measured of both SME and large where both
type of companies has positive outcome with heavier tail and sharp peak to normal distribution.
The value of skewness could be positive or negative where SME's return is negatively
skewed whose mean is left to the peak and large company's return is positively skewed as with
right skewed distribution. On basis of maximum and minimum, range is based with large and
SME of maximum and minimum return of shareholder and this all information is based on 95%
confidence interval of 5.92 in large and 7.93 in SME.
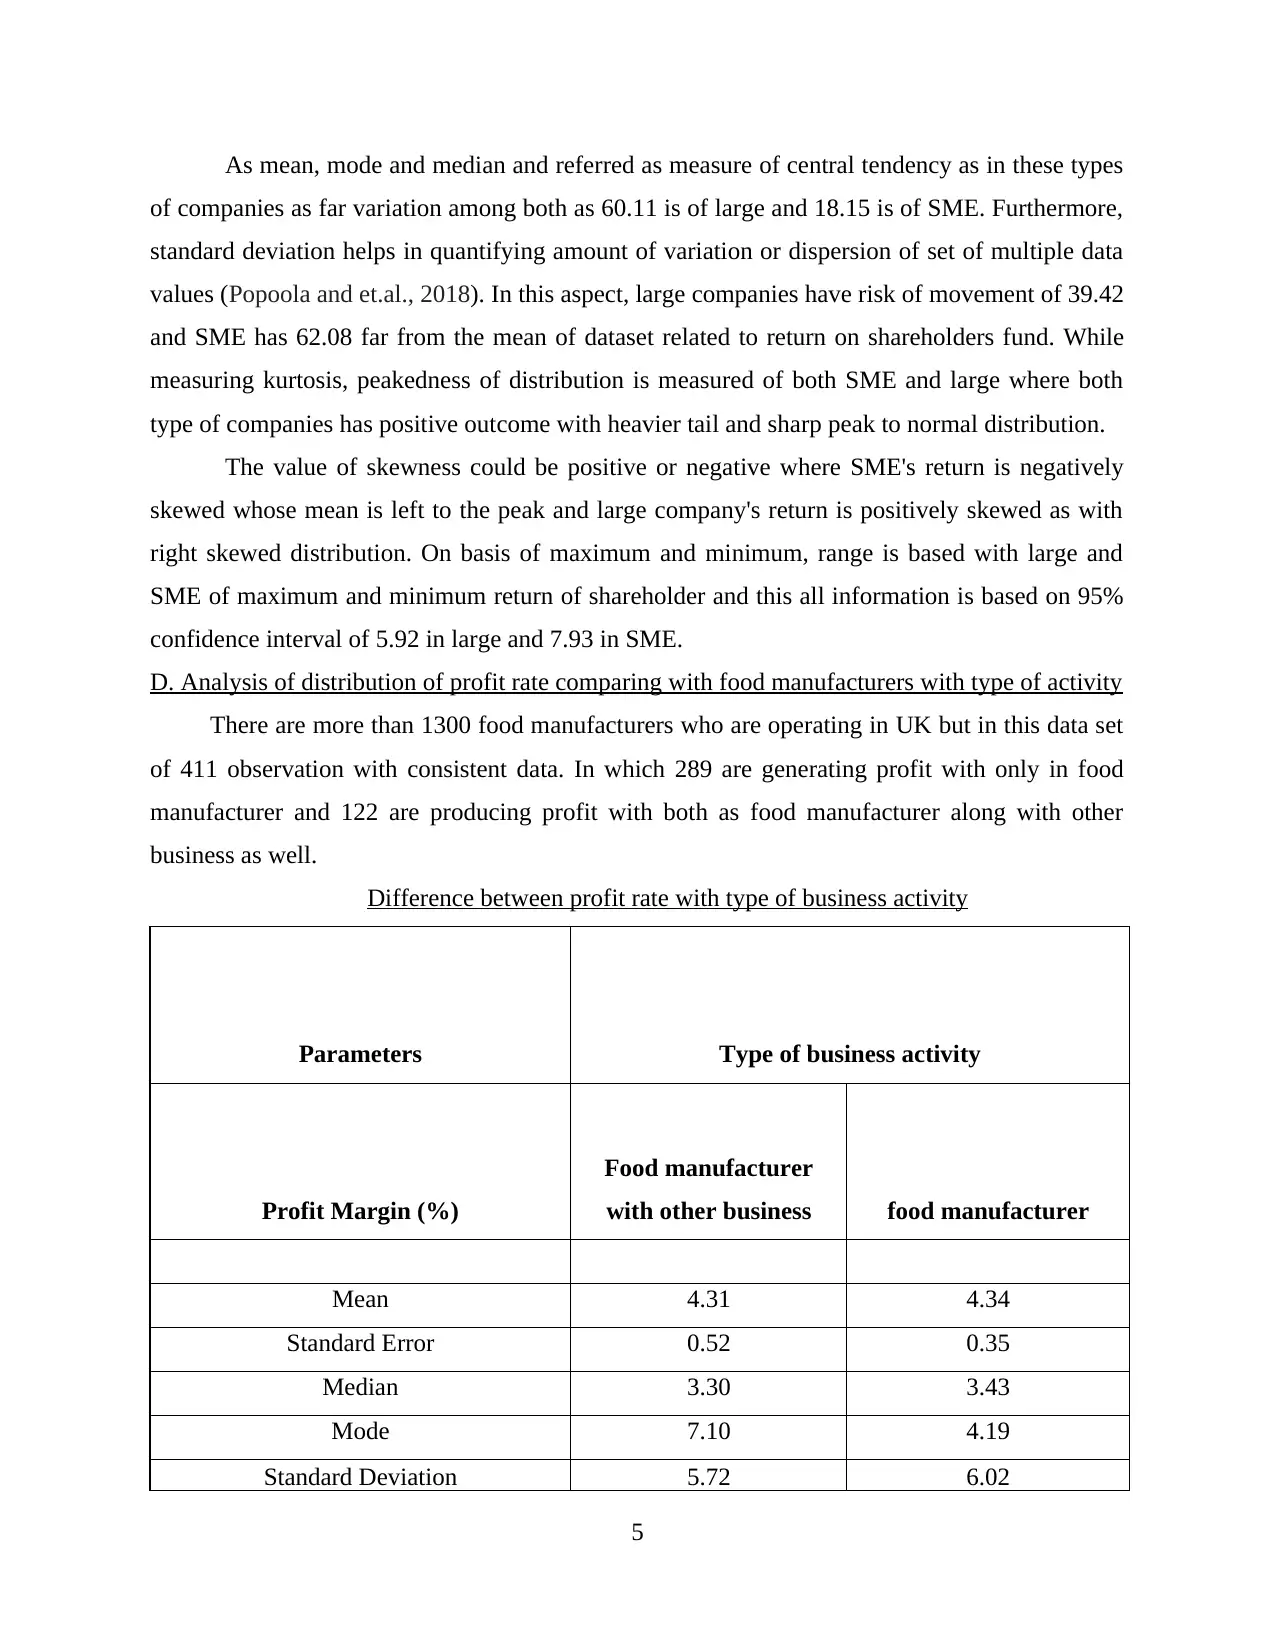
D. Analysis of distribution of profit rate comparing with food manufacturers with type of activity
There are more than 1300 food manufacturers who are operating in UK but in this data set
of 411 observation with consistent data. In which 289 are generating profit with only in food
manufacturer and 122 are producing profit with both as food manufacturer along with other
business as well.
Difference between profit rate with type of business activity
Parameters Type of business activity
Profit Margin (%)
Food manufacturer
with other business food manufacturer
Mean 4.31 4.34
Standard Error 0.52 0.35
Median 3.30 3.43
Mode 7.10 4.19
Standard Deviation 5.72 6.02
5
of companies as far variation among both as 60.11 is of large and 18.15 is of SME. Furthermore,
standard deviation helps in quantifying amount of variation or dispersion of set of multiple data
values (Popoola and et.al., 2018). In this aspect, large companies have risk of movement of 39.42
and SME has 62.08 far from the mean of dataset related to return on shareholders fund. While
measuring kurtosis, peakedness of distribution is measured of both SME and large where both
type of companies has positive outcome with heavier tail and sharp peak to normal distribution.
The value of skewness could be positive or negative where SME's return is negatively
skewed whose mean is left to the peak and large company's return is positively skewed as with
right skewed distribution. On basis of maximum and minimum, range is based with large and
SME of maximum and minimum return of shareholder and this all information is based on 95%
confidence interval of 5.92 in large and 7.93 in SME.
D. Analysis of distribution of profit rate comparing with food manufacturers with type of activity
There are more than 1300 food manufacturers who are operating in UK but in this data set
of 411 observation with consistent data. In which 289 are generating profit with only in food
manufacturer and 122 are producing profit with both as food manufacturer along with other
business as well.
Difference between profit rate with type of business activity
Parameters Type of business activity
Profit Margin (%)
Food manufacturer
with other business food manufacturer
Mean 4.31 4.34
Standard Error 0.52 0.35
Median 3.30 3.43
Mode 7.10 4.19
Standard Deviation 5.72 6.02
5
Paraphrase This Document
Need a fresh take? Get an instant paraphrase of this document with our AI Paraphraser
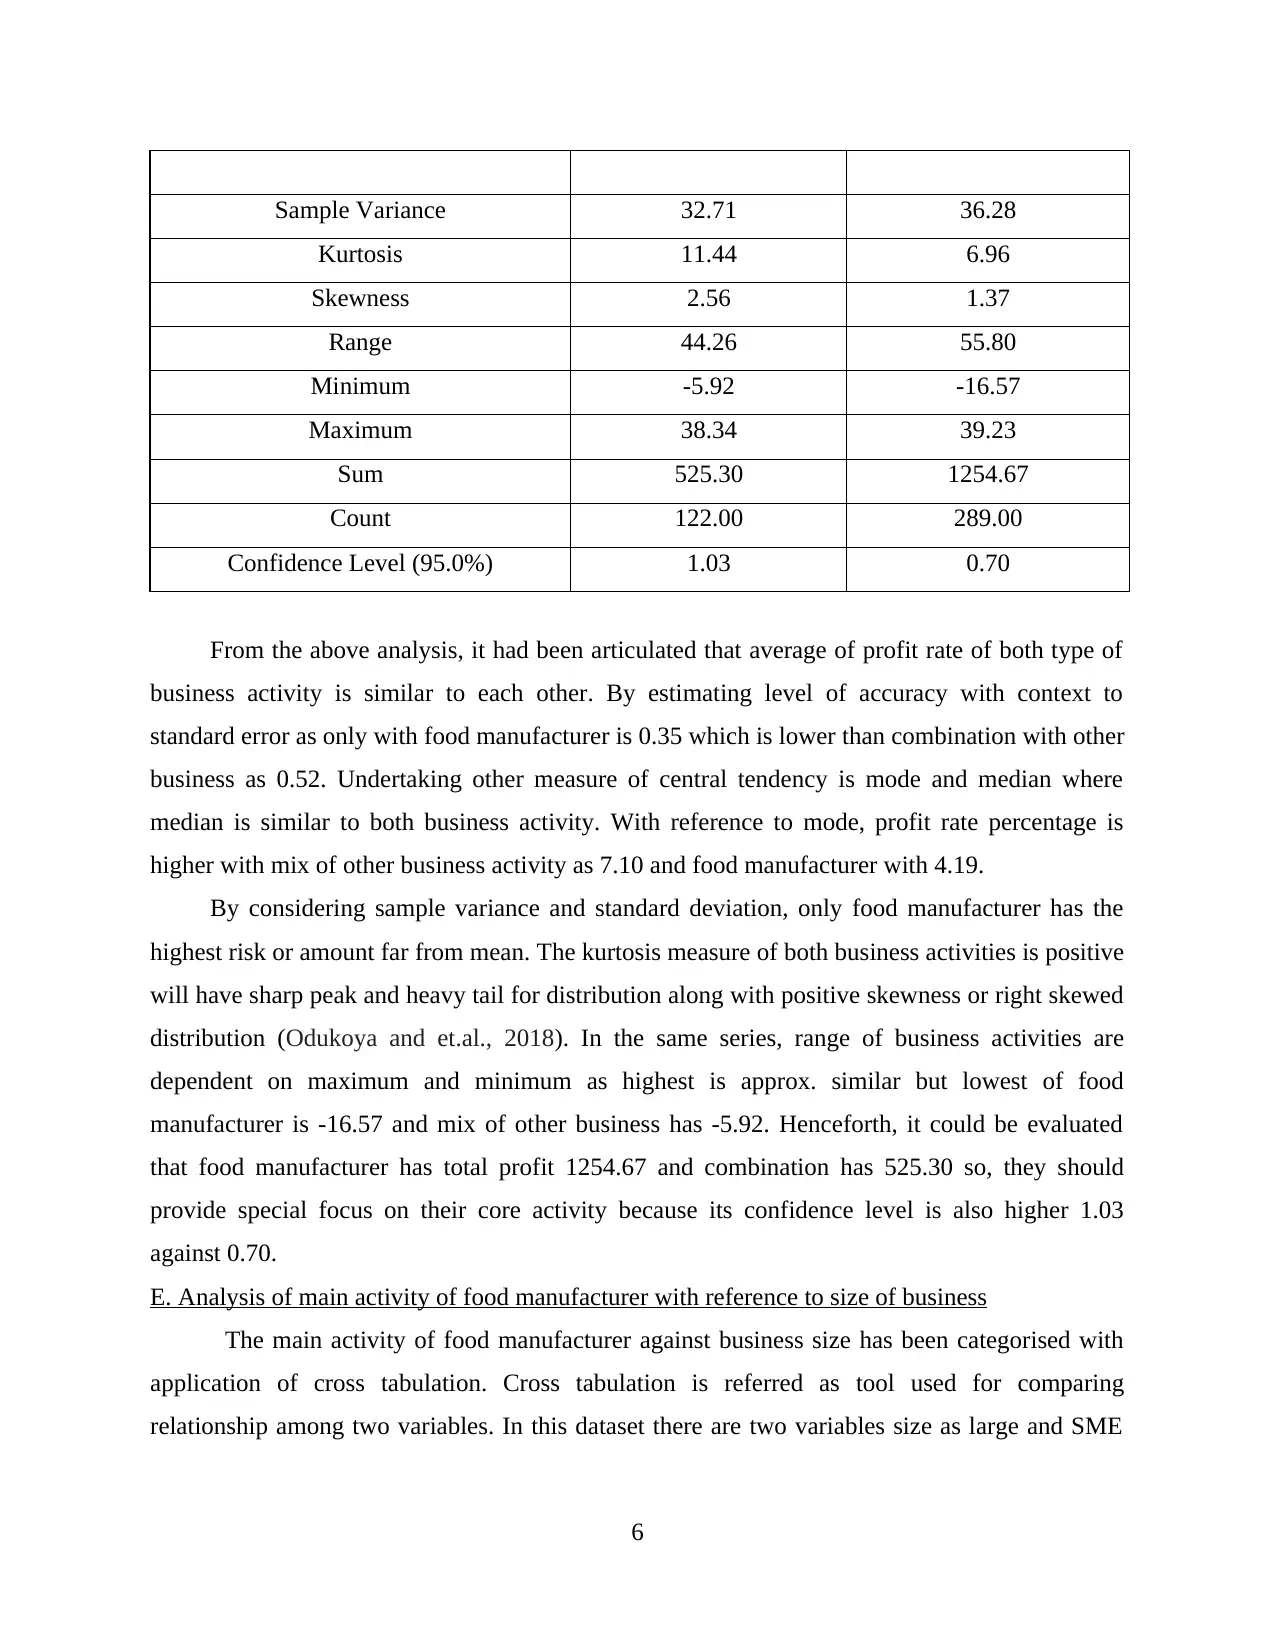
Sample Variance 32.71 36.28
Kurtosis 11.44 6.96
Skewness 2.56 1.37
Range 44.26 55.80
Minimum -5.92 -16.57
Maximum 38.34 39.23
Sum 525.30 1254.67
Count 122.00 289.00
Confidence Level (95.0%) 1.03 0.70
From the above analysis, it had been articulated that average of profit rate of both type of
business activity is similar to each other. By estimating level of accuracy with context to
standard error as only with food manufacturer is 0.35 which is lower than combination with other
business as 0.52. Undertaking other measure of central tendency is mode and median where
median is similar to both business activity. With reference to mode, profit rate percentage is
higher with mix of other business activity as 7.10 and food manufacturer with 4.19.
By considering sample variance and standard deviation, only food manufacturer has the
highest risk or amount far from mean. The kurtosis measure of both business activities is positive
will have sharp peak and heavy tail for distribution along with positive skewness or right skewed
distribution (Odukoya and et.al., 2018). In the same series, range of business activities are
dependent on maximum and minimum as highest is approx. similar but lowest of food
manufacturer is -16.57 and mix of other business has -5.92. Henceforth, it could be evaluated
that food manufacturer has total profit 1254.67 and combination has 525.30 so, they should
provide special focus on their core activity because its confidence level is also higher 1.03
against 0.70.
E. Analysis of main activity of food manufacturer with reference to size of business
The main activity of food manufacturer against business size has been categorised with
application of cross tabulation. Cross tabulation is referred as tool used for comparing
relationship among two variables. In this dataset there are two variables size as large and SME
6
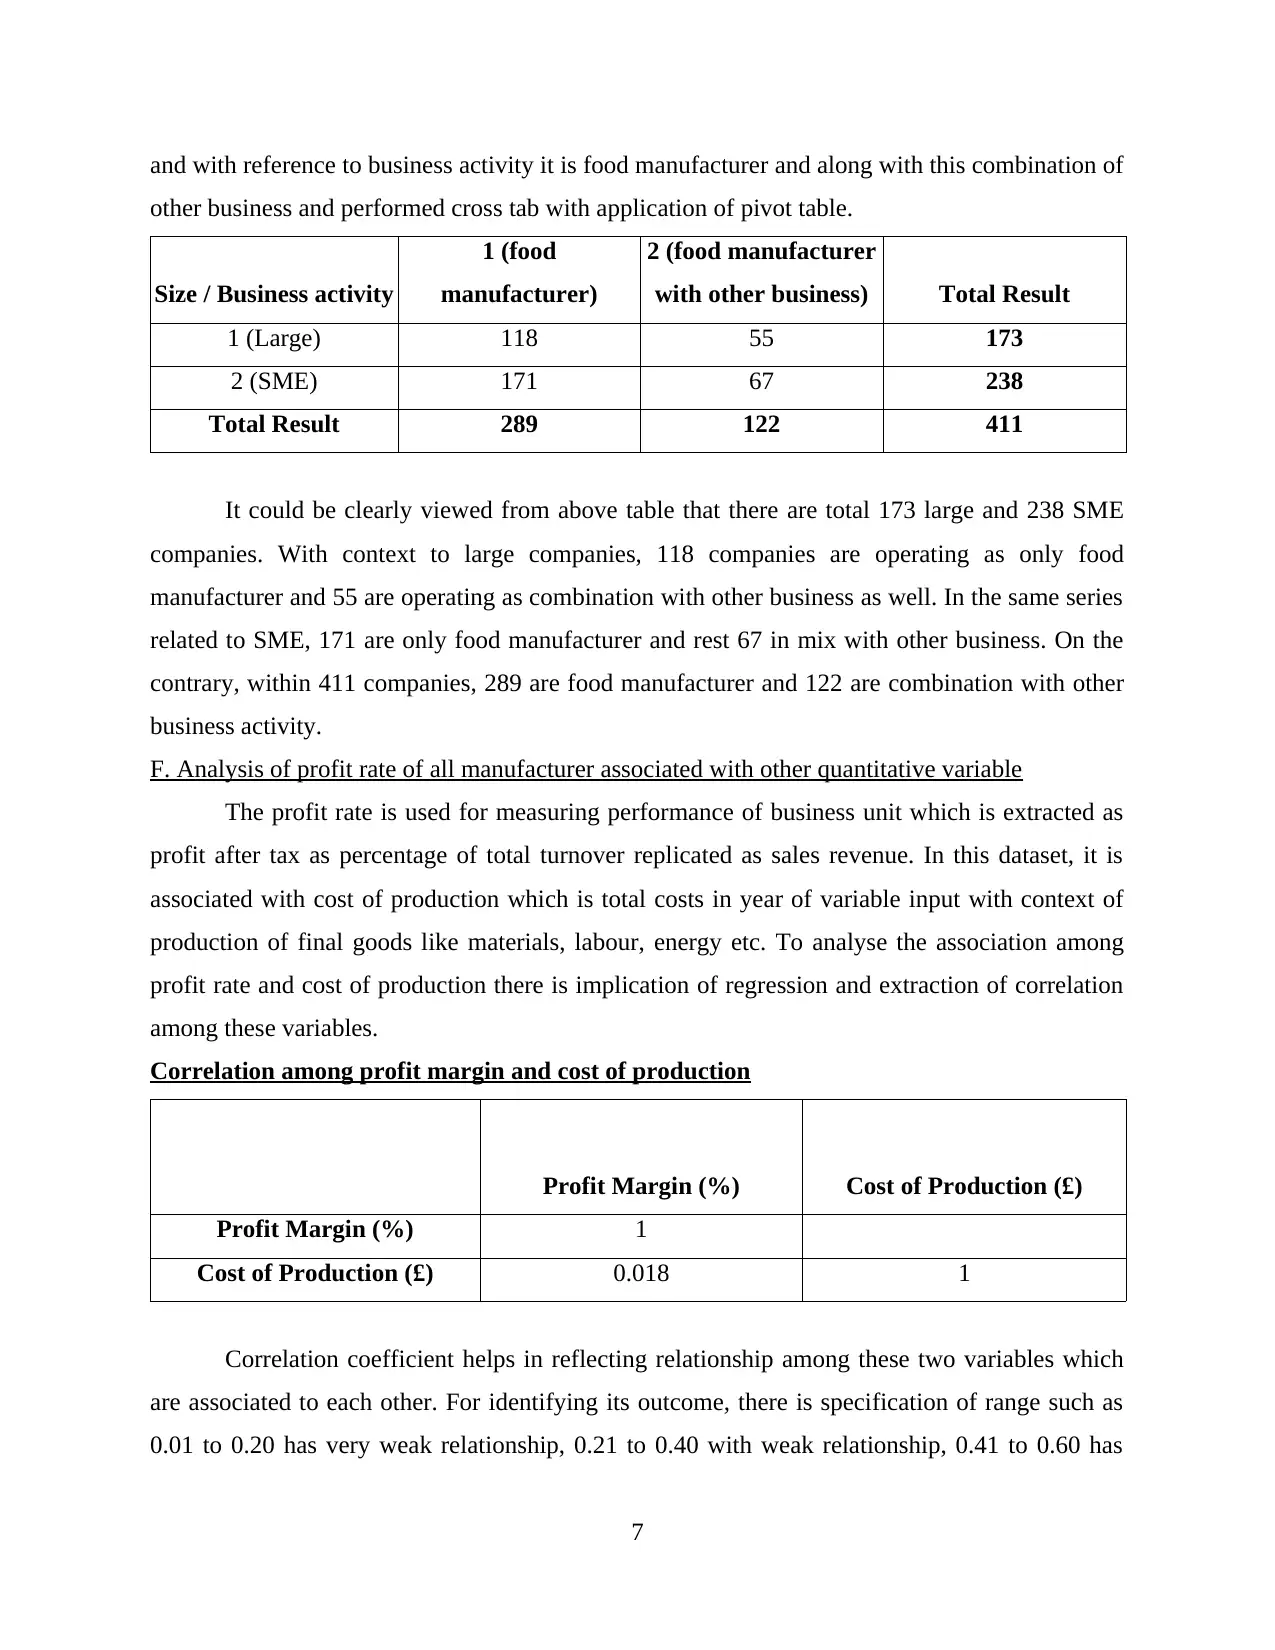
and with reference to business activity it is food manufacturer and along with this combination of
other business and performed cross tab with application of pivot table.
Size / Business activity
1 (food
manufacturer)
2 (food manufacturer
with other business) Total Result
1 (Large) 118 55 173
2 (SME) 171 67 238
Total Result 289 122 411
It could be clearly viewed from above table that there are total 173 large and 238 SME
companies. With context to large companies, 118 companies are operating as only food
manufacturer and 55 are operating as combination with other business as well. In the same series
related to SME, 171 are only food manufacturer and rest 67 in mix with other business. On the
contrary, within 411 companies, 289 are food manufacturer and 122 are combination with other
business activity.
F. Analysis of profit rate of all manufacturer associated with other quantitative variable
The profit rate is used for measuring performance of business unit which is extracted as
profit after tax as percentage of total turnover replicated as sales revenue. In this dataset, it is
associated with cost of production which is total costs in year of variable input with context of
production of final goods like materials, labour, energy etc. To analyse the association among
profit rate and cost of production there is implication of regression and extraction of correlation
among these variables.
Correlation among profit margin and cost of production
Profit Margin (%) Cost of Production (£)
Profit Margin (%) 1
Cost of Production (£) 0.018 1
Correlation coefficient helps in reflecting relationship among these two variables which
are associated to each other. For identifying its outcome, there is specification of range such as
0.01 to 0.20 has very weak relationship, 0.21 to 0.40 with weak relationship, 0.41 to 0.60 has
7
⊘ This is a preview!⊘
Do you want full access?
Subscribe today to unlock all pages.
Trusted by 1+ million students worldwide
moderate relationship, 0.61 to 0.80 with very strong relationship and 0.80 to 0.99 with very
strong relationship. With application of correlation in profit margin and cost of production is
0.018 which underlies in 1st category of 0.01 to 0.20 with very weak relationship. In simple
words, it could be stated that cost of production and profit margin are not correlated and does not
have relationship (Delgado-Aguilar, Valverde-Som and Cuadros-Rodríguez, 2018).
Regression among profit margin and cost of production
Null hypothesis: H0: There is no significant relationship in profit margin and cost of
production.
Alternative hypothesis: H1: There is significant relationship in profit margin and cost of
production.
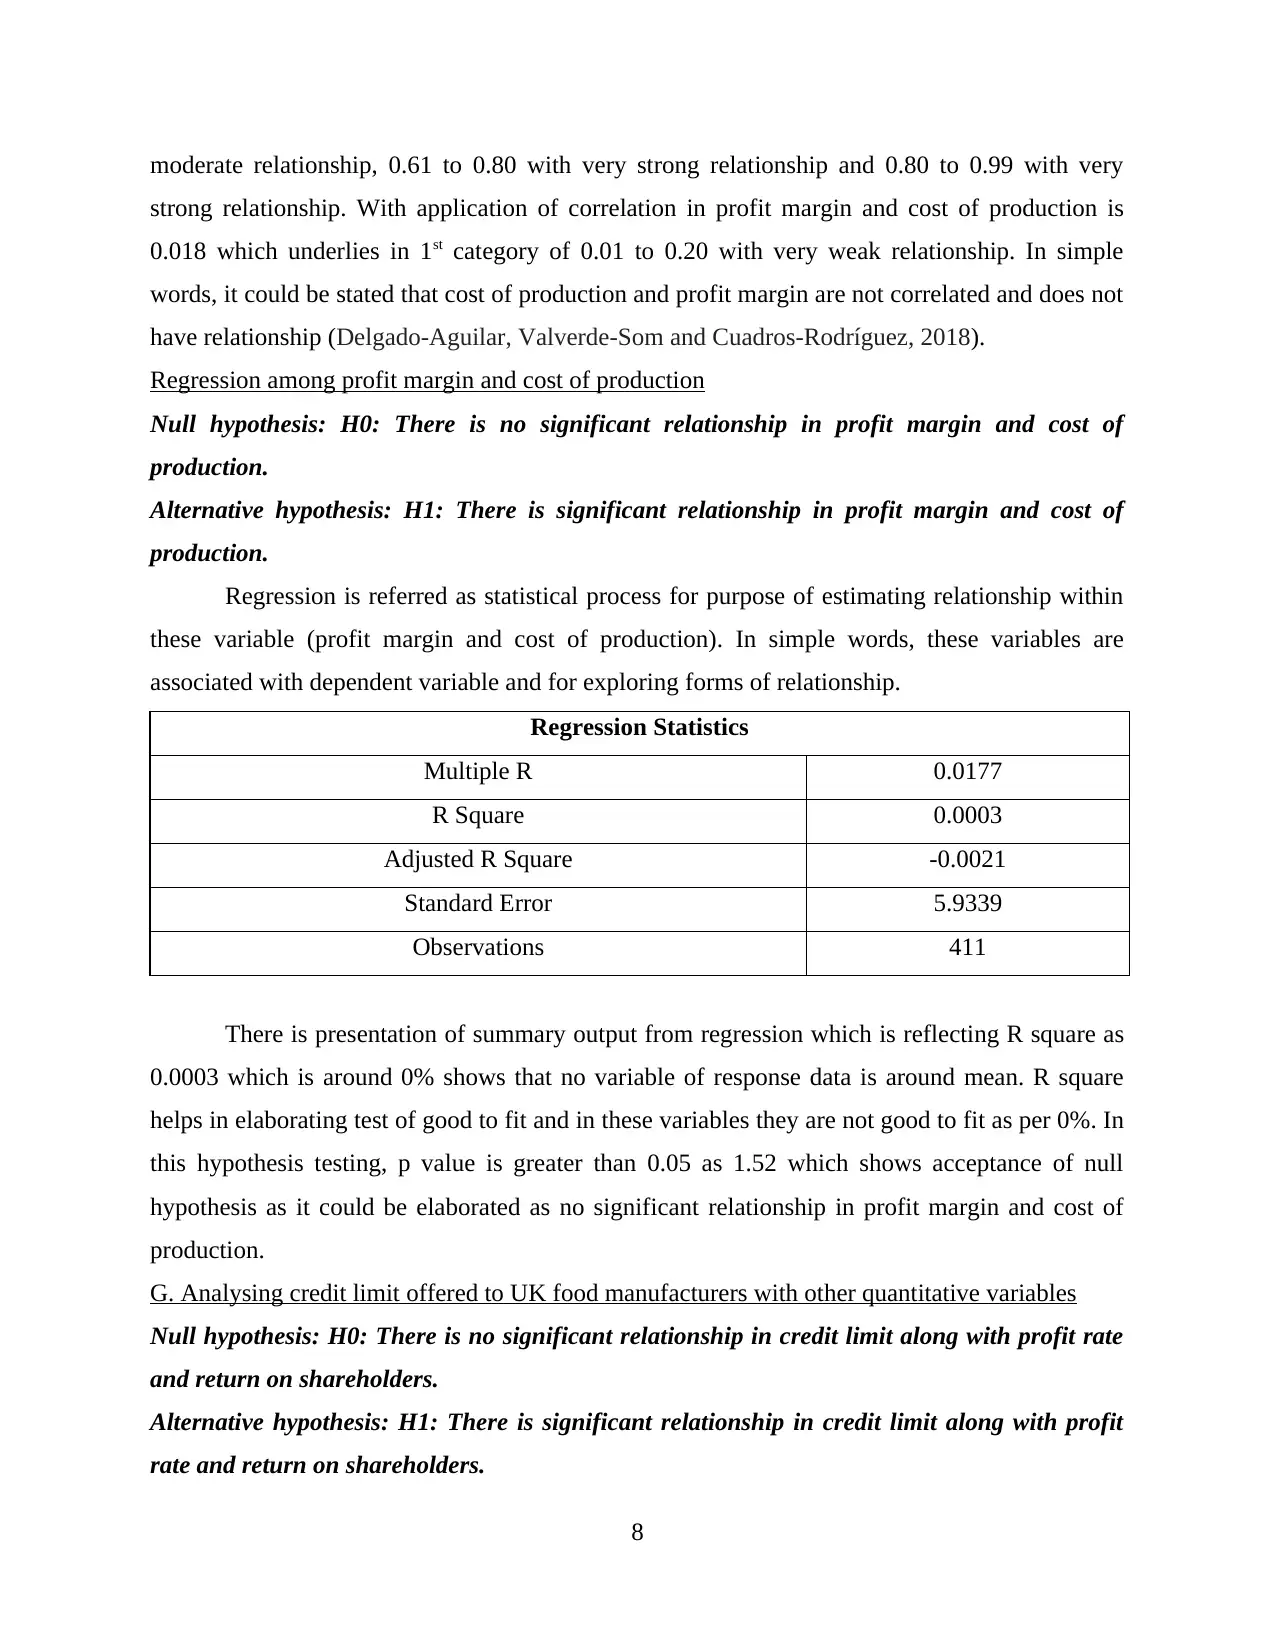
Regression is referred as statistical process for purpose of estimating relationship within
these variable (profit margin and cost of production). In simple words, these variables are
associated with dependent variable and for exploring forms of relationship.
Regression Statistics
Multiple R 0.0177
R Square 0.0003
Adjusted R Square -0.0021
Standard Error 5.9339
Observations 411
There is presentation of summary output from regression which is reflecting R square as
0.0003 which is around 0% shows that no variable of response data is around mean. R square
helps in elaborating test of good to fit and in these variables they are not good to fit as per 0%. In
this hypothesis testing, p value is greater than 0.05 as 1.52 which shows acceptance of null
hypothesis as it could be elaborated as no significant relationship in profit margin and cost of
production.
G. Analysing credit limit offered to UK food manufacturers with other quantitative variables
Null hypothesis: H0: There is no significant relationship in credit limit along with profit rate
and return on shareholders.
Alternative hypothesis: H1: There is significant relationship in credit limit along with profit
rate and return on shareholders.
8
strong relationship. With application of correlation in profit margin and cost of production is
0.018 which underlies in 1st category of 0.01 to 0.20 with very weak relationship. In simple
words, it could be stated that cost of production and profit margin are not correlated and does not
have relationship (Delgado-Aguilar, Valverde-Som and Cuadros-Rodríguez, 2018).
Regression among profit margin and cost of production
Null hypothesis: H0: There is no significant relationship in profit margin and cost of
production.
Alternative hypothesis: H1: There is significant relationship in profit margin and cost of
production.
Regression is referred as statistical process for purpose of estimating relationship within
these variable (profit margin and cost of production). In simple words, these variables are
associated with dependent variable and for exploring forms of relationship.
Regression Statistics
Multiple R 0.0177
R Square 0.0003
Adjusted R Square -0.0021
Standard Error 5.9339
Observations 411
There is presentation of summary output from regression which is reflecting R square as
0.0003 which is around 0% shows that no variable of response data is around mean. R square
helps in elaborating test of good to fit and in these variables they are not good to fit as per 0%. In
this hypothesis testing, p value is greater than 0.05 as 1.52 which shows acceptance of null
hypothesis as it could be elaborated as no significant relationship in profit margin and cost of
production.
G. Analysing credit limit offered to UK food manufacturers with other quantitative variables
Null hypothesis: H0: There is no significant relationship in credit limit along with profit rate
and return on shareholders.
Alternative hypothesis: H1: There is significant relationship in credit limit along with profit
rate and return on shareholders.
8
Paraphrase This Document
Need a fresh take? Get an instant paraphrase of this document with our AI Paraphraser
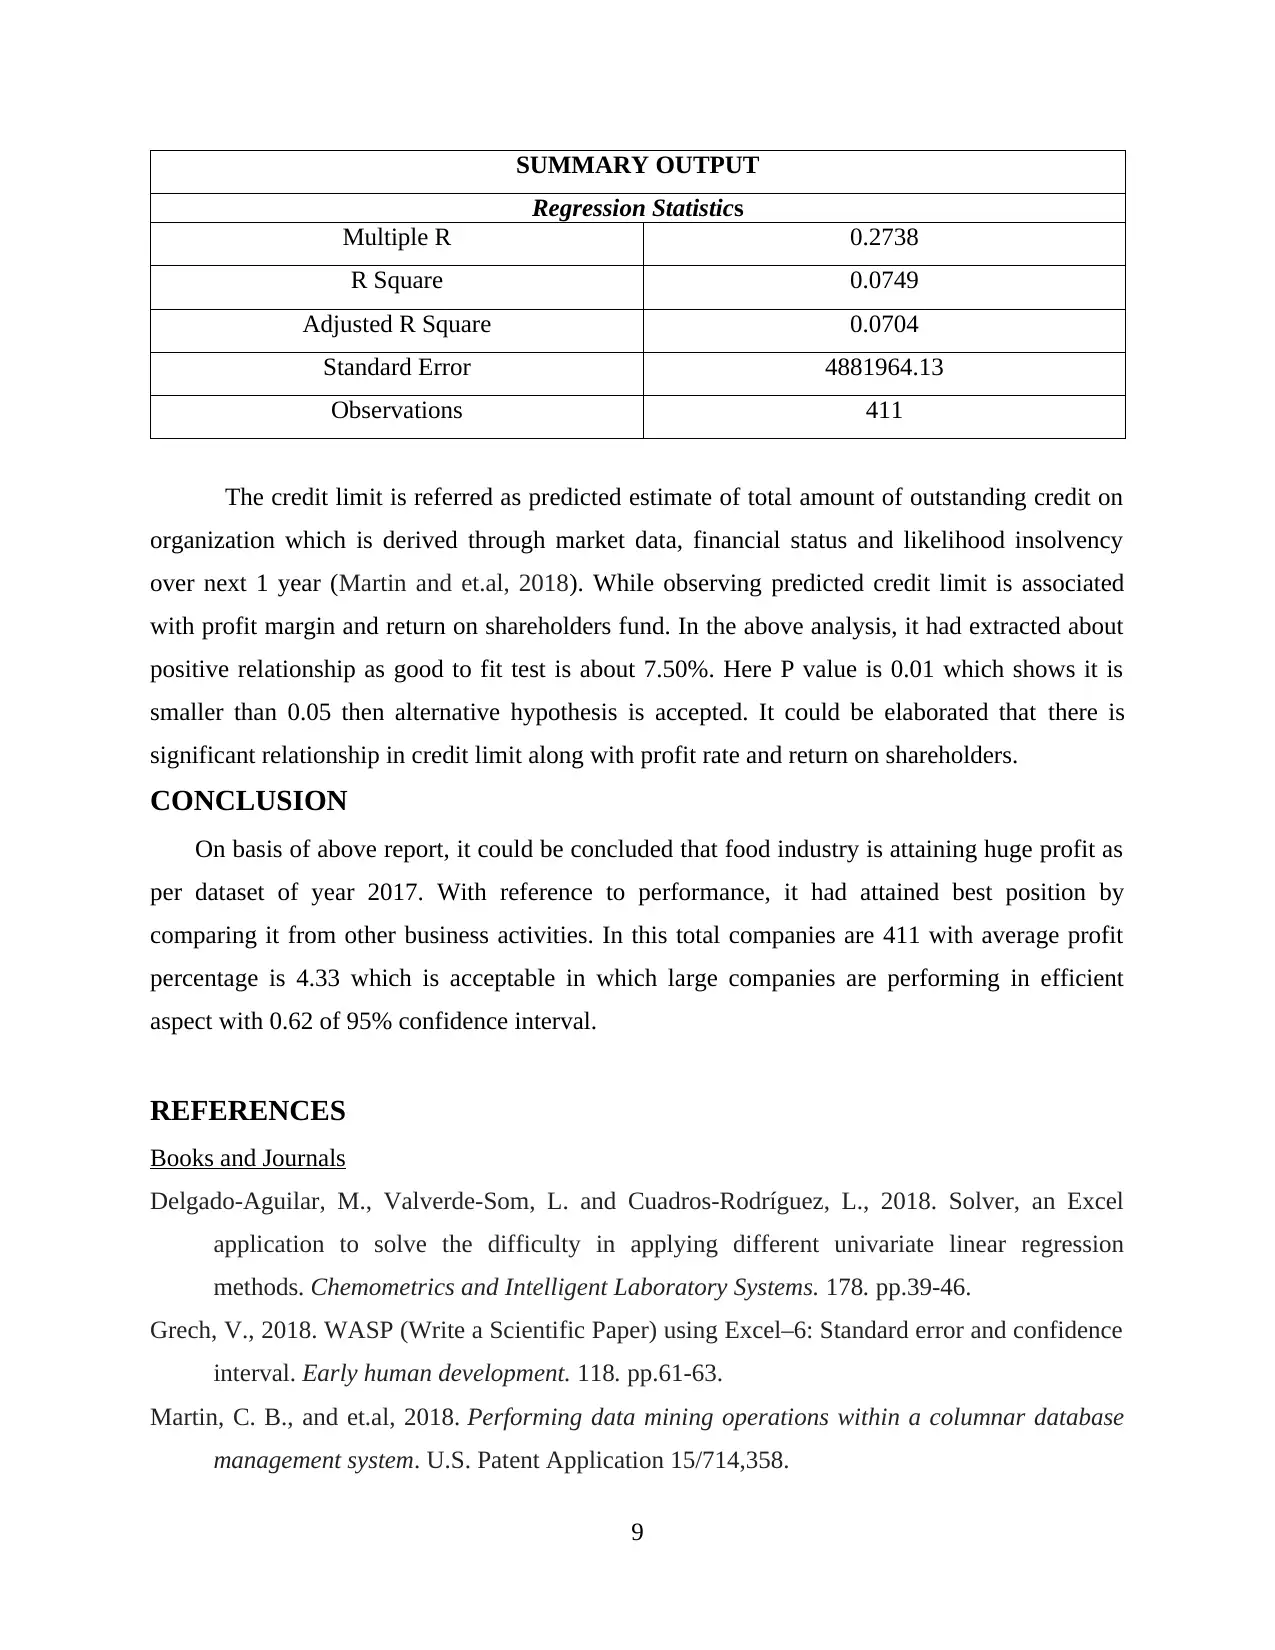
SUMMARY OUTPUT
Regression Statistics
Multiple R 0.2738
R Square 0.0749
Adjusted R Square 0.0704
Standard Error 4881964.13
Observations 411
The credit limit is referred as predicted estimate of total amount of outstanding credit on
organization which is derived through market data, financial status and likelihood insolvency
over next 1 year (Martin and et.al, 2018). While observing predicted credit limit is associated
with profit margin and return on shareholders fund. In the above analysis, it had extracted about
positive relationship as good to fit test is about 7.50%. Here P value is 0.01 which shows it is
smaller than 0.05 then alternative hypothesis is accepted. It could be elaborated that there is
significant relationship in credit limit along with profit rate and return on shareholders.
CONCLUSION
On basis of above report, it could be concluded that food industry is attaining huge profit as
per dataset of year 2017. With reference to performance, it had attained best position by
comparing it from other business activities. In this total companies are 411 with average profit
percentage is 4.33 which is acceptable in which large companies are performing in efficient
aspect with 0.62 of 95% confidence interval.
REFERENCES
Books and Journals
Delgado-Aguilar, M., Valverde-Som, L. and Cuadros-Rodríguez, L., 2018. Solver, an Excel
application to solve the difficulty in applying different univariate linear regression
methods. Chemometrics and Intelligent Laboratory Systems. 178. pp.39-46.
Grech, V., 2018. WASP (Write a Scientific Paper) using Excel–6: Standard error and confidence
interval. Early human development. 118. pp.61-63.
Martin, C. B., and et.al, 2018. Performing data mining operations within a columnar database
management system. U.S. Patent Application 15/714,358.
9
Mooi, E., Sarstedt, M. and Mooi-Reci, I., 2018. Descriptive Statistics. In Market Research (pp.
95-152). Springer, Singapore.
Odukoya, J. A. and et.al., 2018. Learning analytics: Dataset for empirical evaluation of entry
requirements into engineering undergraduate programs in a Nigerian university. Data in
brief. 17. pp.998-1014.
Popoola, S. I. and et.al., 2018. Learning analytics for smart campus: data on academic
performances of engineering undergraduates in Nigerian private university. Data in
brief. 17. pp.76-94.
10
⊘ This is a preview!⊘
Do you want full access?
Subscribe today to unlock all pages.
Trusted by 1+ million students worldwide
1 out of 13
Related Documents


Your All-in-One AI-Powered Toolkit for Academic Success.
+13062052269
info@desklib.com
Available 24*7 on WhatsApp / Email
![[object Object]](/_next/static/media/star-bottom.7253800d.svg)
Unlock your academic potential
Copyright © 2020–2026 A2Z Services. All Rights Reserved. Developed and managed by ZUCOL.