Economics for Business: Analysis of UK Food Supply and Demand Dynamics
VerifiedAdded on 2022/12/16
|11
|2280
|86
Report
AI Summary
This report delves into the economics of the UK food supply chain, examining the interplay of supply and demand curves and how shifts in these curves impact market equilibrium. It analyzes scenarios of shortage and surplus, providing a comprehensive understanding of the factors influencing food availability and pricing. The report further explores instances of market failure within the UK food sector, particularly in the context of the 2020 pandemic, and evaluates the UK government's interventions to address these failures. These interventions include price controls, government transfers, poverty programs, and other social welfare strategies designed to stabilize the market and ensure food security. The analysis provides a clear picture of the challenges faced and the measures taken to mitigate them, offering valuable insights into the economics of food supply and government's role in maintaining market stability.
ECONOMICS FOR
BUISNESS
BUISNESS
Paraphrase This Document
Need a fresh take? Get an instant paraphrase of this document with our AI Paraphraser
TABLE OF CONTENTS
INTRODUCTION...........................................................................................................................3
TASK 1............................................................................................................................................3
Movement of supply curve.........................................................................................................3
Movement on demand curve.......................................................................................................5
Equilibrium shift with shift in supply and demand curve...........................................................7
Shortage and surplus...................................................................................................................8
TASK 2............................................................................................................................................8
Market failures and UK government intervention for addressing the market failures...............8
CONCLUSION................................................................................................................................9
REFERENCES..............................................................................................................................11
INTRODUCTION
Business economics is being defined as the field of applied economics which studies the
financial, market related and organizational and environmental issues being faced by the
company. This subject generally encompasses with the concept of production, distribution,
consumption and the scarcity of the resources. The present study is based on the scenario of UK
food supply challenges which the UK economy is currently facing. The present report will
outline the changes or movement along with supply and demand curve and how it affects the
changes in demand and supply of food in UK. Furthermore, the equilibrium among the demand
and supply will be identified and surplus and shortage will be analysed. In the end the market
failure in UK and the how government tried to overcome the situation will be analysed.
TASK 1
Movement of supply curve
Other things remaining constant price and quantity supplied of goods are directly
proportionate that is if price paid increases then the supply of that good also increases.
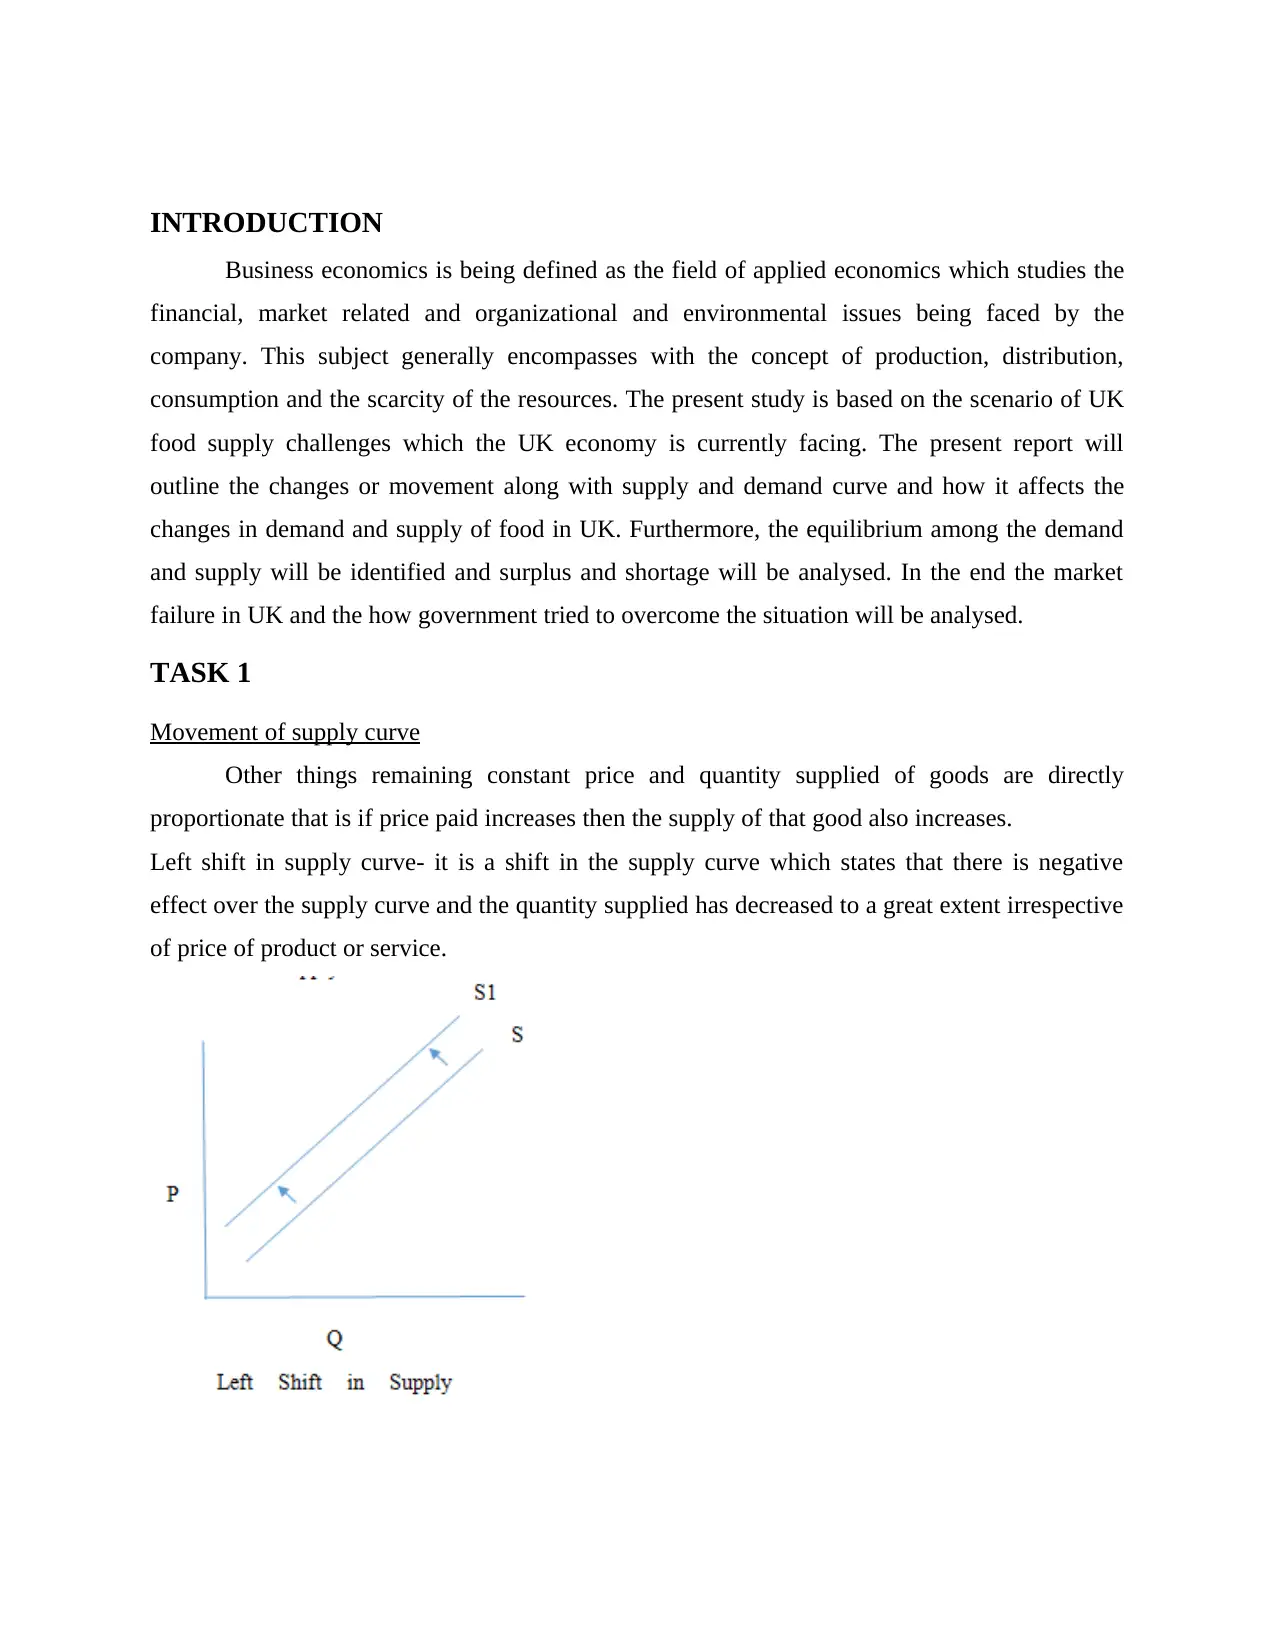
Left shift in supply curve- it is a shift in the supply curve which states that there is negative
effect over the supply curve and the quantity supplied has decreased to a great extent irrespective
of price of product or service.
Business economics is being defined as the field of applied economics which studies the
financial, market related and organizational and environmental issues being faced by the
company. This subject generally encompasses with the concept of production, distribution,
consumption and the scarcity of the resources. The present study is based on the scenario of UK
food supply challenges which the UK economy is currently facing. The present report will
outline the changes or movement along with supply and demand curve and how it affects the
changes in demand and supply of food in UK. Furthermore, the equilibrium among the demand
and supply will be identified and surplus and shortage will be analysed. In the end the market
failure in UK and the how government tried to overcome the situation will be analysed.
TASK 1
Movement of supply curve
Other things remaining constant price and quantity supplied of goods are directly
proportionate that is if price paid increases then the supply of that good also increases.
Left shift in supply curve- it is a shift in the supply curve which states that there is negative
effect over the supply curve and the quantity supplied has decreased to a great extent irrespective
of price of product or service.
⊘ This is a preview!⊘
Do you want full access?
Subscribe today to unlock all pages.
Trusted by 1+ million students worldwide
For example when the government of the country imposes taxes over the company then
this increases the cost of production and as a result of this supply curve changes to the leftward
side. The leftwards sift in the supply curve means that supply decreases and firm is producing
less quantity and due to which cost of production has increased (Ferreira Gregorio, Pié and
Terceño, 2018).
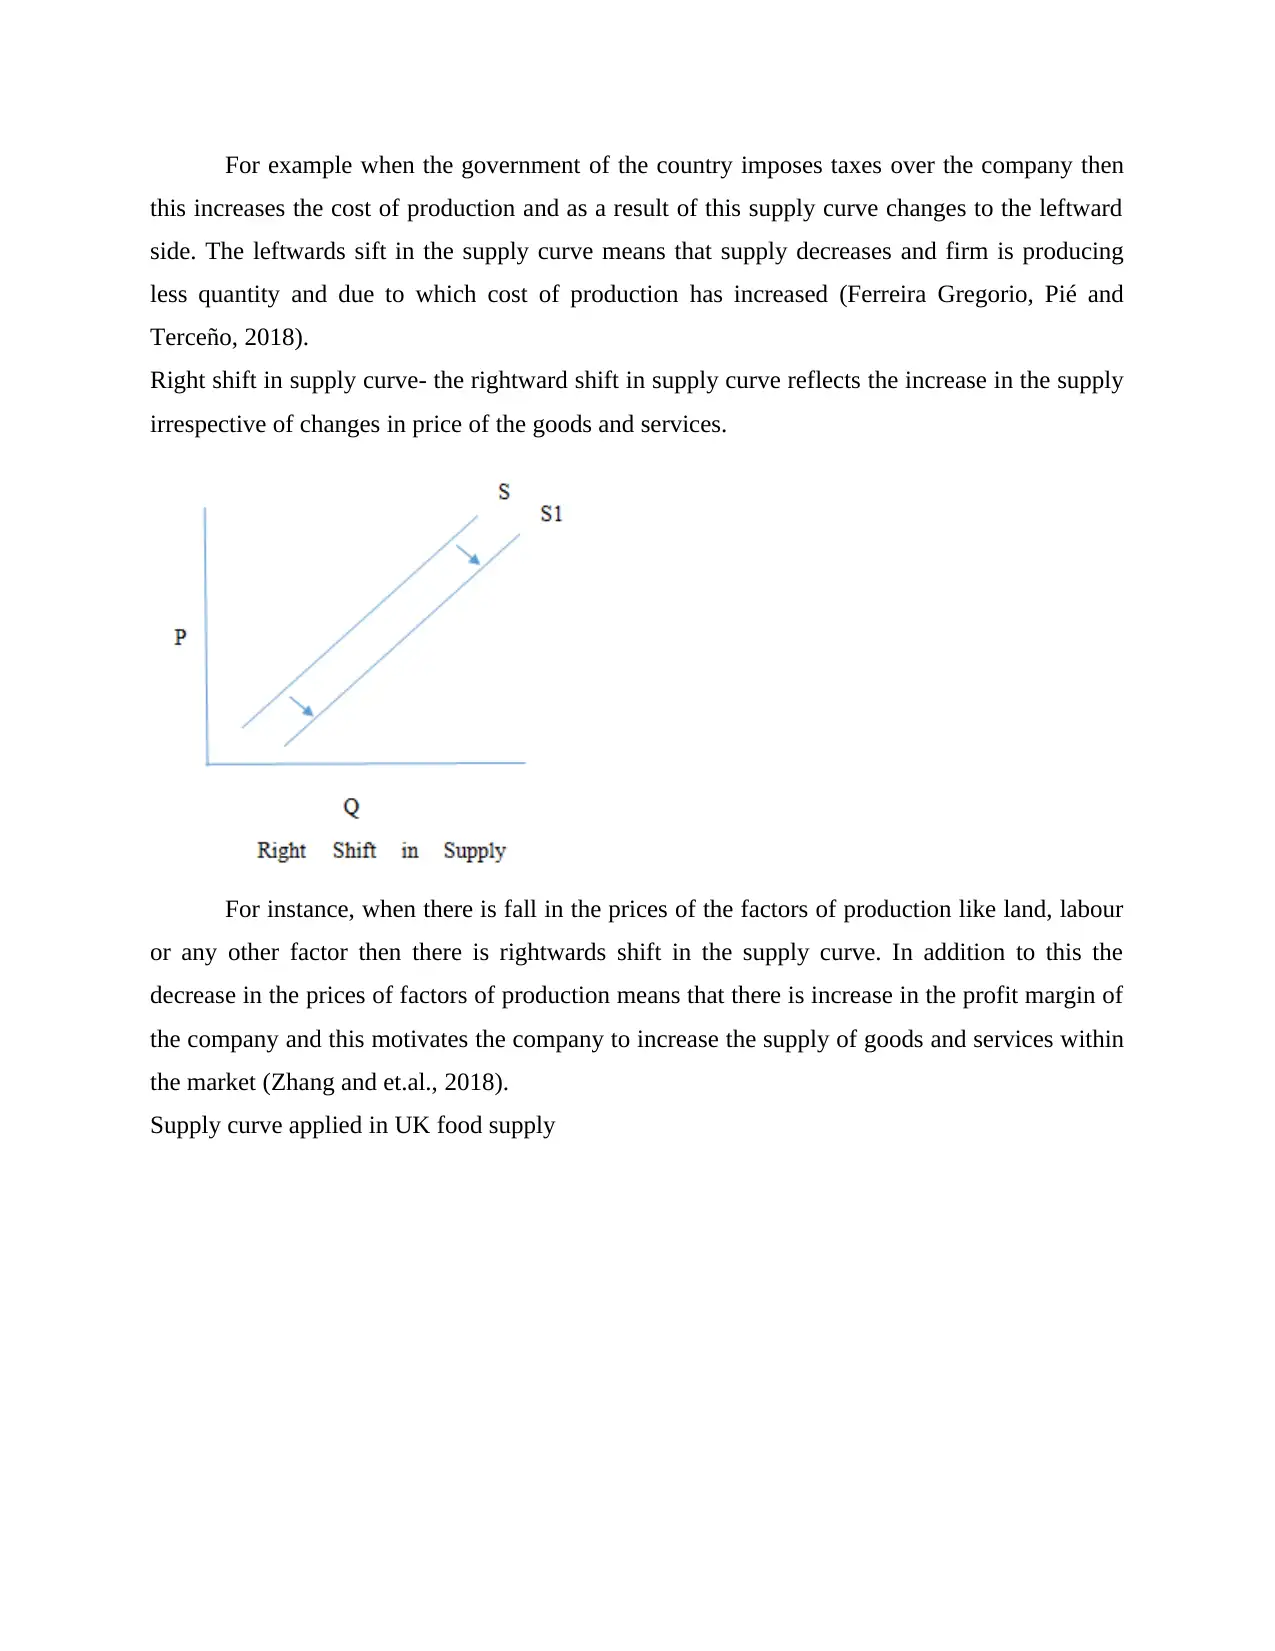
Right shift in supply curve- the rightward shift in supply curve reflects the increase in the supply
irrespective of changes in price of the goods and services.
For instance, when there is fall in the prices of the factors of production like land, labour
or any other factor then there is rightwards shift in the supply curve. In addition to this the
decrease in the prices of factors of production means that there is increase in the profit margin of
the company and this motivates the company to increase the supply of goods and services within
the market (Zhang and et.al., 2018).
Supply curve applied in UK food supply
this increases the cost of production and as a result of this supply curve changes to the leftward
side. The leftwards sift in the supply curve means that supply decreases and firm is producing
less quantity and due to which cost of production has increased (Ferreira Gregorio, Pié and
Terceño, 2018).
Right shift in supply curve- the rightward shift in supply curve reflects the increase in the supply
irrespective of changes in price of the goods and services.
For instance, when there is fall in the prices of the factors of production like land, labour
or any other factor then there is rightwards shift in the supply curve. In addition to this the
decrease in the prices of factors of production means that there is increase in the profit margin of
the company and this motivates the company to increase the supply of goods and services within
the market (Zhang and et.al., 2018).
Supply curve applied in UK food supply
Paraphrase This Document
Need a fresh take? Get an instant paraphrase of this document with our AI Paraphraser
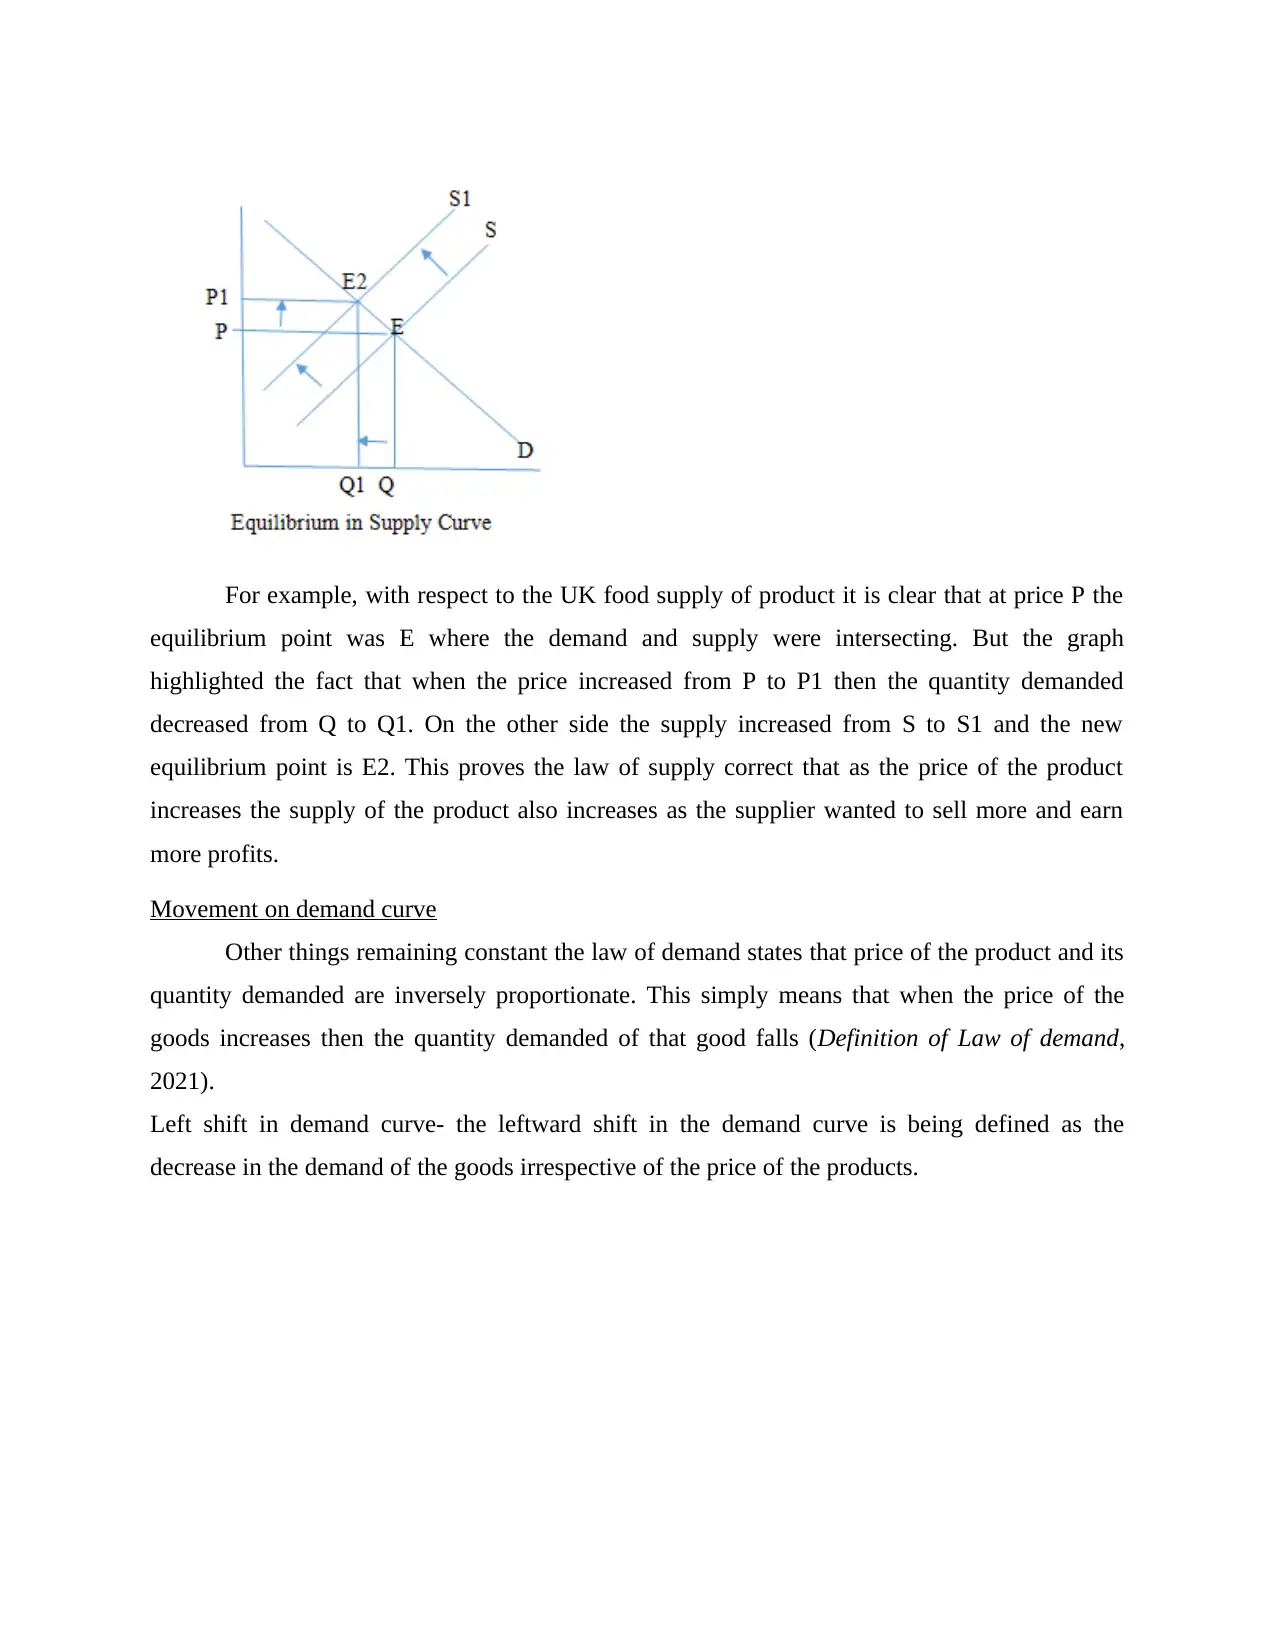
For example, with respect to the UK food supply of product it is clear that at price P the
equilibrium point was E where the demand and supply were intersecting. But the graph
highlighted the fact that when the price increased from P to P1 then the quantity demanded
decreased from Q to Q1. On the other side the supply increased from S to S1 and the new
equilibrium point is E2. This proves the law of supply correct that as the price of the product
increases the supply of the product also increases as the supplier wanted to sell more and earn
more profits.
Movement on demand curve
Other things remaining constant the law of demand states that price of the product and its
quantity demanded are inversely proportionate. This simply means that when the price of the
goods increases then the quantity demanded of that good falls (Definition of Law of demand,
2021).
Left shift in demand curve- the leftward shift in the demand curve is being defined as the
decrease in the demand of the goods irrespective of the price of the products.
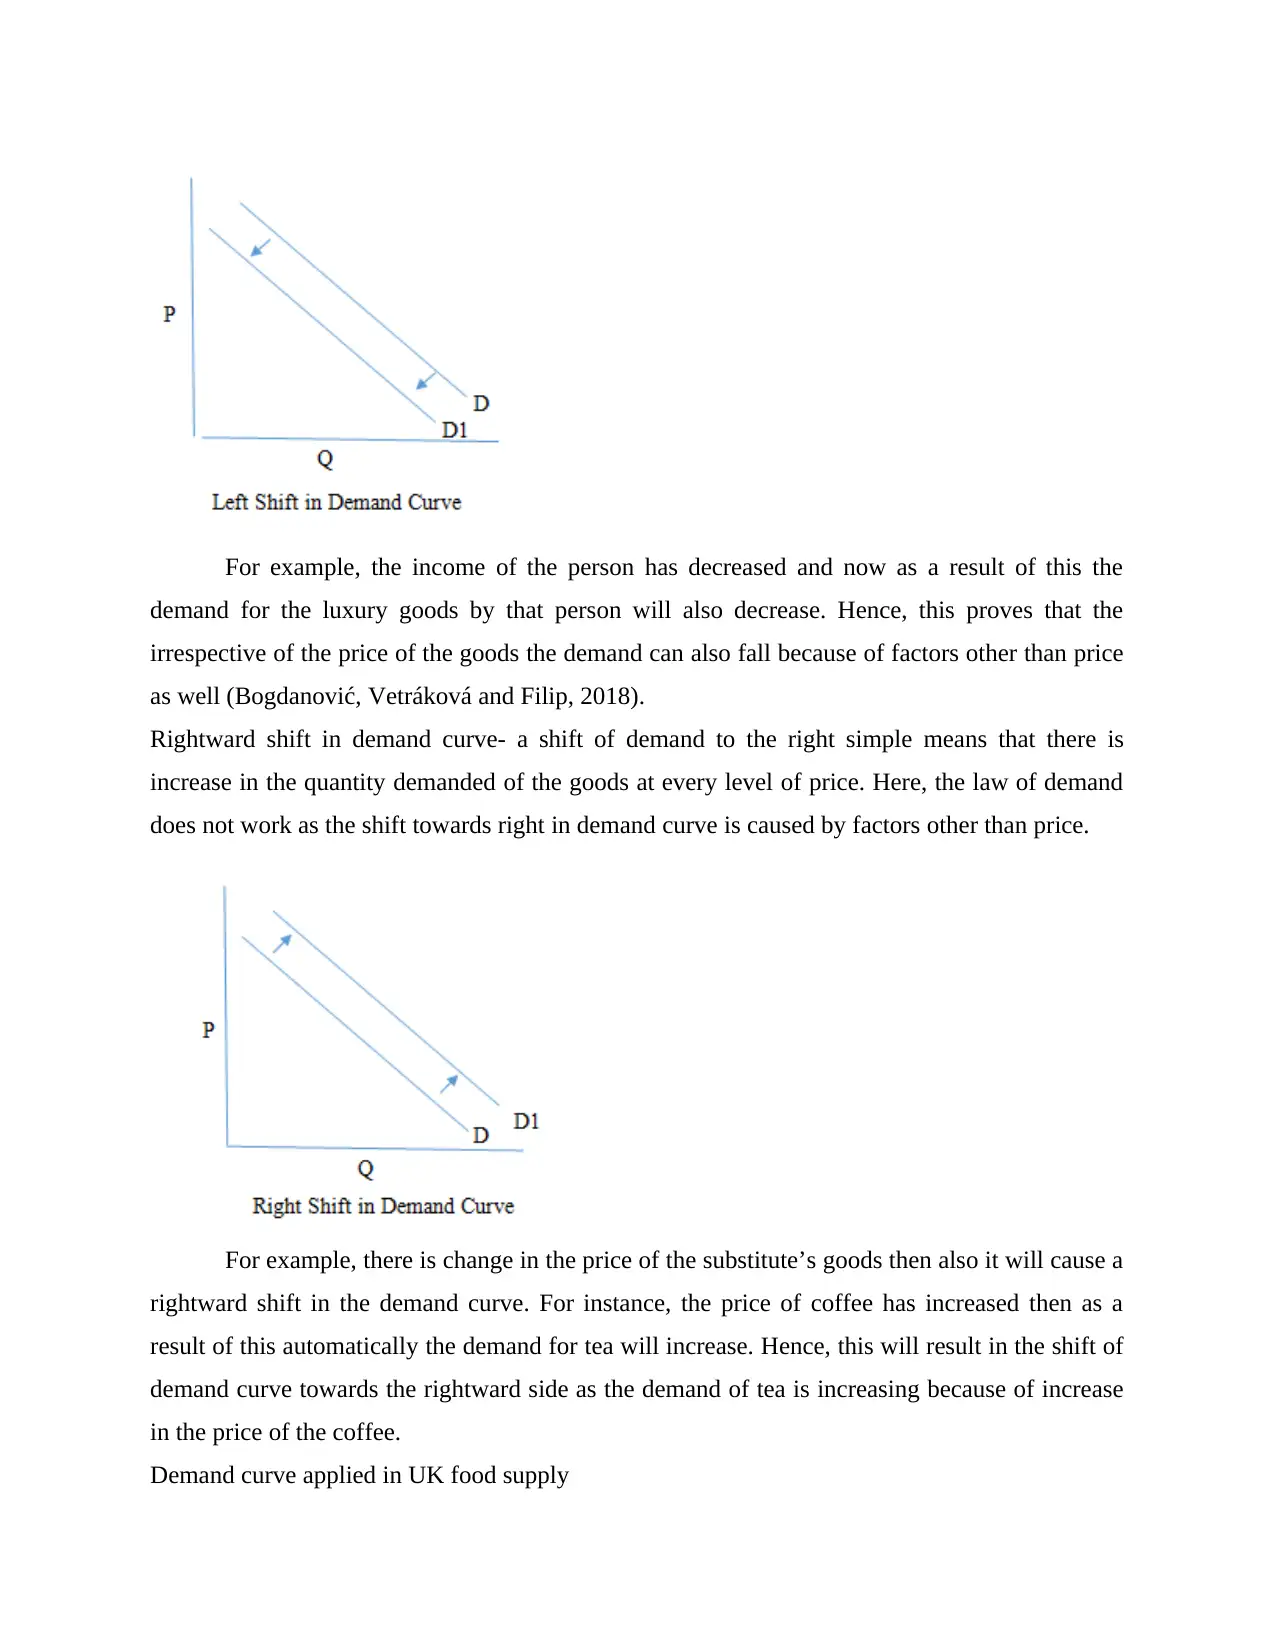
For example, the income of the person has decreased and now as a result of this the
demand for the luxury goods by that person will also decrease. Hence, this proves that the
irrespective of the price of the goods the demand can also fall because of factors other than price
as well (Bogdanović, Vetráková and Filip, 2018).
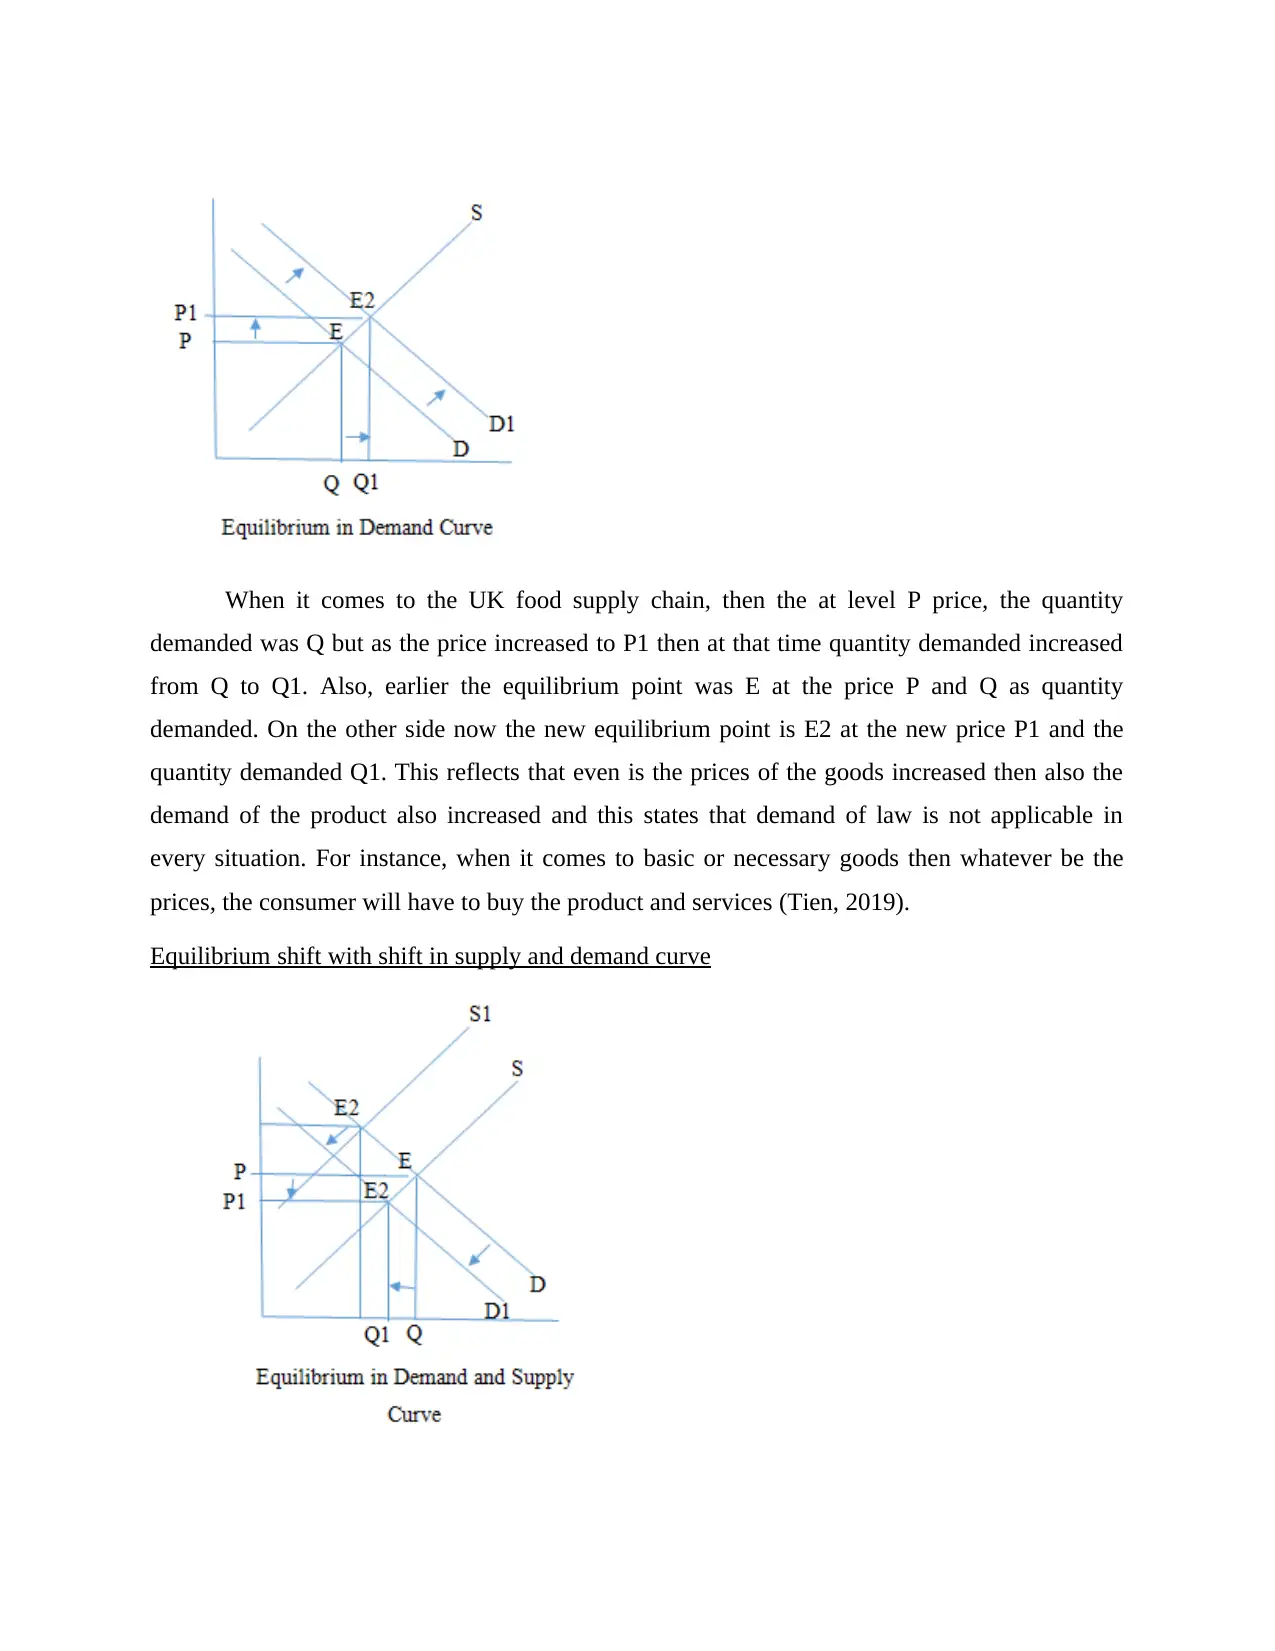
Rightward shift in demand curve- a shift of demand to the right simple means that there is
increase in the quantity demanded of the goods at every level of price. Here, the law of demand
does not work as the shift towards right in demand curve is caused by factors other than price.
For example, there is change in the price of the substitute’s goods then also it will cause a
rightward shift in the demand curve. For instance, the price of coffee has increased then as a
result of this automatically the demand for tea will increase. Hence, this will result in the shift of
demand curve towards the rightward side as the demand of tea is increasing because of increase
in the price of the coffee.
Demand curve applied in UK food supply
demand for the luxury goods by that person will also decrease. Hence, this proves that the
irrespective of the price of the goods the demand can also fall because of factors other than price
as well (Bogdanović, Vetráková and Filip, 2018).
Rightward shift in demand curve- a shift of demand to the right simple means that there is
increase in the quantity demanded of the goods at every level of price. Here, the law of demand
does not work as the shift towards right in demand curve is caused by factors other than price.
For example, there is change in the price of the substitute’s goods then also it will cause a
rightward shift in the demand curve. For instance, the price of coffee has increased then as a
result of this automatically the demand for tea will increase. Hence, this will result in the shift of
demand curve towards the rightward side as the demand of tea is increasing because of increase
in the price of the coffee.
Demand curve applied in UK food supply
⊘ This is a preview!⊘
Do you want full access?
Subscribe today to unlock all pages.
Trusted by 1+ million students worldwide
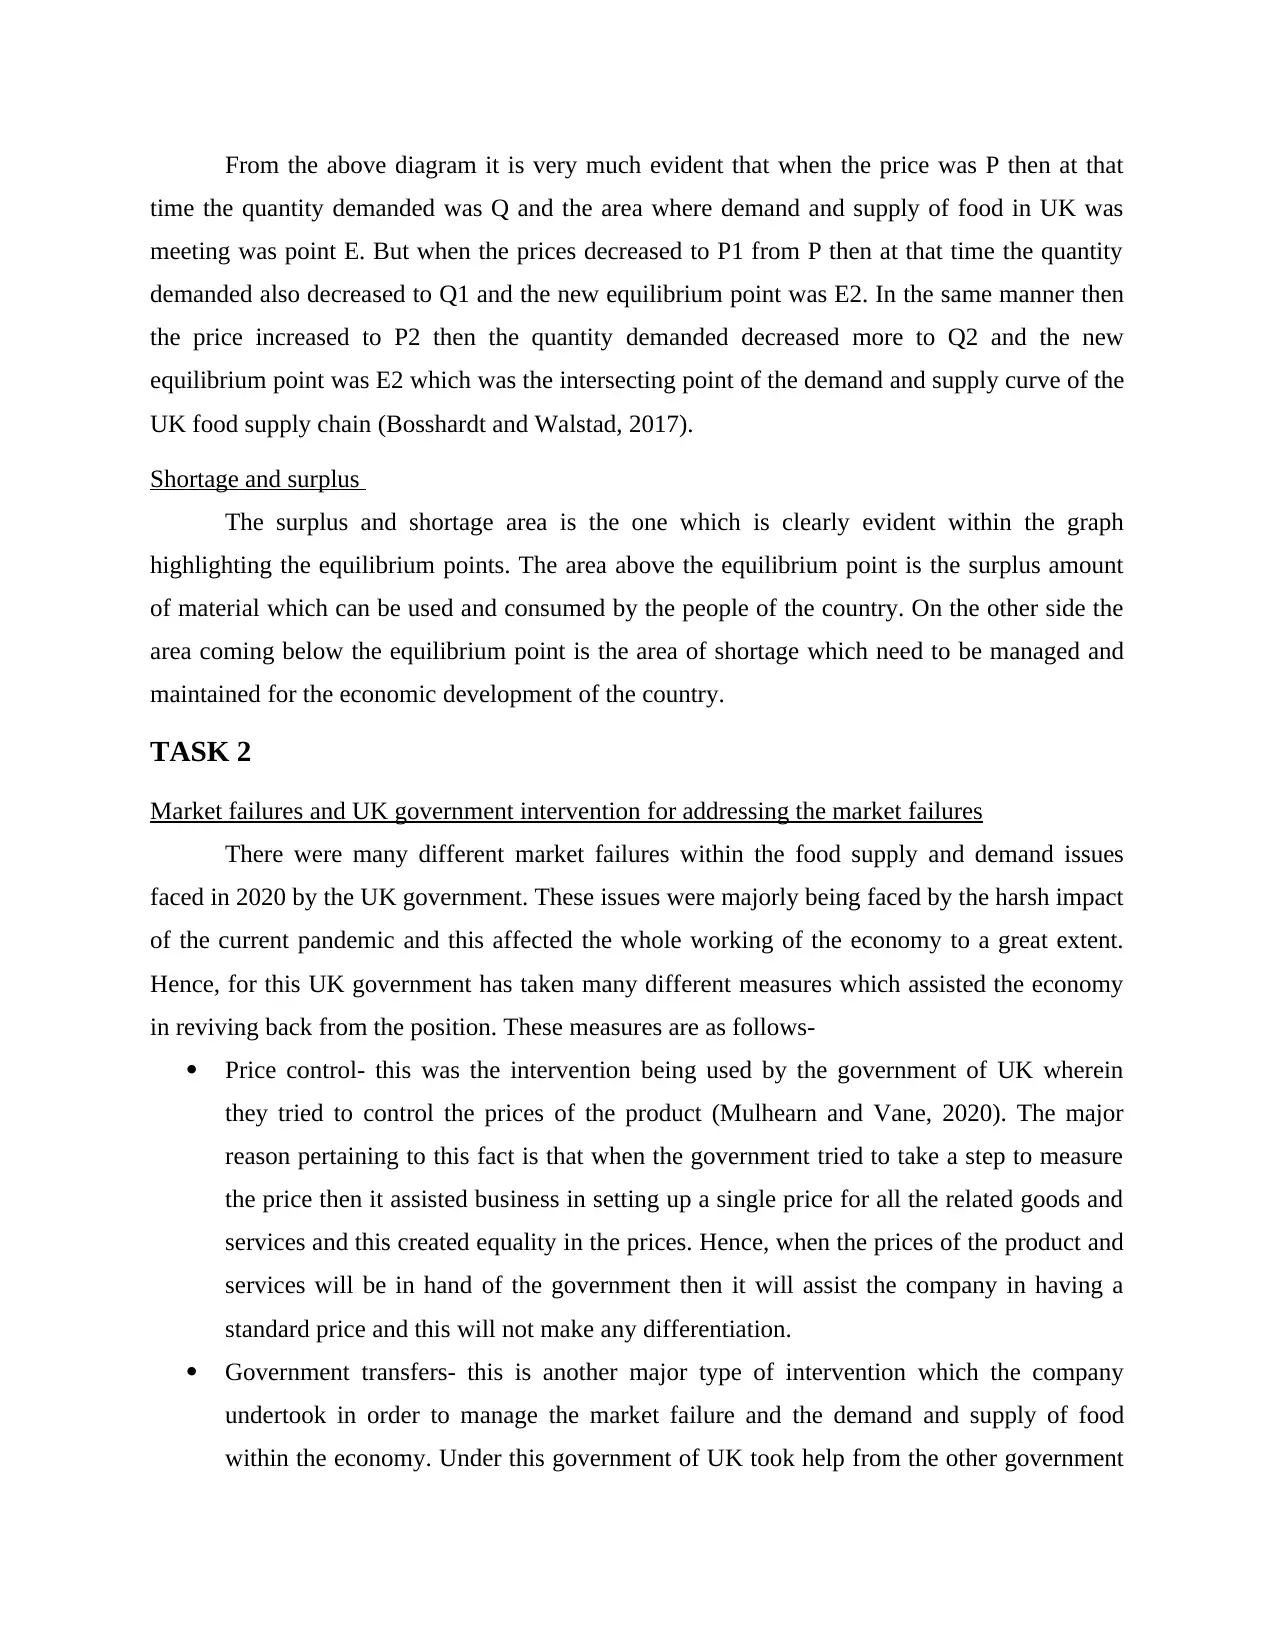
When it comes to the UK food supply chain, then the at level P price, the quantity
demanded was Q but as the price increased to P1 then at that time quantity demanded increased
from Q to Q1. Also, earlier the equilibrium point was E at the price P and Q as quantity
demanded. On the other side now the new equilibrium point is E2 at the new price P1 and the
quantity demanded Q1. This reflects that even is the prices of the goods increased then also the
demand of the product also increased and this states that demand of law is not applicable in
every situation. For instance, when it comes to basic or necessary goods then whatever be the
prices, the consumer will have to buy the product and services (Tien, 2019).
Equilibrium shift with shift in supply and demand curve
Paraphrase This Document
Need a fresh take? Get an instant paraphrase of this document with our AI Paraphraser
From the above diagram it is very much evident that when the price was P then at that
time the quantity demanded was Q and the area where demand and supply of food in UK was
meeting was point E. But when the prices decreased to P1 from P then at that time the quantity
demanded also decreased to Q1 and the new equilibrium point was E2. In the same manner then
the price increased to P2 then the quantity demanded decreased more to Q2 and the new
equilibrium point was E2 which was the intersecting point of the demand and supply curve of the
UK food supply chain (Bosshardt and Walstad, 2017).
Shortage and surplus
The surplus and shortage area is the one which is clearly evident within the graph
highlighting the equilibrium points. The area above the equilibrium point is the surplus amount
of material which can be used and consumed by the people of the country. On the other side the
area coming below the equilibrium point is the area of shortage which need to be managed and
maintained for the economic development of the country.
TASK 2
Market failures and UK government intervention for addressing the market failures
There were many different market failures within the food supply and demand issues
faced in 2020 by the UK government. These issues were majorly being faced by the harsh impact
of the current pandemic and this affected the whole working of the economy to a great extent.
Hence, for this UK government has taken many different measures which assisted the economy
in reviving back from the position. These measures are as follows-
Price control- this was the intervention being used by the government of UK wherein
they tried to control the prices of the product (Mulhearn and Vane, 2020). The major
reason pertaining to this fact is that when the government tried to take a step to measure
the price then it assisted business in setting up a single price for all the related goods and
services and this created equality in the prices. Hence, when the prices of the product and
services will be in hand of the government then it will assist the company in having a
standard price and this will not make any differentiation.
Government transfers- this is another major type of intervention which the company
undertook in order to manage the market failure and the demand and supply of food
within the economy. Under this government of UK took help from the other government
by way of transfer and this assisted them to manage the food supply within the UK
economy. This is particularly because o the reason that when the government will be
having supply of money then they will be in a position to pay off the expenses wherever
necessary (Lagoa-Varela, Alvarez-García and Boedo Vilabella, 2018).
Poverty program- this is another major bigger intervention which assisted government of
UK in managing the market failure the food demand and supply within the economy.
Under the poverty program the UK economy assisted and helped a number a poor people
in elevating from their poor condition. This is particularly because of the reason that if
the poverty will be eradicated from the economy then automatically will result in the
better working of the economy and equal distribution of the income among the people
and there will not be any shortage of the supply and demand of food within the economy.
Other social welfare strategies- in addition to the management of poverty the government
of the country is also providing for other social welfare strategies. This will assist the
country in the economic development of the country and will also promote equality and
diversity within the economy. This is particularly because of the reason that all these
welfare strategies will be built for those section of the economy that are not having more
privileges and benefits as compared to the other strong section of the economy (Arfah
and et.al., 2020).
Hence, in the end it can be stated that the use of these government intervention will assist the
companies and the UK economy in improving its working efficiency and effectiveness of
economy. This is particularly because of the reason that when the government will be complying
with all these factors and intervention then this will result in the better working of the economy
and economic development of the country.
CONCLUSION
In the end it is summarised that the economics is defined as study of the production,
consumption and scarcity of the limited resources which are present in an economy. This
involves the decision to be taken in order to optimally use the resources which are limited in
nature and how well they can be used in order to provide meaning to the economy. The current
report discussed the reason for the left and rightward shifts of the demand and supply curve
which involves factors other than the price. In addition to this surplus and shortage was also
analysed with help of the equilibrium chart. In the end the government intervention for managing
⊘ This is a preview!⊘
Do you want full access?
Subscribe today to unlock all pages.
Trusted by 1+ million students worldwide

the problem of food supply and demand was discussed. It was found that most common
government intervention were like price control, poverty program and many others.
government intervention were like price control, poverty program and many others.
Paraphrase This Document
Need a fresh take? Get an instant paraphrase of this document with our AI Paraphraser
REFERENCES
Books and Journals
Arfah, A., and et.al., 2020. Economics During Global Recession: Sharia-Economics as a Post
COVID-19 Agenda. The Journal of Asian Finance, Economics, and Business, 7(11),
pp.1077-1085.
Bogdanović, M., Vetráková, M. and Filip, S., 2018. Dark triad characteristics between
economics & business students in Croatia & Slovakia: what can be expected from the
future employees?. Entrepreneurship and Sustainability Issues, 5(4), pp.967-991.
Bosshardt, W. and Walstad, W.B., 2017. Economics and business coursework by undergraduate
students: Findings from Baccalaureate and Beyond transcripts. The Journal of Economic
Education, 48(1), pp.51-60.
Ferreira Gregorio, V., Pié, L. and Terceño, A., 2018. A systematic literature review of bio, green
and circular economy trends in publications in the field of economics and business
management. Sustainability, 10(11), p.4232.
Lagoa-Varela, D., Alvarez-García, B. and Boedo Vilabella, L., 2018. Recent changes in the role
of Spanish lecturers in economics and business: an empirical analysis based on their
own perspectives. Studies in Higher Education, 43(8), pp.1321-1333.
Mulhearn, C. and Vane, H.R., 2020. Economics for business. Red Globe Press.
Tien, N.H., 2019. International economics, business and management strategy. Dehli: Academic
Publications.
Zhang, N., and et.al., 2018. A bibliometric analysis of highly cited papers in the field of
Economics and Business based on the Essential Science Indicators database.
Scientometrics, 116(2), pp.1039-1053.
Online
Definition of Law of demand. 2021.[Online]. Available through:
<https://economictimes.indiatimes.com/definition/law-of-demand>
1 out of 11
Related Documents


Your All-in-One AI-Powered Toolkit for Academic Success.
+13062052269
info@desklib.com
Available 24*7 on WhatsApp / Email
![[object Object]](/_next/static/media/star-bottom.7253800d.svg)
Unlock your academic potential
Copyright © 2020–2026 A2Z Services. All Rights Reserved. Developed and managed by ZUCOL.