Economics for Business (MOD003327): UK Food Supply Challenges Report
VerifiedAdded on 2022/12/27
|18
|3542
|37
Report
AI Summary
This report provides an in-depth analysis of the UK's food supply challenges in 2020, focusing on the economic impacts of the COVID-19 pandemic. It begins with an executive summary and introduction, setting the stage for an examination of supply and demand principles, utilizing graphs and economic theories. The report then delves into market equilibrium, shortages, and surpluses, explaining how these concepts were affected by the crisis. Furthermore, it addresses market failures and the government's interventions. The analysis considers factors such as trade barriers, stock piling, and changes in consumer behavior. The report utilizes theories from Krugman and Wells to explain the economic phenomena observed during the crisis. The conclusion summarizes the key findings and emphasizes the multifaceted nature of the UK's food supply issues, attributing them not only to the pandemic but also to pre-existing conditions like Brexit and social inequalities.
Business for
Economics
Economics
Paraphrase This Document
Need a fresh take? Get an instant paraphrase of this document with our AI Paraphraser
EXECUTIVE SUMMARY
As COVID-19 pandemic have stroked entire world it have not only impacted health
scenario in the world up-surging needs of good health infrastructure worldwide, it have
interrupted many other activities and changed normal global order completely. Besides health
sector, other most affected activities and sectors include freedom of movement of people and
economic activities. In consideration of one of the most affected country by the pandemic,
United kingdom (UK) have experienced many adverse effects. Agriculture sector and disrupted
food supply are clear, certain and live evidences of this scenario. Affects of this disruption were
noticed in both ways. From the market factors side scarcity of food was seen in market,
movement of agricultural goods from cross borders further triggered this scenario and market
inflation was hiking constantly. However, inflation can be more attributed to second factor of
mismanagement by government. When government allowed retail marketers to pile stocks of
food but not household users. Further logistics, labelling and packaging problems added to many
other problems, affecting market order and incomes of people. Looking holistically, UK food
crisis cannot only be attributed to pandemic only, and many other developments seen in UK such
as Brexit, climate change, social inequalities and weak mechanisms were also playful.
Table of Contents
EXECUTIVE SUMMARY.............................................................................................................2
INTRODUCTION...........................................................................................................................1
TASK 1............................................................................................................................................1
Studying Supply curve...........................................................................................................1
Studying Demand curve.........................................................................................................6
Studying Equilibrium.............................................................................................................9
Explaining Shortages and Surplus........................................................................................10
TASK 2..........................................................................................................................................11
Economic Principles of Market Failure................................................................................11
Intervention by Government.................................................................................................11
CONCLUSION..............................................................................................................................13
REFERENCES..............................................................................................................................14
Books and Journals...............................................................................................................14
⊘ This is a preview!⊘
Do you want full access?
Subscribe today to unlock all pages.
Trusted by 1+ million students worldwide

Paraphrase This Document
Need a fresh take? Get an instant paraphrase of this document with our AI Paraphraser
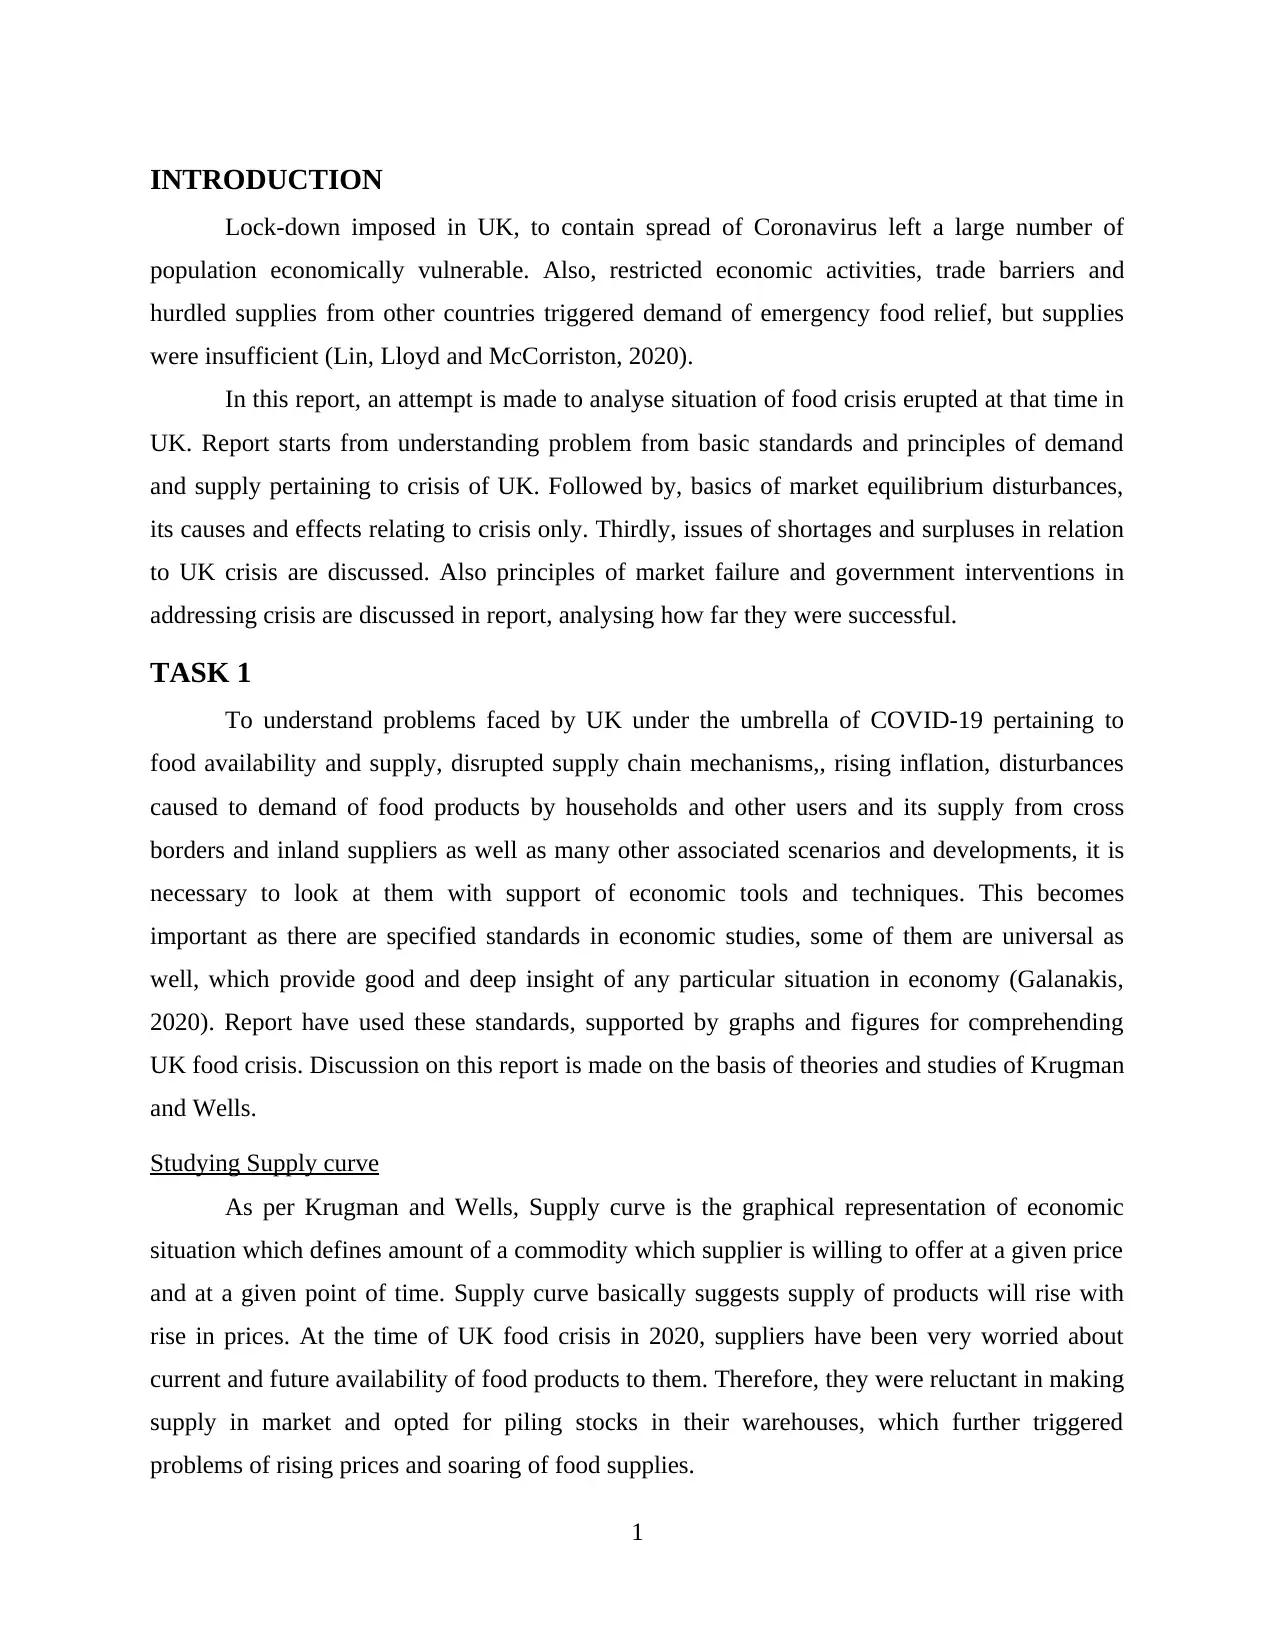
INTRODUCTION
Lock-down imposed in UK, to contain spread of Coronavirus left a large number of
population economically vulnerable. Also, restricted economic activities, trade barriers and
hurdled supplies from other countries triggered demand of emergency food relief, but supplies
were insufficient (Lin, Lloyd and McCorriston, 2020).
In this report, an attempt is made to analyse situation of food crisis erupted at that time in
UK. Report starts from understanding problem from basic standards and principles of demand
and supply pertaining to crisis of UK. Followed by, basics of market equilibrium disturbances,
its causes and effects relating to crisis only. Thirdly, issues of shortages and surpluses in relation
to UK crisis are discussed. Also principles of market failure and government interventions in
addressing crisis are discussed in report, analysing how far they were successful.
TASK 1
To understand problems faced by UK under the umbrella of COVID-19 pertaining to
food availability and supply, disrupted supply chain mechanisms,, rising inflation, disturbances
caused to demand of food products by households and other users and its supply from cross
borders and inland suppliers as well as many other associated scenarios and developments, it is
necessary to look at them with support of economic tools and techniques. This becomes
important as there are specified standards in economic studies, some of them are universal as
well, which provide good and deep insight of any particular situation in economy (Galanakis,
2020). Report have used these standards, supported by graphs and figures for comprehending
UK food crisis. Discussion on this report is made on the basis of theories and studies of Krugman
and Wells.
Studying Supply curve
As per Krugman and Wells, Supply curve is the graphical representation of economic
situation which defines amount of a commodity which supplier is willing to offer at a given price
and at a given point of time. Supply curve basically suggests supply of products will rise with
rise in prices. At the time of UK food crisis in 2020, suppliers have been very worried about
current and future availability of food products to them. Therefore, they were reluctant in making
supply in market and opted for piling stocks in their warehouses, which further triggered
problems of rising prices and soaring of food supplies.
1
The situation arose thereon in UK economy studied in report with help of graphs and
economic theories of Krugman and Wells and economic standards.
Movement along supply curve
Movement along supply curve means changes in amount of supply of commodity that
occurs only due to changes in prices while other determinants of supply, such as consumer
preference and taxation policy of government remains constant. This indicate fluctuation at
different points over the supply curve only.
2
⊘ This is a preview!⊘
Do you want full access?
Subscribe today to unlock all pages.
Trusted by 1+ million students worldwide
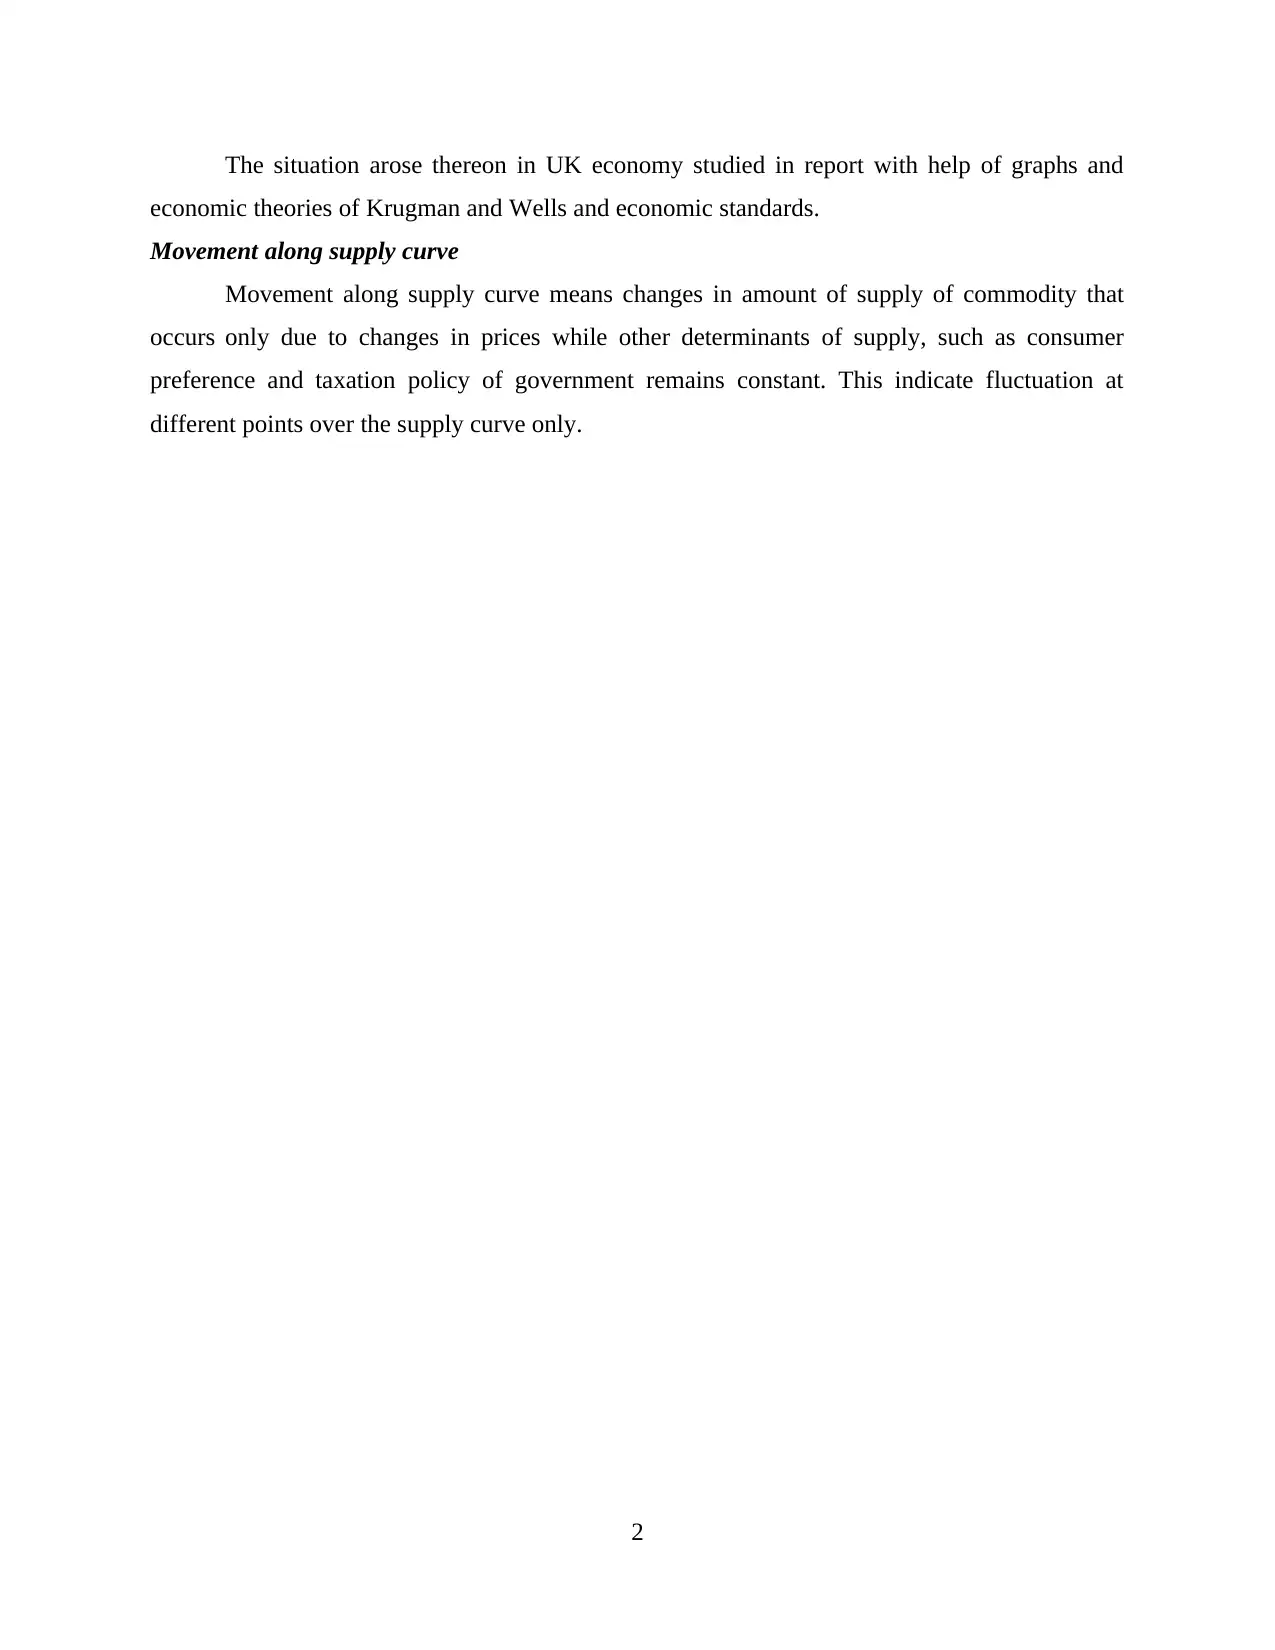
In above figure, points like A, B, C and D indicates changes in quantity supplied by
supplier or producer at different prices prevailing in market. This standard specifies normal
economic scenario where quantity is supplied more when prices rises, so more revenue can be
generated. In UK food crisis this situation was not seen as prices of food commodities was rising
due to other socio-economic factors.
Leftward shift in supply curve
A leftward shift in supply curve occurs when supply of product offered by producer
decreases from existing amount of commodity supply in market because of Non-price factors.
Factors besides price, affecting supply can be change in consumer preference, technology,
taxation policy etc. acting in manner non-favourable for suppliers.
3
Illustration 1: Movement of Supply curve
Paraphrase This Document
Need a fresh take? Get an instant paraphrase of this document with our AI Paraphraser
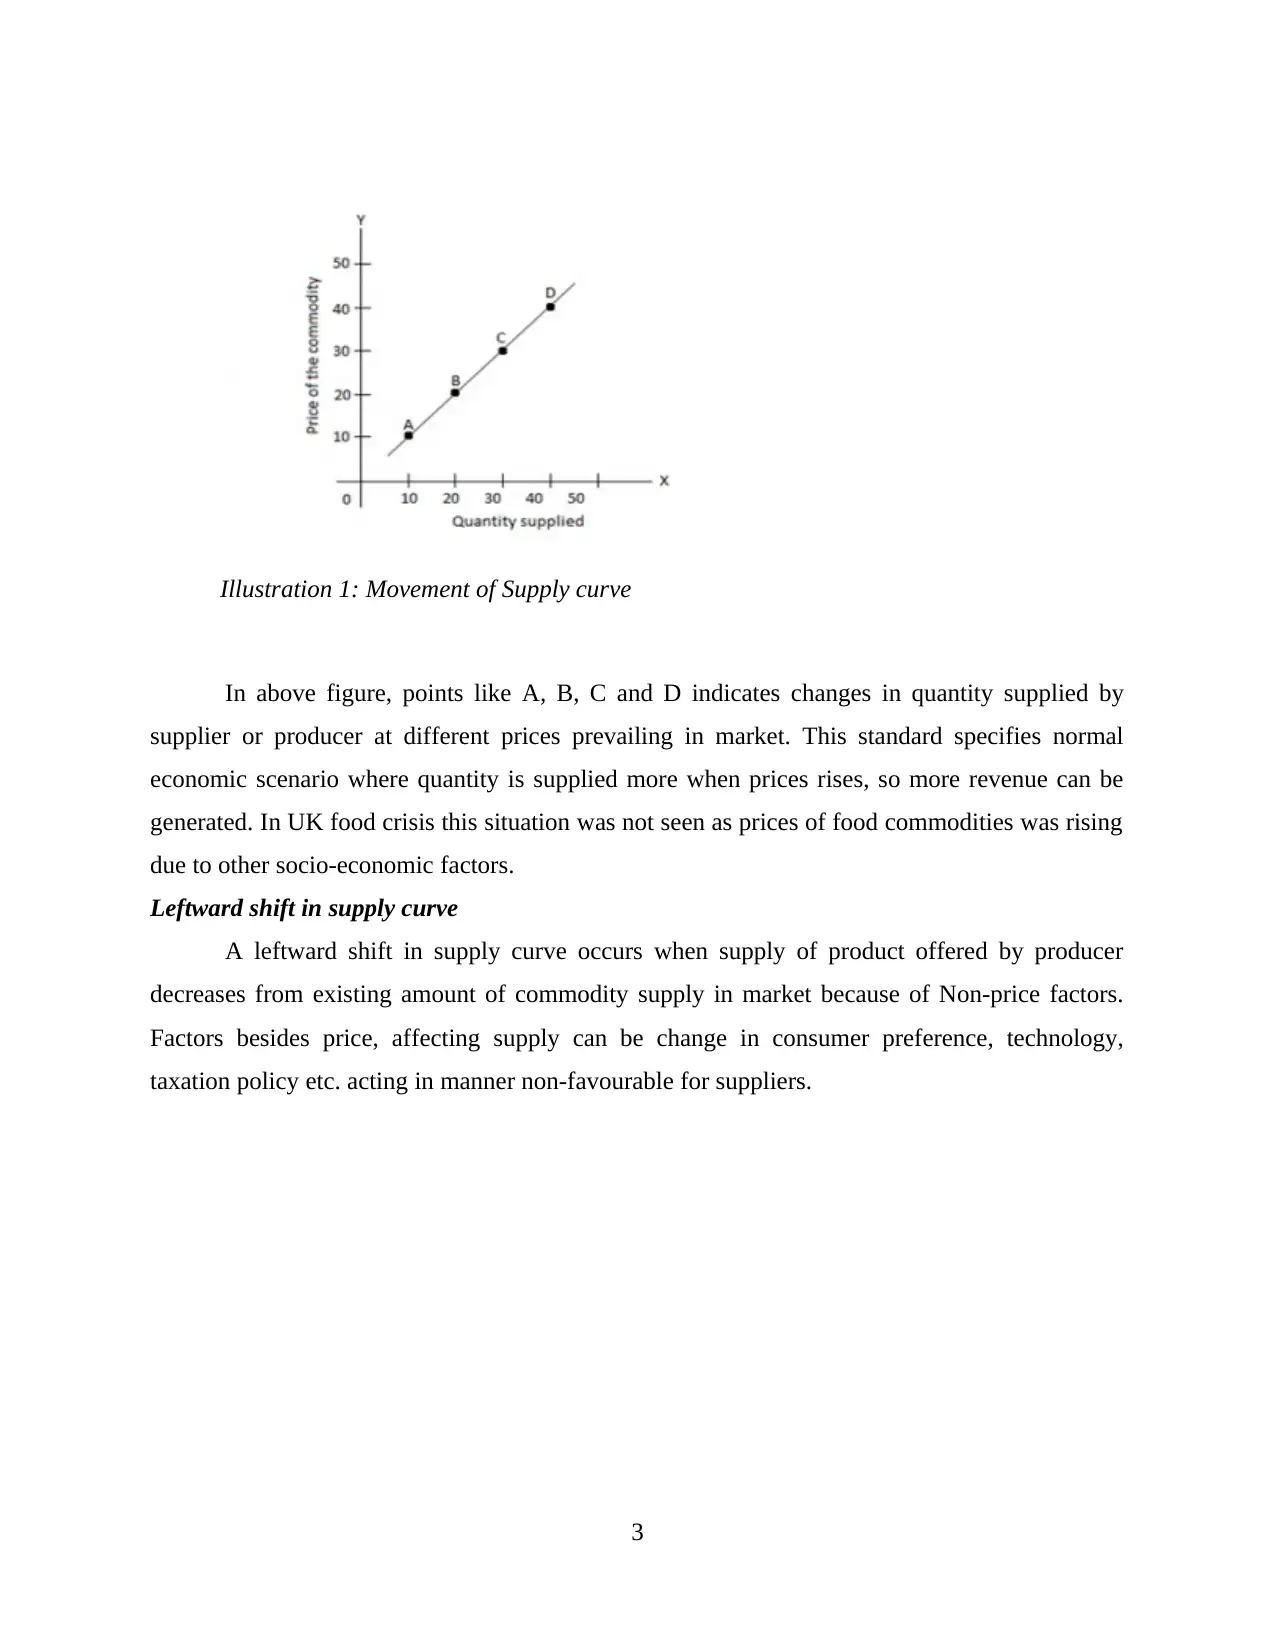
Above graph indicate leftward shift of supply curve, where supply is decreased from Q to
Q1 and the curve shifted inward form S to S1 at existing price of P only. As a result, whenever
this situation occurs, when supply decreases due to non-price factor, piece are seen eventually
rising. This is indicated by price P rising to P1.
This exact situation was confronted by UK in its food crisis of 2020. The supply of food
products in economy was affected by restricted movement of cargo from other countries,
especially from France which dominant supplier of fisheries for UK and other countries as well.
The situation triggered more when new strain of mutated SARS-COV 2 was detected in UK only
(Lang, 2020). Supplies of food products fell of inland suppliers which eventually affected market
supply and supply decreased even at existing price. Situation of decreased supply became more
critical when suppliers feared of deficit in future supplies as there were trade barriers. Therefore,
these suppliers opted for piling up food stocks, further permitted by government, to meet any
deficit needs of future. Hence, supply of food decreased more. However, demand of food
commodities in economy was all time high. Market forces of demand and supply played their
role and prices went up constantly in extraordinary manner.
4
Illustration 2: Leftward shift of Supply curve
Therefore, as per standards of economics studied by Krugman and Wells, situation that
erupted in UK at the time is reflected by leftward or inward shift in supply curve.
Rightward shift in Supply curve
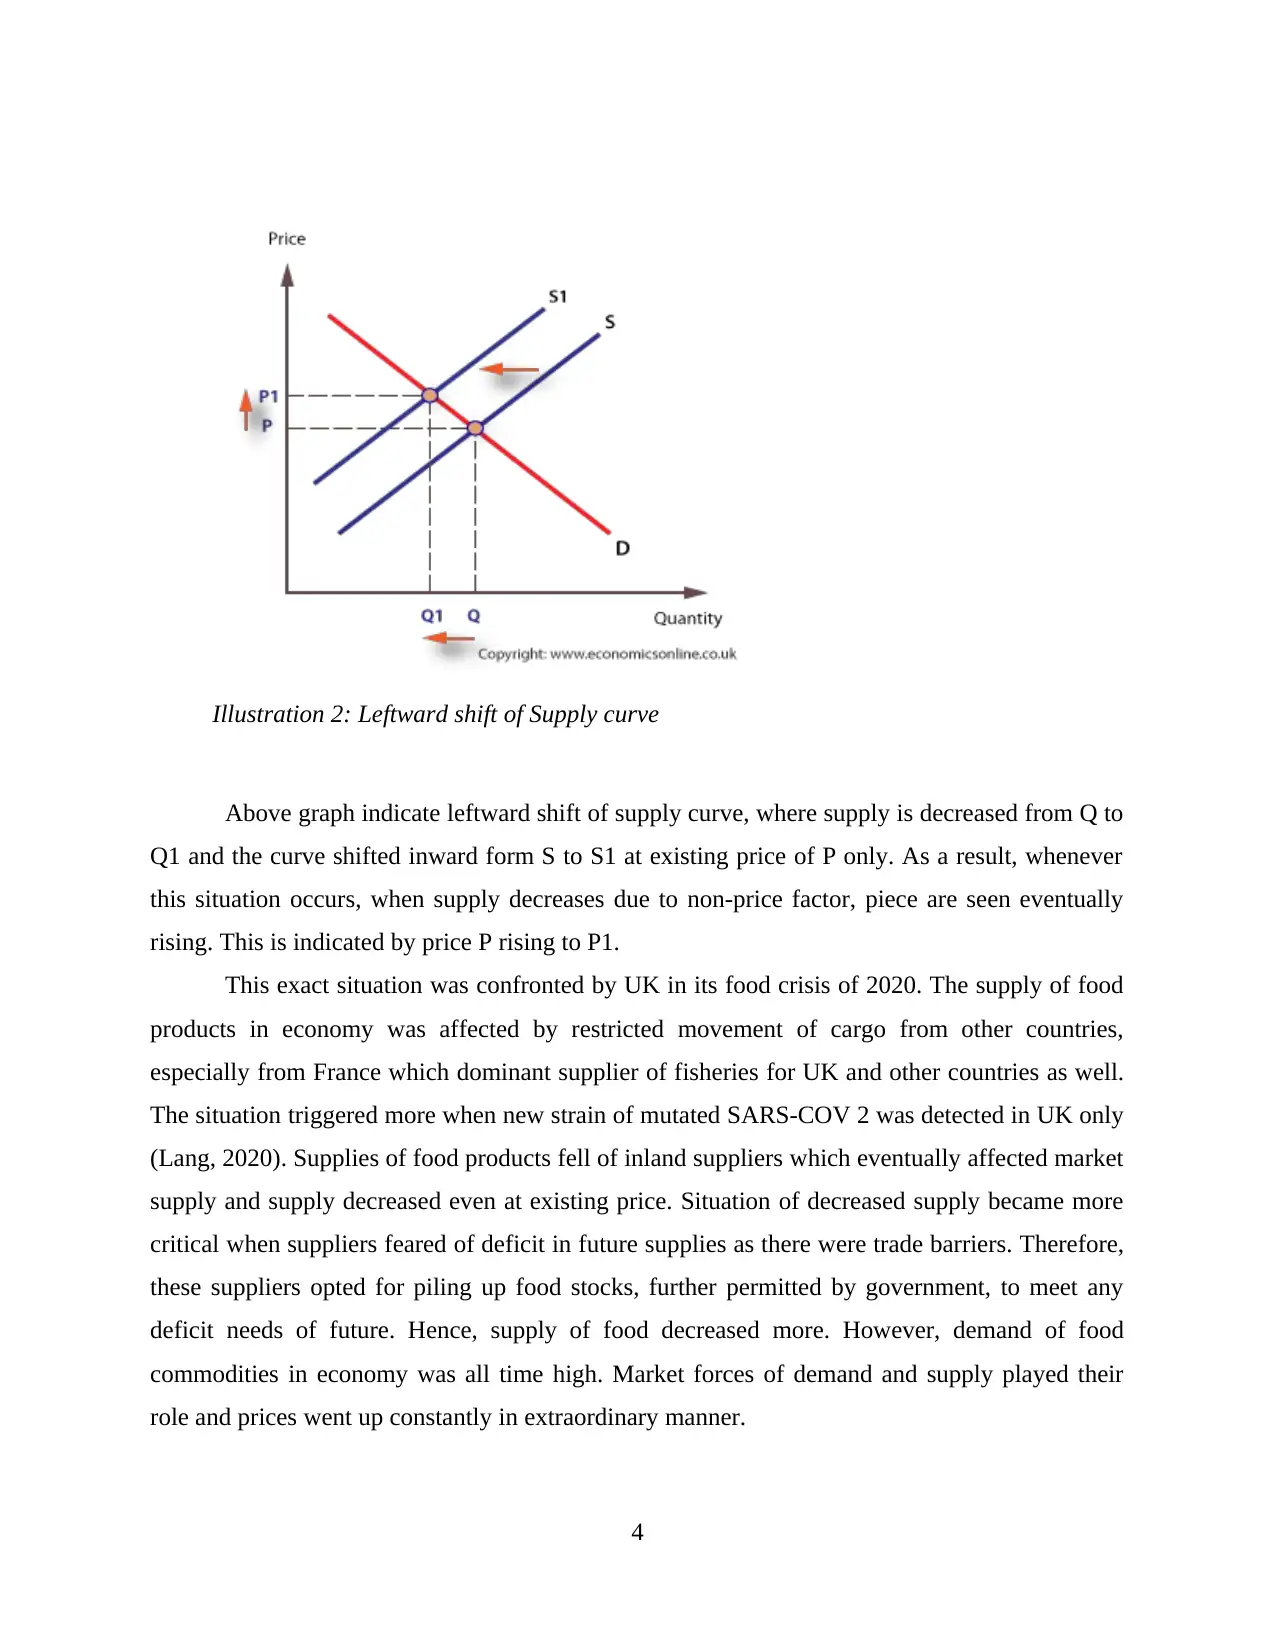
Rightward shift in supply curve points out at positive shift in supply curve. When non-
price factors affects supply and suppliers' sentiments in such way that they opt to increase supply
at existing prices as well. This is known as rightward or outward shift in supply curve. For
example taxes decreased by government leads to more income to people and they start buying
more even at existing price in market.
In the above graph, applying theories of Krugman and Wells, it is indicated that, when
prices were constant at P, even then supply have been increased to Q1 from Q, resulting in shift
of supply outwards from S to S1. Although, a later effect of this situation is that even if
procurements are made more at existing prices, prices will fall after some time, indicated by shift
in price from P to P1. This can be mainly to beat competition as well to increase revenue.
This situation do not pertain to crisis in UK as supplies are not rising but soaring.
However, this situation is feared when situation will normalise in economy, when piled up stocks
with suppliers would release at existing prices. But there will be not much demand to cater
supply and eventually prices may fall to level of deflation.
5
Illustration 3: Rightward shift of Supply curve
erupted in UK at the time is reflected by leftward or inward shift in supply curve.
Rightward shift in Supply curve
Rightward shift in supply curve points out at positive shift in supply curve. When non-
price factors affects supply and suppliers' sentiments in such way that they opt to increase supply
at existing prices as well. This is known as rightward or outward shift in supply curve. For
example taxes decreased by government leads to more income to people and they start buying
more even at existing price in market.
In the above graph, applying theories of Krugman and Wells, it is indicated that, when
prices were constant at P, even then supply have been increased to Q1 from Q, resulting in shift
of supply outwards from S to S1. Although, a later effect of this situation is that even if
procurements are made more at existing prices, prices will fall after some time, indicated by shift
in price from P to P1. This can be mainly to beat competition as well to increase revenue.
This situation do not pertain to crisis in UK as supplies are not rising but soaring.
However, this situation is feared when situation will normalise in economy, when piled up stocks
with suppliers would release at existing prices. But there will be not much demand to cater
supply and eventually prices may fall to level of deflation.
5
Illustration 3: Rightward shift of Supply curve
⊘ This is a preview!⊘
Do you want full access?
Subscribe today to unlock all pages.
Trusted by 1+ million students worldwide
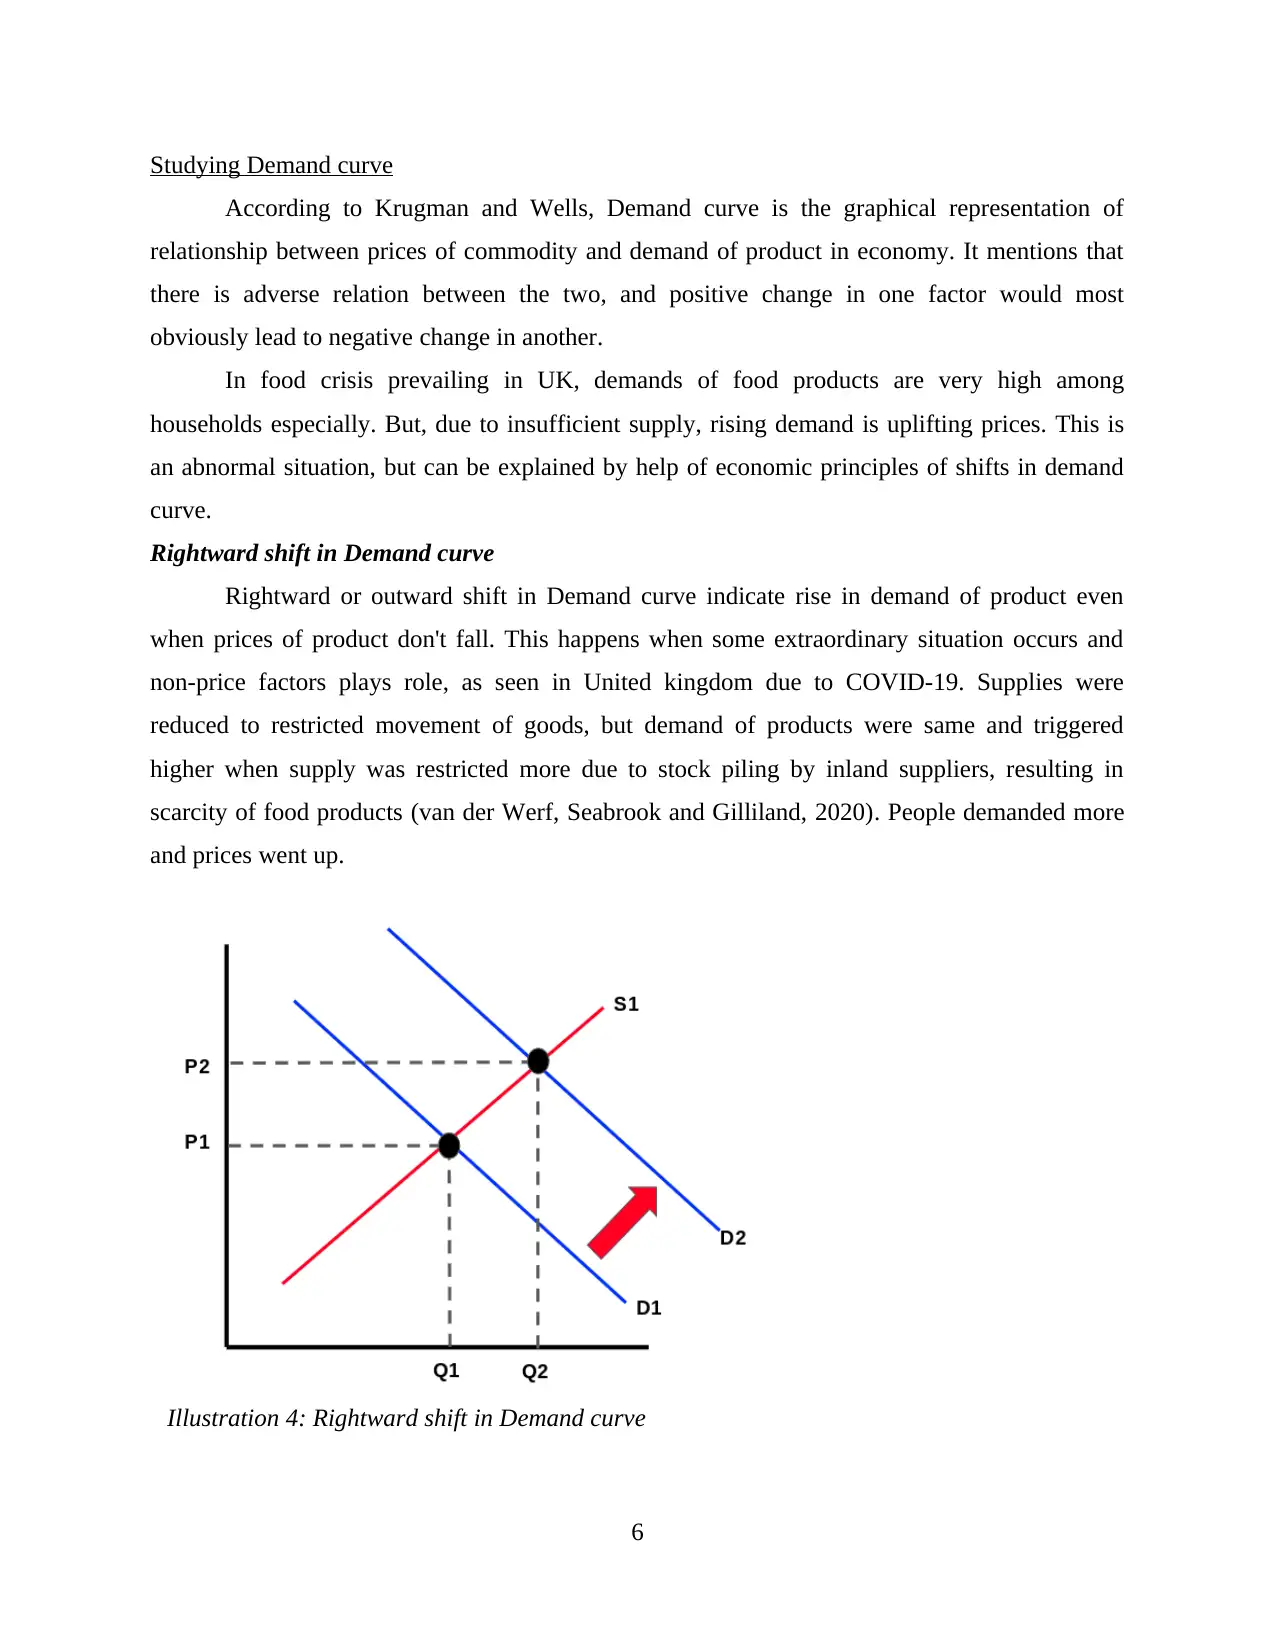
Studying Demand curve
According to Krugman and Wells, Demand curve is the graphical representation of
relationship between prices of commodity and demand of product in economy. It mentions that
there is adverse relation between the two, and positive change in one factor would most
obviously lead to negative change in another.
In food crisis prevailing in UK, demands of food products are very high among
households especially. But, due to insufficient supply, rising demand is uplifting prices. This is
an abnormal situation, but can be explained by help of economic principles of shifts in demand
curve.
Rightward shift in Demand curve
Rightward or outward shift in Demand curve indicate rise in demand of product even
when prices of product don't fall. This happens when some extraordinary situation occurs and
non-price factors plays role, as seen in United kingdom due to COVID-19. Supplies were
reduced to restricted movement of goods, but demand of products were same and triggered
higher when supply was restricted more due to stock piling by inland suppliers, resulting in
scarcity of food products (van der Werf, Seabrook and Gilliland, 2020). People demanded more
and prices went up.
6
Illustration 4: Rightward shift in Demand curve
Paraphrase This Document
Need a fresh take? Get an instant paraphrase of this document with our AI Paraphraser
As it is evident from above diagram, due to forces played by non-price factors demand
curve is seen shifting from D to D1 even when prices were constant at P. Due to effects of trade
barriers and stock piling by suppliers in UK, there was seen scarcity of food products whereas
demand was high and got higher, demand curve shifted.
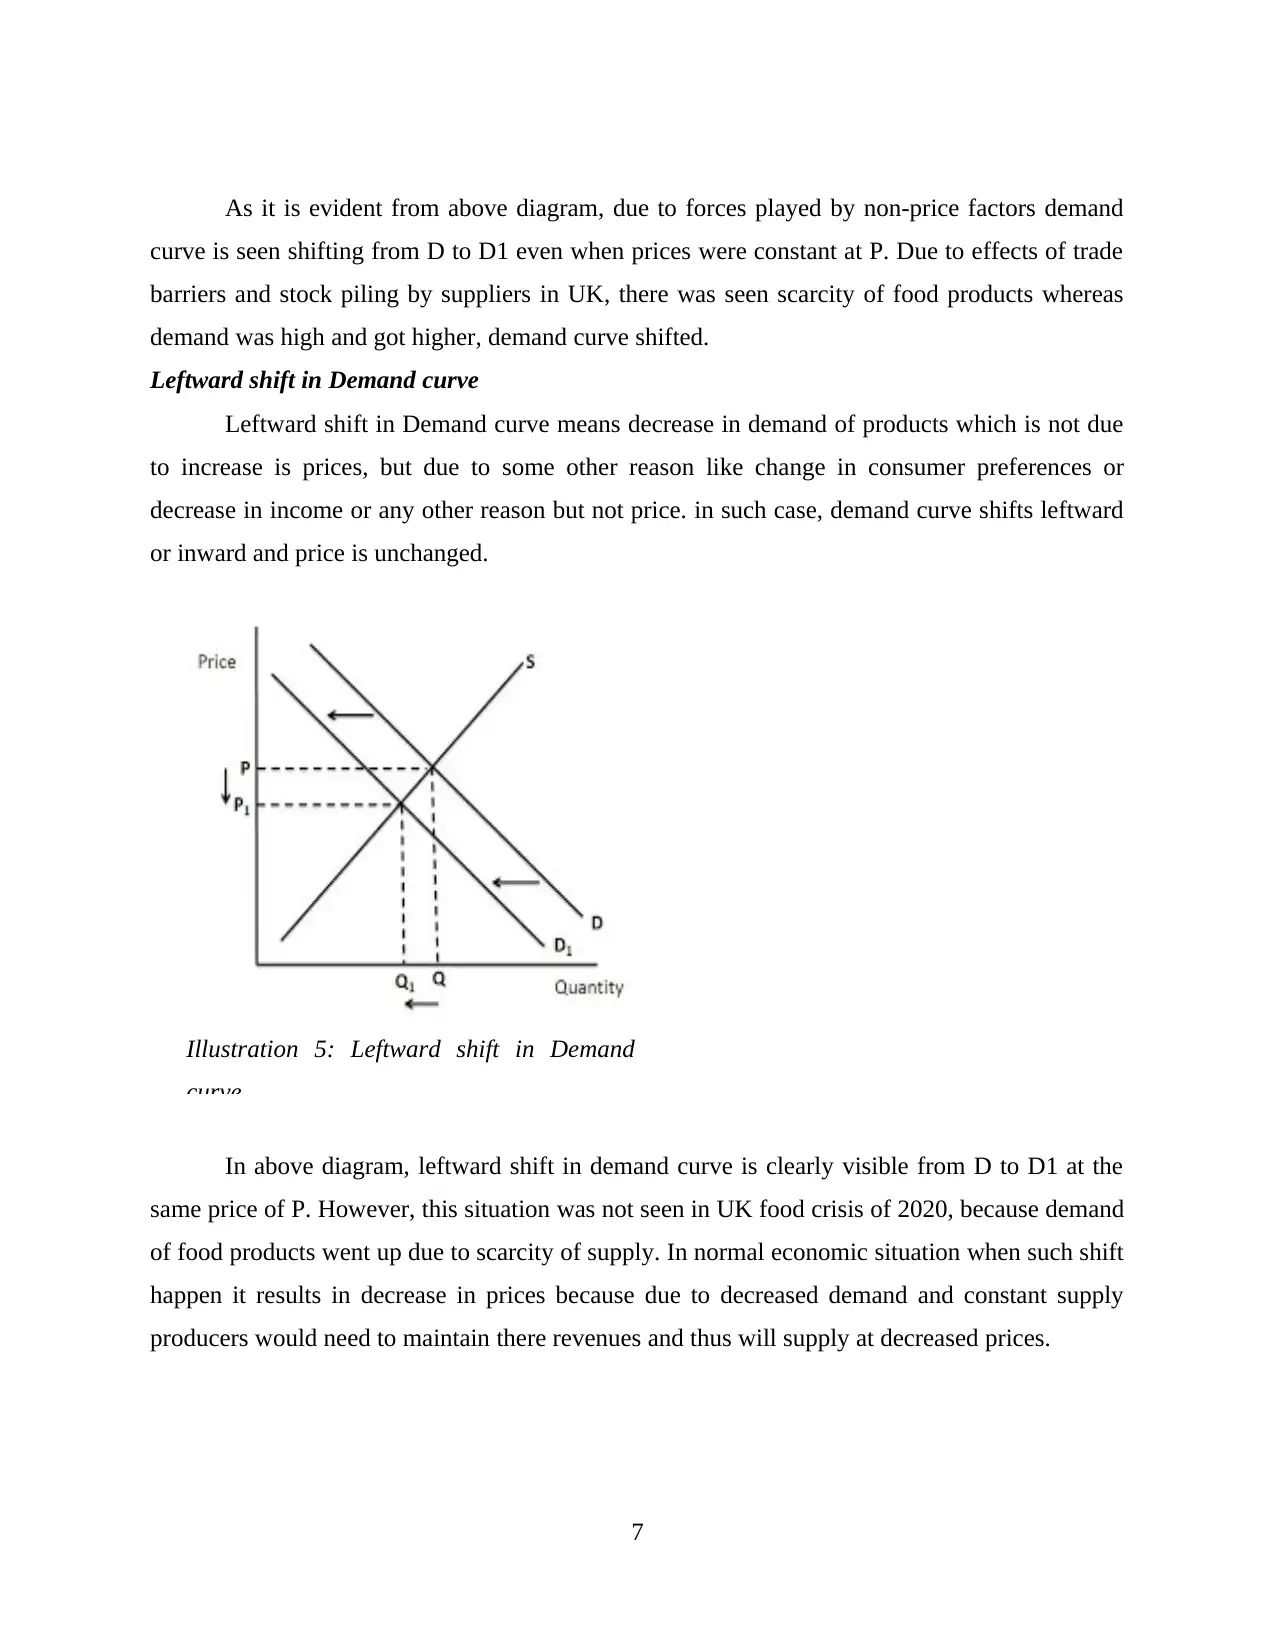
Leftward shift in Demand curve
Leftward shift in Demand curve means decrease in demand of products which is not due
to increase is prices, but due to some other reason like change in consumer preferences or
decrease in income or any other reason but not price. in such case, demand curve shifts leftward
or inward and price is unchanged.
In above diagram, leftward shift in demand curve is clearly visible from D to D1 at the
same price of P. However, this situation was not seen in UK food crisis of 2020, because demand
of food products went up due to scarcity of supply. In normal economic situation when such shift
happen it results in decrease in prices because due to decreased demand and constant supply
producers would need to maintain there revenues and thus will supply at decreased prices.
7
Illustration 5: Leftward shift in Demand
curve
curve is seen shifting from D to D1 even when prices were constant at P. Due to effects of trade
barriers and stock piling by suppliers in UK, there was seen scarcity of food products whereas
demand was high and got higher, demand curve shifted.
Leftward shift in Demand curve
Leftward shift in Demand curve means decrease in demand of products which is not due
to increase is prices, but due to some other reason like change in consumer preferences or
decrease in income or any other reason but not price. in such case, demand curve shifts leftward
or inward and price is unchanged.
In above diagram, leftward shift in demand curve is clearly visible from D to D1 at the
same price of P. However, this situation was not seen in UK food crisis of 2020, because demand
of food products went up due to scarcity of supply. In normal economic situation when such shift
happen it results in decrease in prices because due to decreased demand and constant supply
producers would need to maintain there revenues and thus will supply at decreased prices.
7
Illustration 5: Leftward shift in Demand
curve
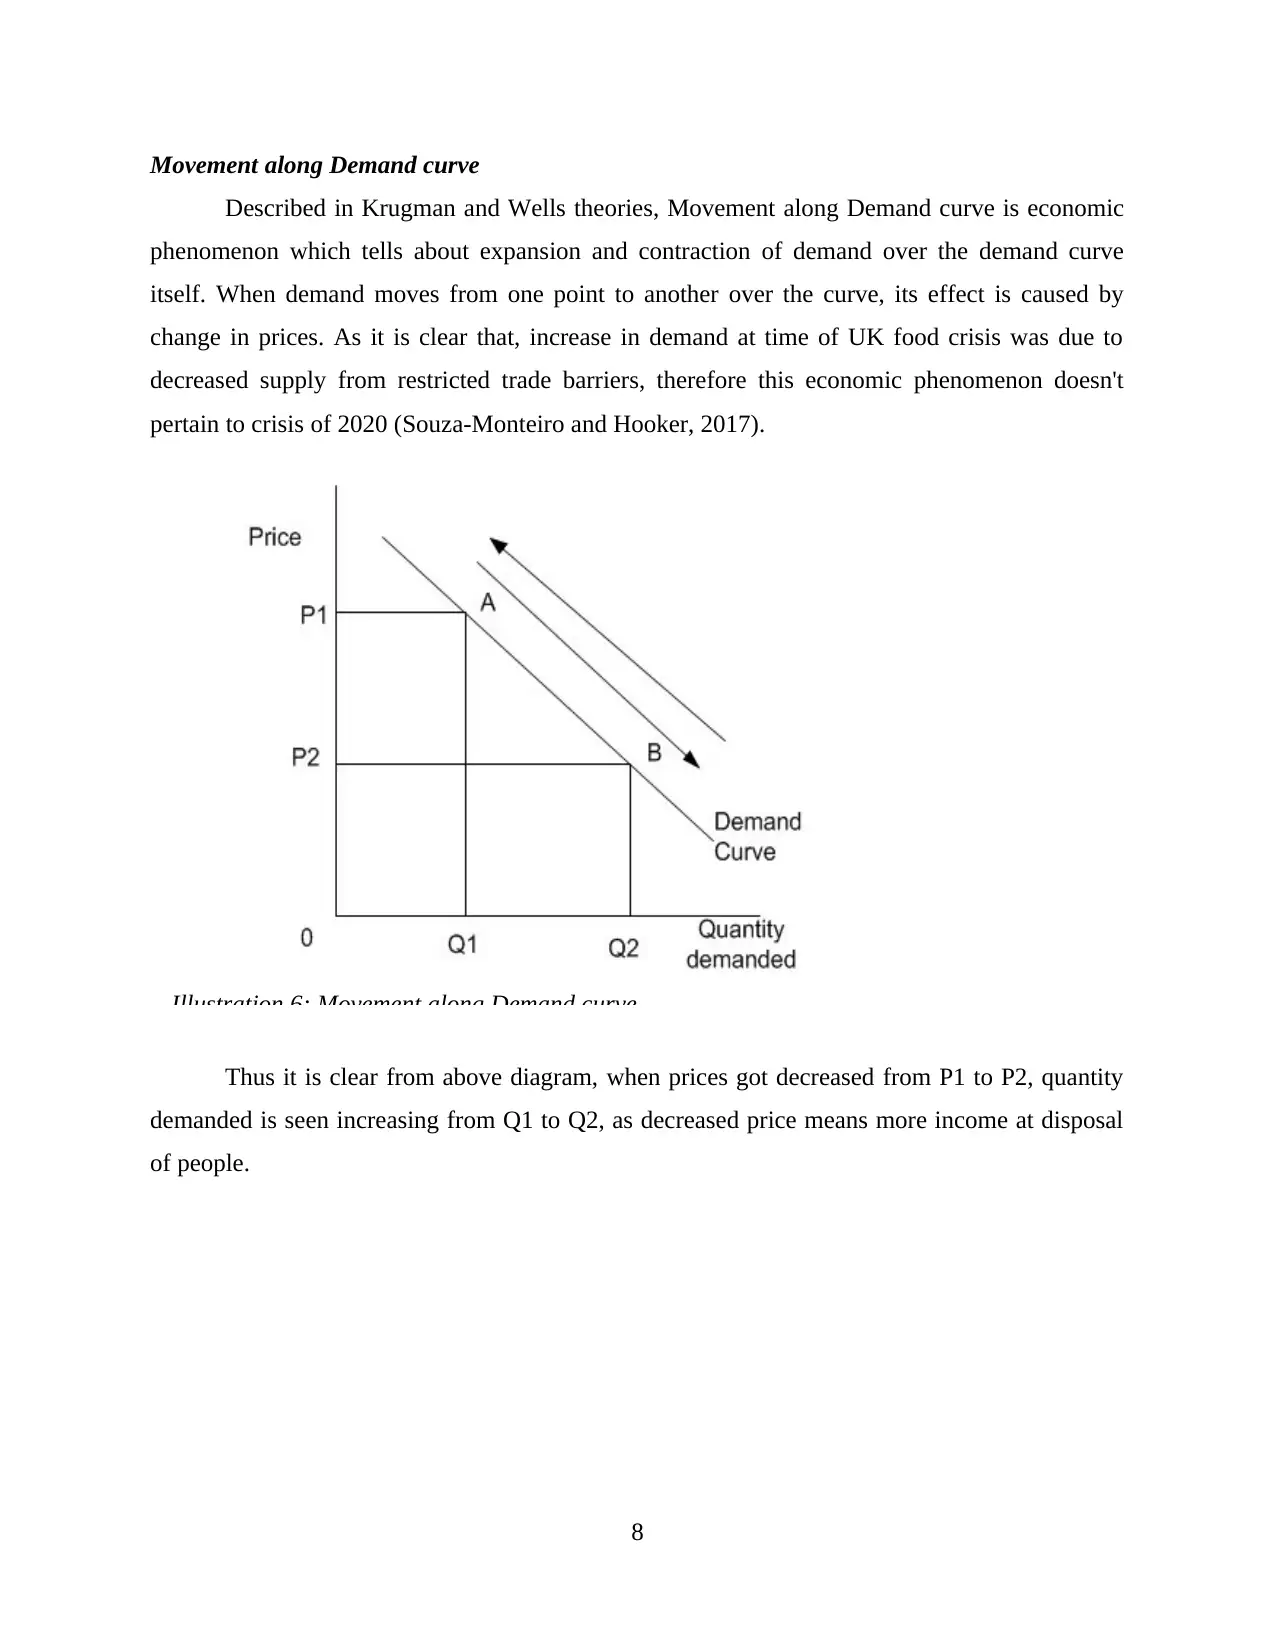
Movement along Demand curve
Described in Krugman and Wells theories, Movement along Demand curve is economic
phenomenon which tells about expansion and contraction of demand over the demand curve
itself. When demand moves from one point to another over the curve, its effect is caused by
change in prices. As it is clear that, increase in demand at time of UK food crisis was due to
decreased supply from restricted trade barriers, therefore this economic phenomenon doesn't
pertain to crisis of 2020 (Souza-Monteiro and Hooker, 2017).
Thus it is clear from above diagram, when prices got decreased from P1 to P2, quantity
demanded is seen increasing from Q1 to Q2, as decreased price means more income at disposal
of people.
8
Illustration 6: Movement along Demand curve
⊘ This is a preview!⊘
Do you want full access?
Subscribe today to unlock all pages.
Trusted by 1+ million students worldwide
1 out of 18
Related Documents


Your All-in-One AI-Powered Toolkit for Academic Success.
+13062052269
info@desklib.com
Available 24*7 on WhatsApp / Email
![[object Object]](/_next/static/media/star-bottom.7253800d.svg)
Unlock your academic potential
Copyright © 2020–2026 A2Z Services. All Rights Reserved. Developed and managed by ZUCOL.