Performance Evaluation: Business Accounting & Finance Report
VerifiedAdded on 2024/05/16
|18
|3595
|148
Report
AI Summary
This report provides a detailed analysis of the financial performance of three major gambling companies in the UK: Paddy Power Betfair Plc, William Hill Plc, and Ladbrokes Coral Group Plc. It employs various financial ratios, including profitability, operational, liquidity, and structure ratios, alongside non-financial ratios like profit per employee and average cost per employee, to assess and compare the companies' performance. The analysis identifies Paddy Power Betfair PLC as the best-performing company due to its strong financial and non-financial metrics, while Ladbrokes Coral Group Plc is identified as the poorest performer. Furthermore, the report discusses the critical stages in capital investment decision-making and the role of investment appraisal, highlighting key methods such as Discounted Cash Flow (DCF) analysis.

AS 1 - BUSINESS ACCOUNTING AND FINANCE FOR MANAGERS
1
1
Paraphrase This Document
Need a fresh take? Get an instant paraphrase of this document with our AI Paraphraser
Table of Contents
Introduction................................................................................................................................3
Section A – Question 1..............................................................................................................4
(a) Selection and justification of at least 10 financial ratios and calculate 2 non-financial
ratios to analyse the performance and financial position of the three companies......................4
(b) Identification of the best performing company in the industry..........................................11
(c) Identification of the most poorly performing company in the industry..............................12
Section B – Question 2.............................................................................................................13
(a) Identify and explain the key stages in the capital investment decision-making process, and
the role of investment appraisal in this process.......................................................................14
(b) Identify and explain the main methods of investment appraisal used in practice (including
DCF), use numerical examples to help illustrate the key aspects............................................15
Conclusion................................................................................................................................17
Reference list............................................................................................................................18
2
Introduction
Measurement and analysis of performance is important for every industry. There are different
tools that can be used by an industry in order to measure and control its performance. Ratio
analysis is one such tool that helps in measuring the performance of a company or an
industry. This report evaluates the performance of the three big companies in the gambling
industry in UK, which are Paddy Power Betfair Plc, William Hill Plc and Ladbrokes Coral
Group Plc. This industry is one of the key players that contribute a major portion of the
revenue of the UK economy. The report also contains the evaluation of the importance of
investment appraisal in order make decisions such as capital investment. It also discusses
about the investment appraisal techniques that can be used in a company.
3
⊘ This is a preview!⊘
Do you want full access?
Subscribe today to unlock all pages.
Trusted by 1+ million students worldwide
Section A – Question 1
(a) Selection and justification of at least 10 financial ratios and calculate 2 non-financial
ratios to analyse the performance and financial position of the three companies
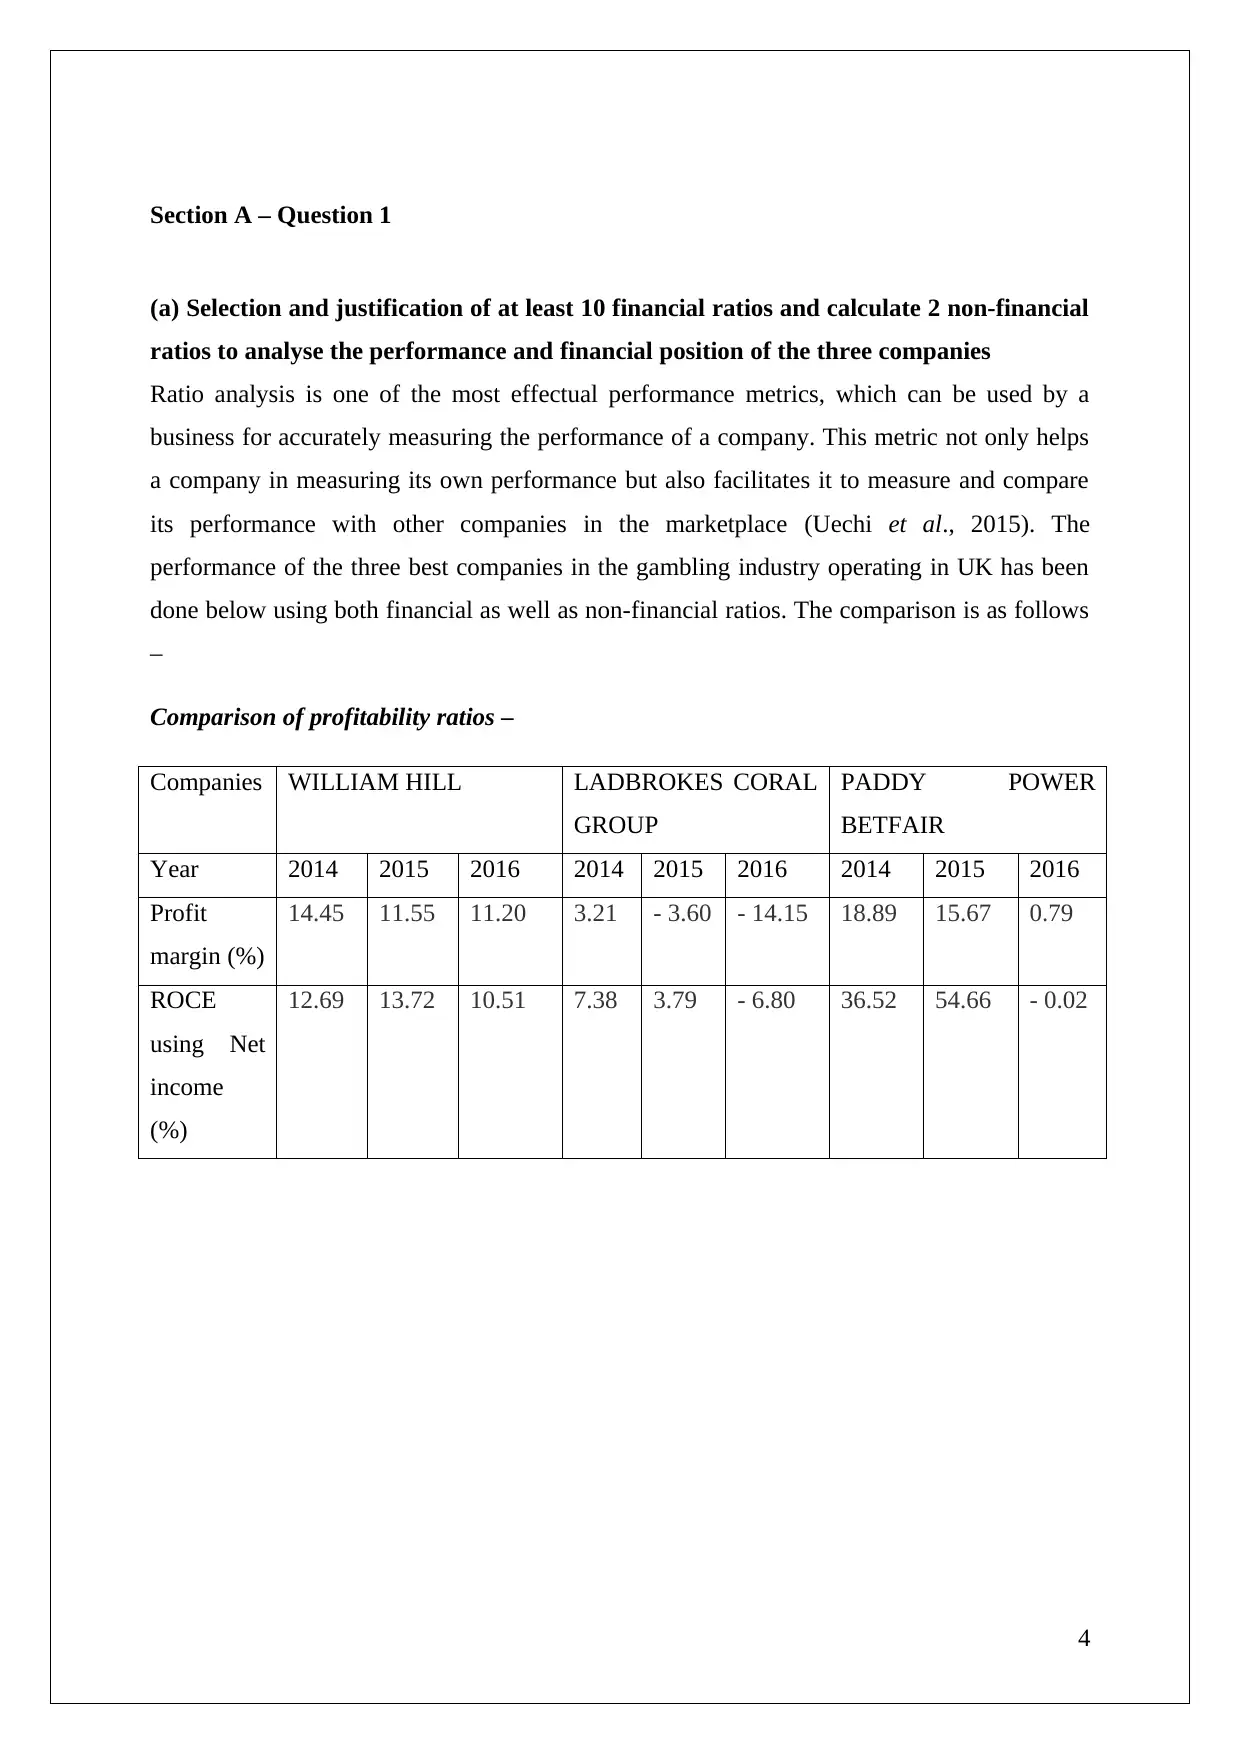
Ratio analysis is one of the most effectual performance metrics, which can be used by a
business for accurately measuring the performance of a company. This metric not only helps
a company in measuring its own performance but also facilitates it to measure and compare
its performance with other companies in the marketplace (Uechi et al., 2015). The
performance of the three best companies in the gambling industry operating in UK has been
done below using both financial as well as non-financial ratios. The comparison is as follows
–
Comparison of profitability ratios –
Companies WILLIAM HILL LADBROKES CORAL
GROUP
PADDY POWER
BETFAIR
Year 2014 2015 2016 2014 2015 2016 2014 2015 2016
Profit
margin (%)
14.45 11.55 11.20 3.21 - 3.60 - 14.15 18.89 15.67 0.79
ROCE
using Net
income
(%)
12.69 13.72 10.51 7.38 3.79 - 6.80 36.52 54.66 - 0.02
4
(a) Selection and justification of at least 10 financial ratios and calculate 2 non-financial
ratios to analyse the performance and financial position of the three companies
Ratio analysis is one of the most effectual performance metrics, which can be used by a
business for accurately measuring the performance of a company. This metric not only helps
a company in measuring its own performance but also facilitates it to measure and compare
its performance with other companies in the marketplace (Uechi et al., 2015). The
performance of the three best companies in the gambling industry operating in UK has been
done below using both financial as well as non-financial ratios. The comparison is as follows
–
Comparison of profitability ratios –
Companies WILLIAM HILL LADBROKES CORAL
GROUP
PADDY POWER
BETFAIR
Year 2014 2015 2016 2014 2015 2016 2014 2015 2016
Profit
margin (%)
14.45 11.55 11.20 3.21 - 3.60 - 14.15 18.89 15.67 0.79
ROCE
using Net
income
(%)
12.69 13.72 10.51 7.38 3.79 - 6.80 36.52 54.66 - 0.02
4
Paraphrase This Document
Need a fresh take? Get an instant paraphrase of this document with our AI Paraphraser
2016
2015
2014
2016
2015
2014
2016
2015
2014
WILLIAM HILL PLC LADBROKES CORAL
GROUP PLC PADDY POWER
BETFAIR PUBLIC
LIMITED COMPANY
-20.00
-10.00
0.00
10.00
20.00
30.00
40.00
50.00
60.00
Profit margin (%)
ROCE using Net income (%)
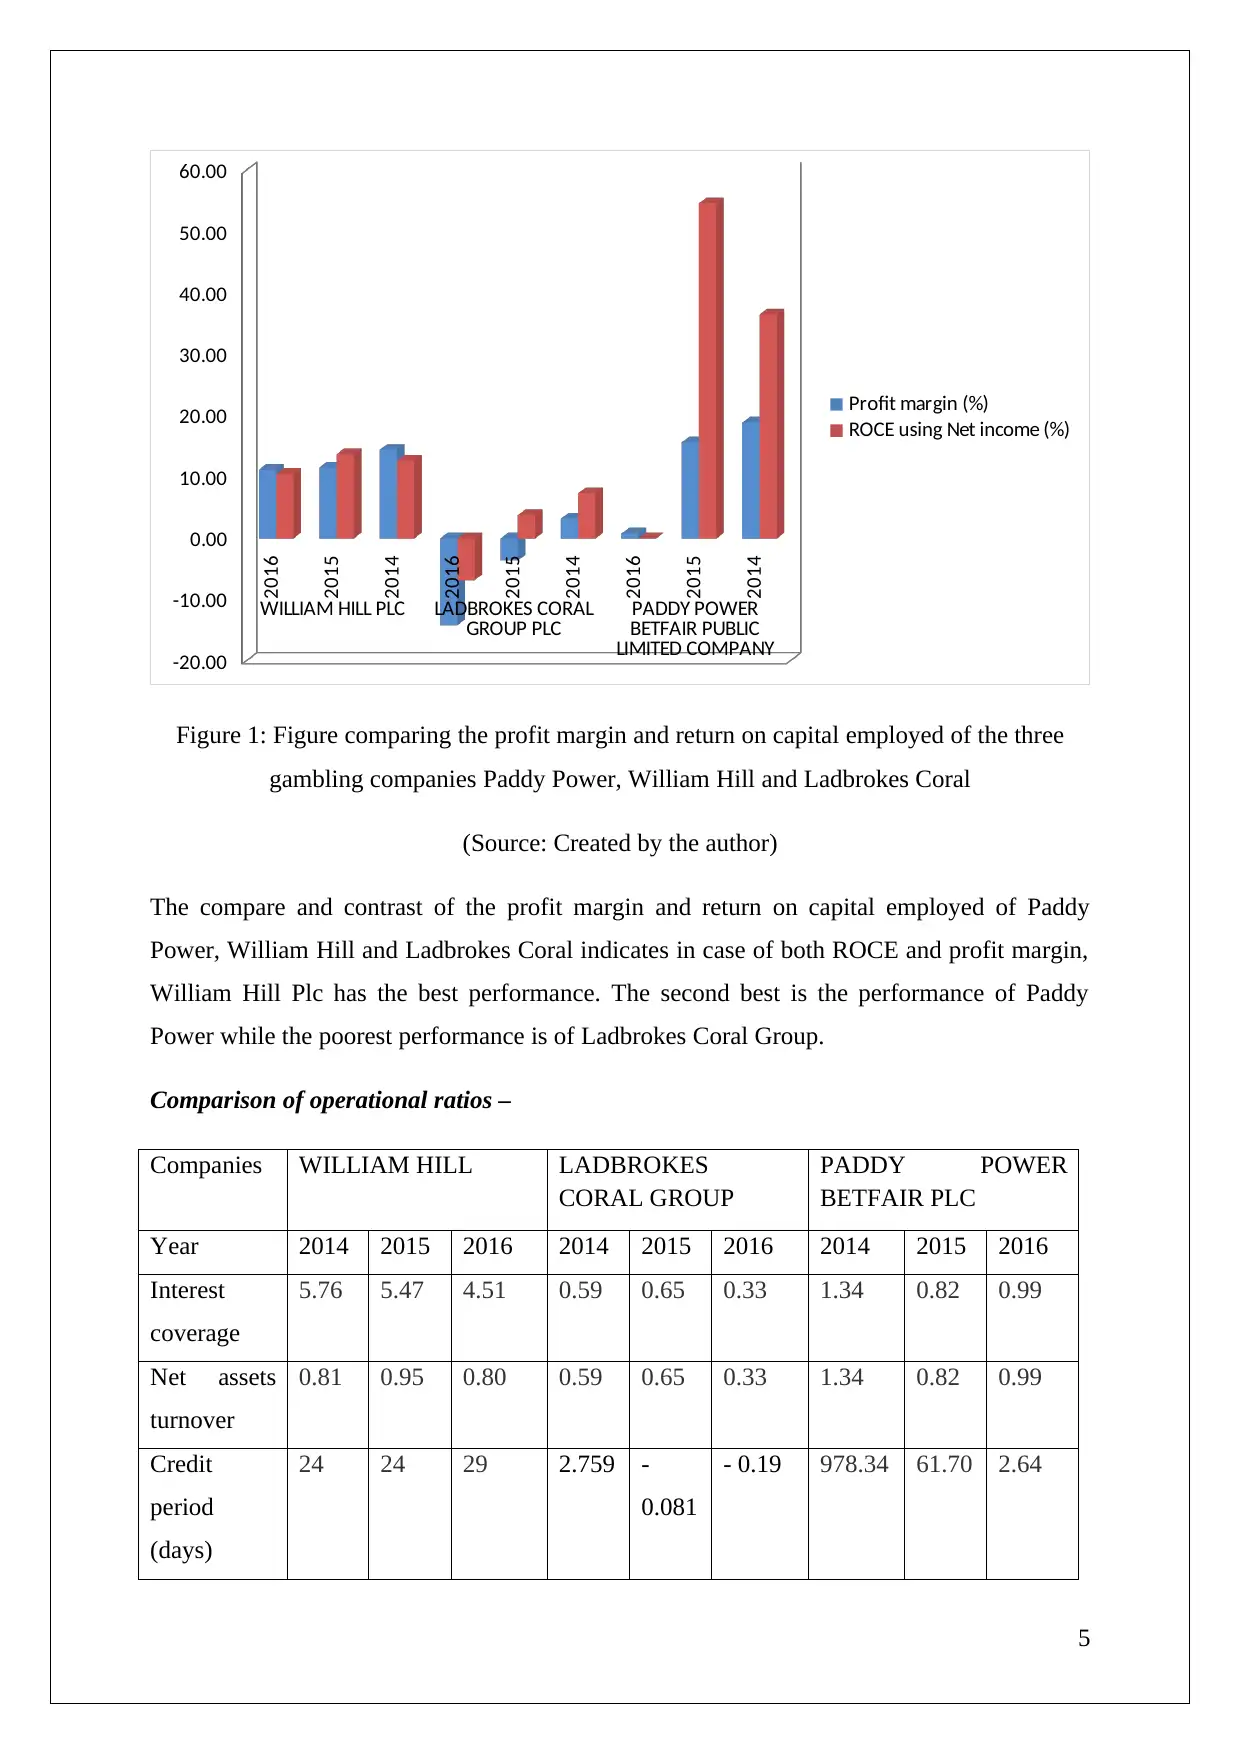
Figure 1: Figure comparing the profit margin and return on capital employed of the three
gambling companies Paddy Power, William Hill and Ladbrokes Coral
(Source: Created by the author)
The compare and contrast of the profit margin and return on capital employed of Paddy
Power, William Hill and Ladbrokes Coral indicates in case of both ROCE and profit margin,
William Hill Plc has the best performance. The second best is the performance of Paddy
Power while the poorest performance is of Ladbrokes Coral Group.
Comparison of operational ratios –
Companies WILLIAM HILL LADBROKES
CORAL GROUP
PADDY POWER
BETFAIR PLC
Year 2014 2015 2016 2014 2015 2016 2014 2015 2016
Interest
coverage
5.76 5.47 4.51 0.59 0.65 0.33 1.34 0.82 0.99
Net assets
turnover
0.81 0.95 0.80 0.59 0.65 0.33 1.34 0.82 0.99
Credit
period
(days)
24 24 29 2.759 -
0.081
- 0.19 978.34 61.70 2.64
5
2015
2014
2016
2015
2014
2016
2015
2014
WILLIAM HILL PLC LADBROKES CORAL
GROUP PLC PADDY POWER
BETFAIR PUBLIC
LIMITED COMPANY
-20.00
-10.00
0.00
10.00
20.00
30.00
40.00
50.00
60.00
Profit margin (%)
ROCE using Net income (%)
Figure 1: Figure comparing the profit margin and return on capital employed of the three
gambling companies Paddy Power, William Hill and Ladbrokes Coral
(Source: Created by the author)
The compare and contrast of the profit margin and return on capital employed of Paddy
Power, William Hill and Ladbrokes Coral indicates in case of both ROCE and profit margin,
William Hill Plc has the best performance. The second best is the performance of Paddy
Power while the poorest performance is of Ladbrokes Coral Group.
Comparison of operational ratios –
Companies WILLIAM HILL LADBROKES
CORAL GROUP
PADDY POWER
BETFAIR PLC
Year 2014 2015 2016 2014 2015 2016 2014 2015 2016
Interest
coverage
5.76 5.47 4.51 0.59 0.65 0.33 1.34 0.82 0.99
Net assets
turnover
0.81 0.95 0.80 0.59 0.65 0.33 1.34 0.82 0.99
Credit
period
(days)
24 24 29 2.759 -
0.081
- 0.19 978.34 61.70 2.64
5
Collection
period
(days)
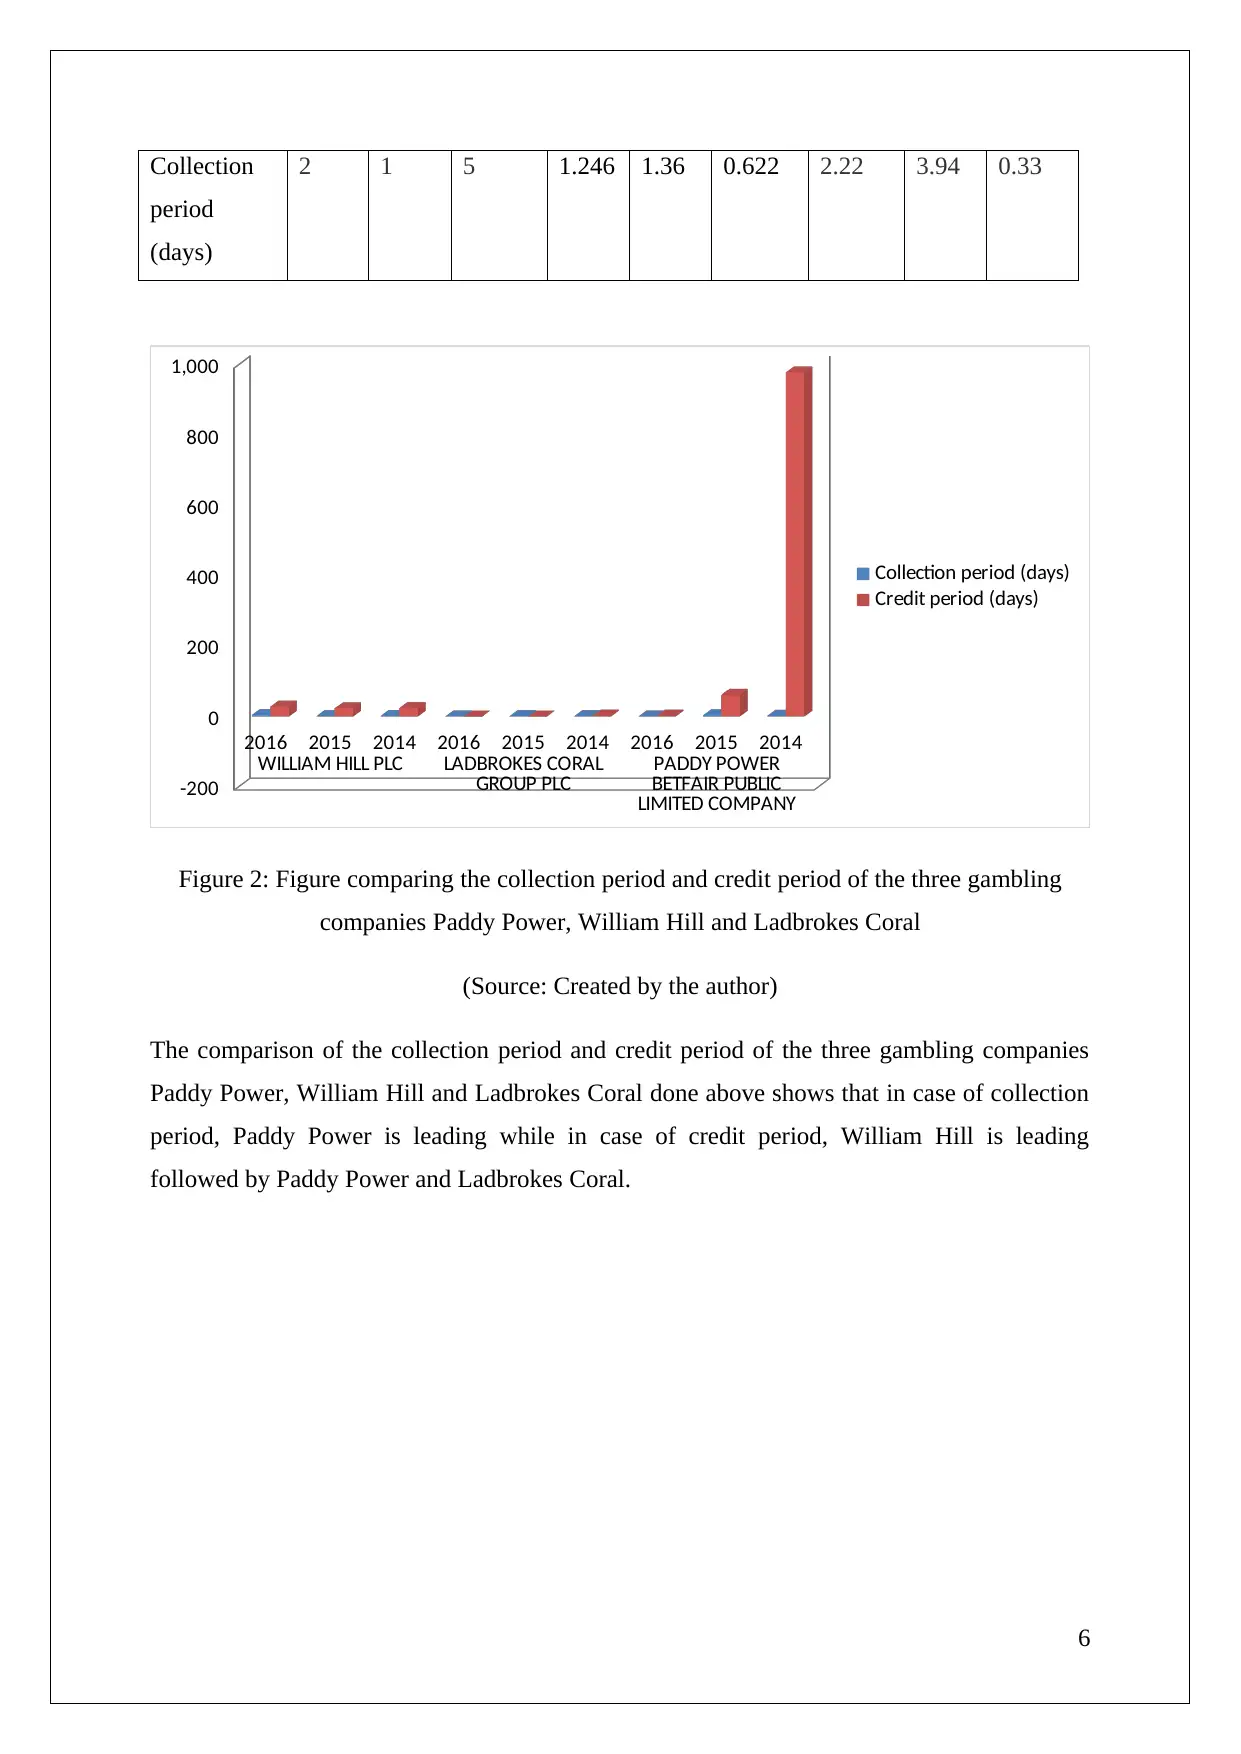
2 1 5 1.246 1.36 0.622 2.22 3.94 0.33
2016 2015 2014 2016 2015 2014 2016 2015 2014
WILLIAM HILL PLC LADBROKES CORAL
GROUP PLC PADDY POWER
BETFAIR PUBLIC
LIMITED COMPANY
-200
0
200
400
600
800
1,000
Collection period (days)
Credit period (days)
Figure 2: Figure comparing the collection period and credit period of the three gambling
companies Paddy Power, William Hill and Ladbrokes Coral
(Source: Created by the author)
The comparison of the collection period and credit period of the three gambling companies
Paddy Power, William Hill and Ladbrokes Coral done above shows that in case of collection
period, Paddy Power is leading while in case of credit period, William Hill is leading
followed by Paddy Power and Ladbrokes Coral.
6
period
(days)
2 1 5 1.246 1.36 0.622 2.22 3.94 0.33
2016 2015 2014 2016 2015 2014 2016 2015 2014
WILLIAM HILL PLC LADBROKES CORAL
GROUP PLC PADDY POWER
BETFAIR PUBLIC
LIMITED COMPANY
-200
0
200
400
600
800
1,000
Collection period (days)
Credit period (days)
Figure 2: Figure comparing the collection period and credit period of the three gambling
companies Paddy Power, William Hill and Ladbrokes Coral
(Source: Created by the author)
The comparison of the collection period and credit period of the three gambling companies
Paddy Power, William Hill and Ladbrokes Coral done above shows that in case of collection
period, Paddy Power is leading while in case of credit period, William Hill is leading
followed by Paddy Power and Ladbrokes Coral.
6
⊘ This is a preview!⊘
Do you want full access?
Subscribe today to unlock all pages.
Trusted by 1+ million students worldwide
2016 2015 2014 2016 2015 2014 2016 2015 2014
WILLIAM HILL PLC LADBROKES CORAL
GROUP PLC PADDY POWER
BETFAIR PUBLIC
LIMITED COMPANY
0.00
1.00
2.00
3.00
4.00
5.00
6.00
Net assets turnover (x)
Interest cover (x)
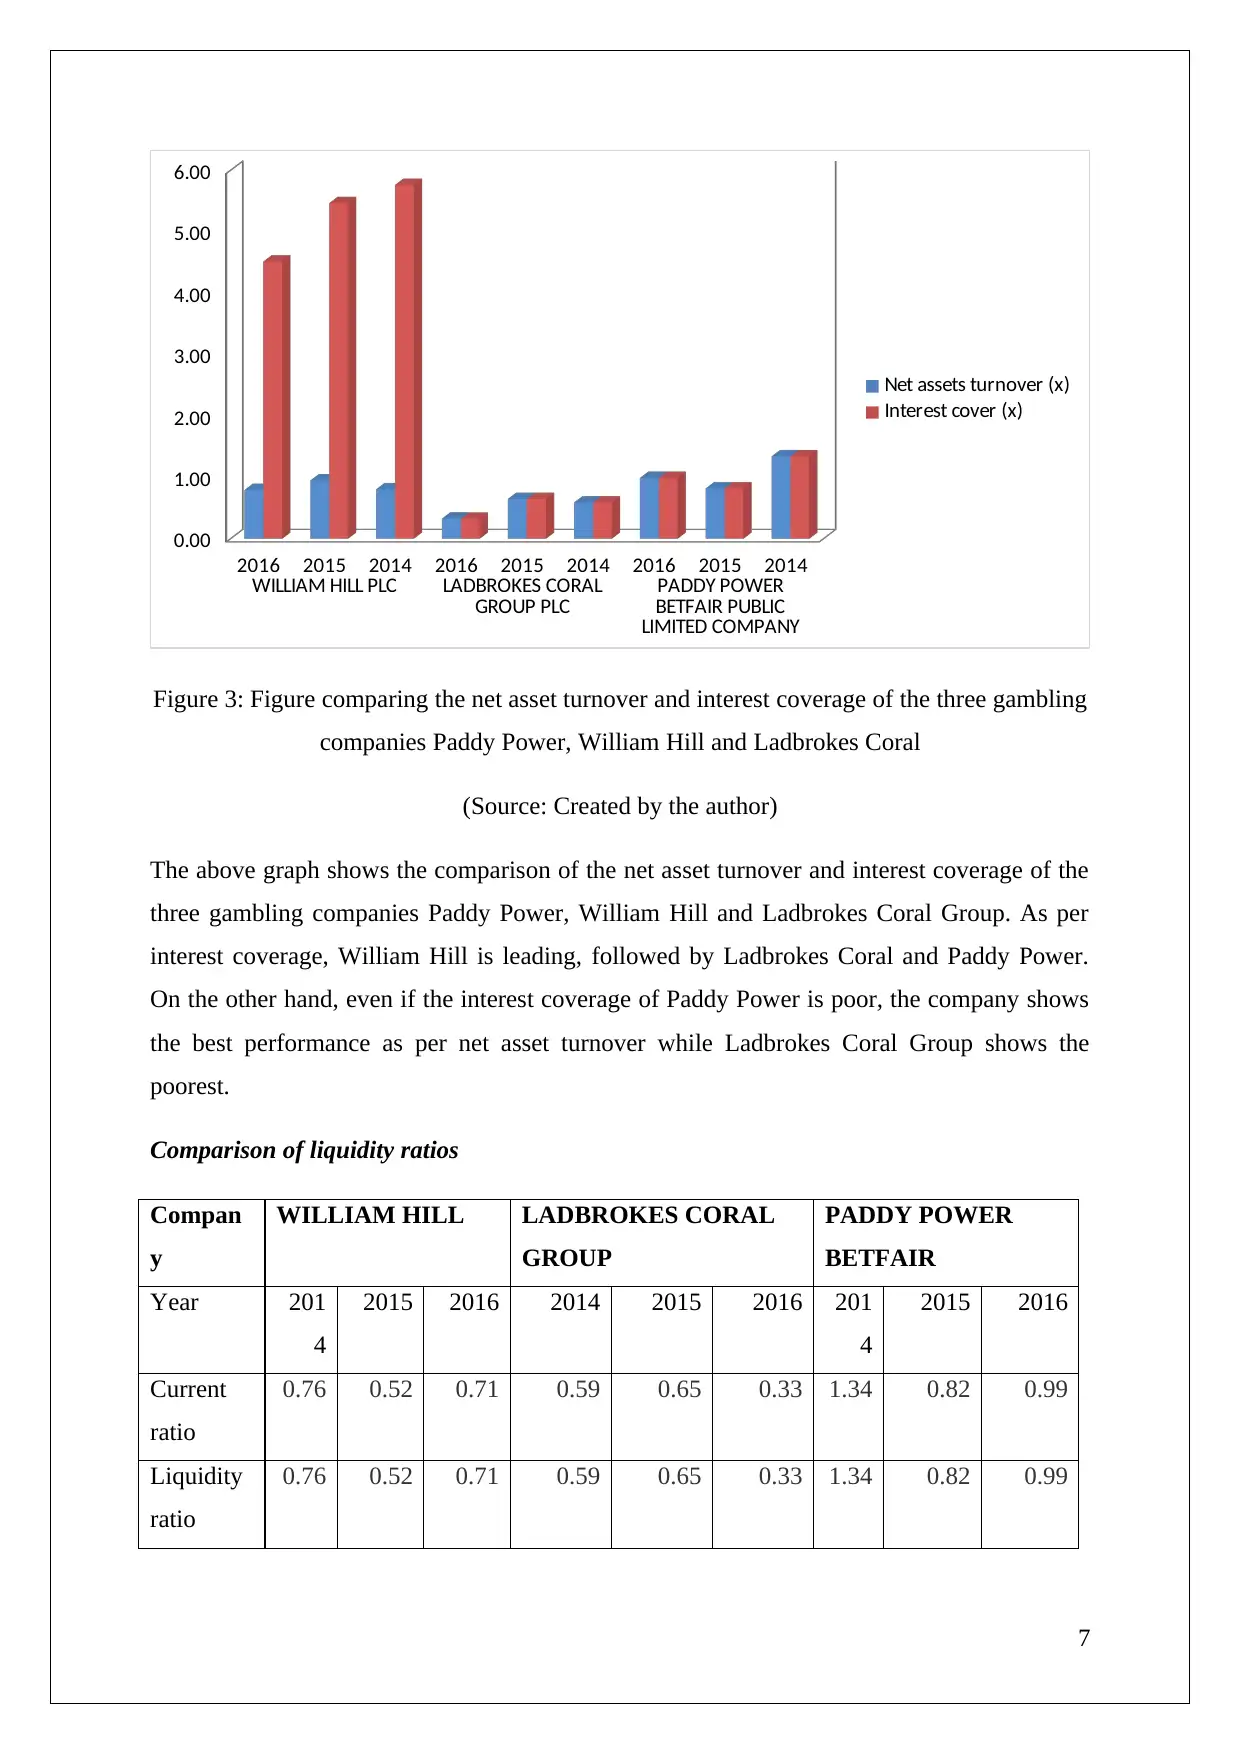
Figure 3: Figure comparing the net asset turnover and interest coverage of the three gambling
companies Paddy Power, William Hill and Ladbrokes Coral
(Source: Created by the author)
The above graph shows the comparison of the net asset turnover and interest coverage of the
three gambling companies Paddy Power, William Hill and Ladbrokes Coral Group. As per
interest coverage, William Hill is leading, followed by Ladbrokes Coral and Paddy Power.
On the other hand, even if the interest coverage of Paddy Power is poor, the company shows
the best performance as per net asset turnover while Ladbrokes Coral Group shows the
poorest.
Comparison of liquidity ratios
Compan
y
WILLIAM HILL LADBROKES CORAL
GROUP
PADDY POWER
BETFAIR
Year 201
4
2015 2016 2014 2015 2016 201
4
2015 2016
Current
ratio
0.76 0.52 0.71 0.59 0.65 0.33 1.34 0.82 0.99
Liquidity
ratio
0.76 0.52 0.71 0.59 0.65 0.33 1.34 0.82 0.99
7
WILLIAM HILL PLC LADBROKES CORAL
GROUP PLC PADDY POWER
BETFAIR PUBLIC
LIMITED COMPANY
0.00
1.00
2.00
3.00
4.00
5.00
6.00
Net assets turnover (x)
Interest cover (x)
Figure 3: Figure comparing the net asset turnover and interest coverage of the three gambling
companies Paddy Power, William Hill and Ladbrokes Coral
(Source: Created by the author)
The above graph shows the comparison of the net asset turnover and interest coverage of the
three gambling companies Paddy Power, William Hill and Ladbrokes Coral Group. As per
interest coverage, William Hill is leading, followed by Ladbrokes Coral and Paddy Power.
On the other hand, even if the interest coverage of Paddy Power is poor, the company shows
the best performance as per net asset turnover while Ladbrokes Coral Group shows the
poorest.
Comparison of liquidity ratios
Compan
y
WILLIAM HILL LADBROKES CORAL
GROUP
PADDY POWER
BETFAIR
Year 201
4
2015 2016 2014 2015 2016 201
4
2015 2016
Current
ratio
0.76 0.52 0.71 0.59 0.65 0.33 1.34 0.82 0.99
Liquidity
ratio
0.76 0.52 0.71 0.59 0.65 0.33 1.34 0.82 0.99
7
Paraphrase This Document
Need a fresh take? Get an instant paraphrase of this document with our AI Paraphraser
2016 2015 2014 2016 2015 2014 2016 2015 2014
WILLIAM HILL PLC LADBROKES CORAL
GROUP PLC PADDY POWER BETFAIR
PUBLIC LIMITED
COMPANY
0.00
0.20
0.40
0.60
0.80
1.00
1.20
1.40
1.60
Current ratio (x)
Liquidity ratio (x)
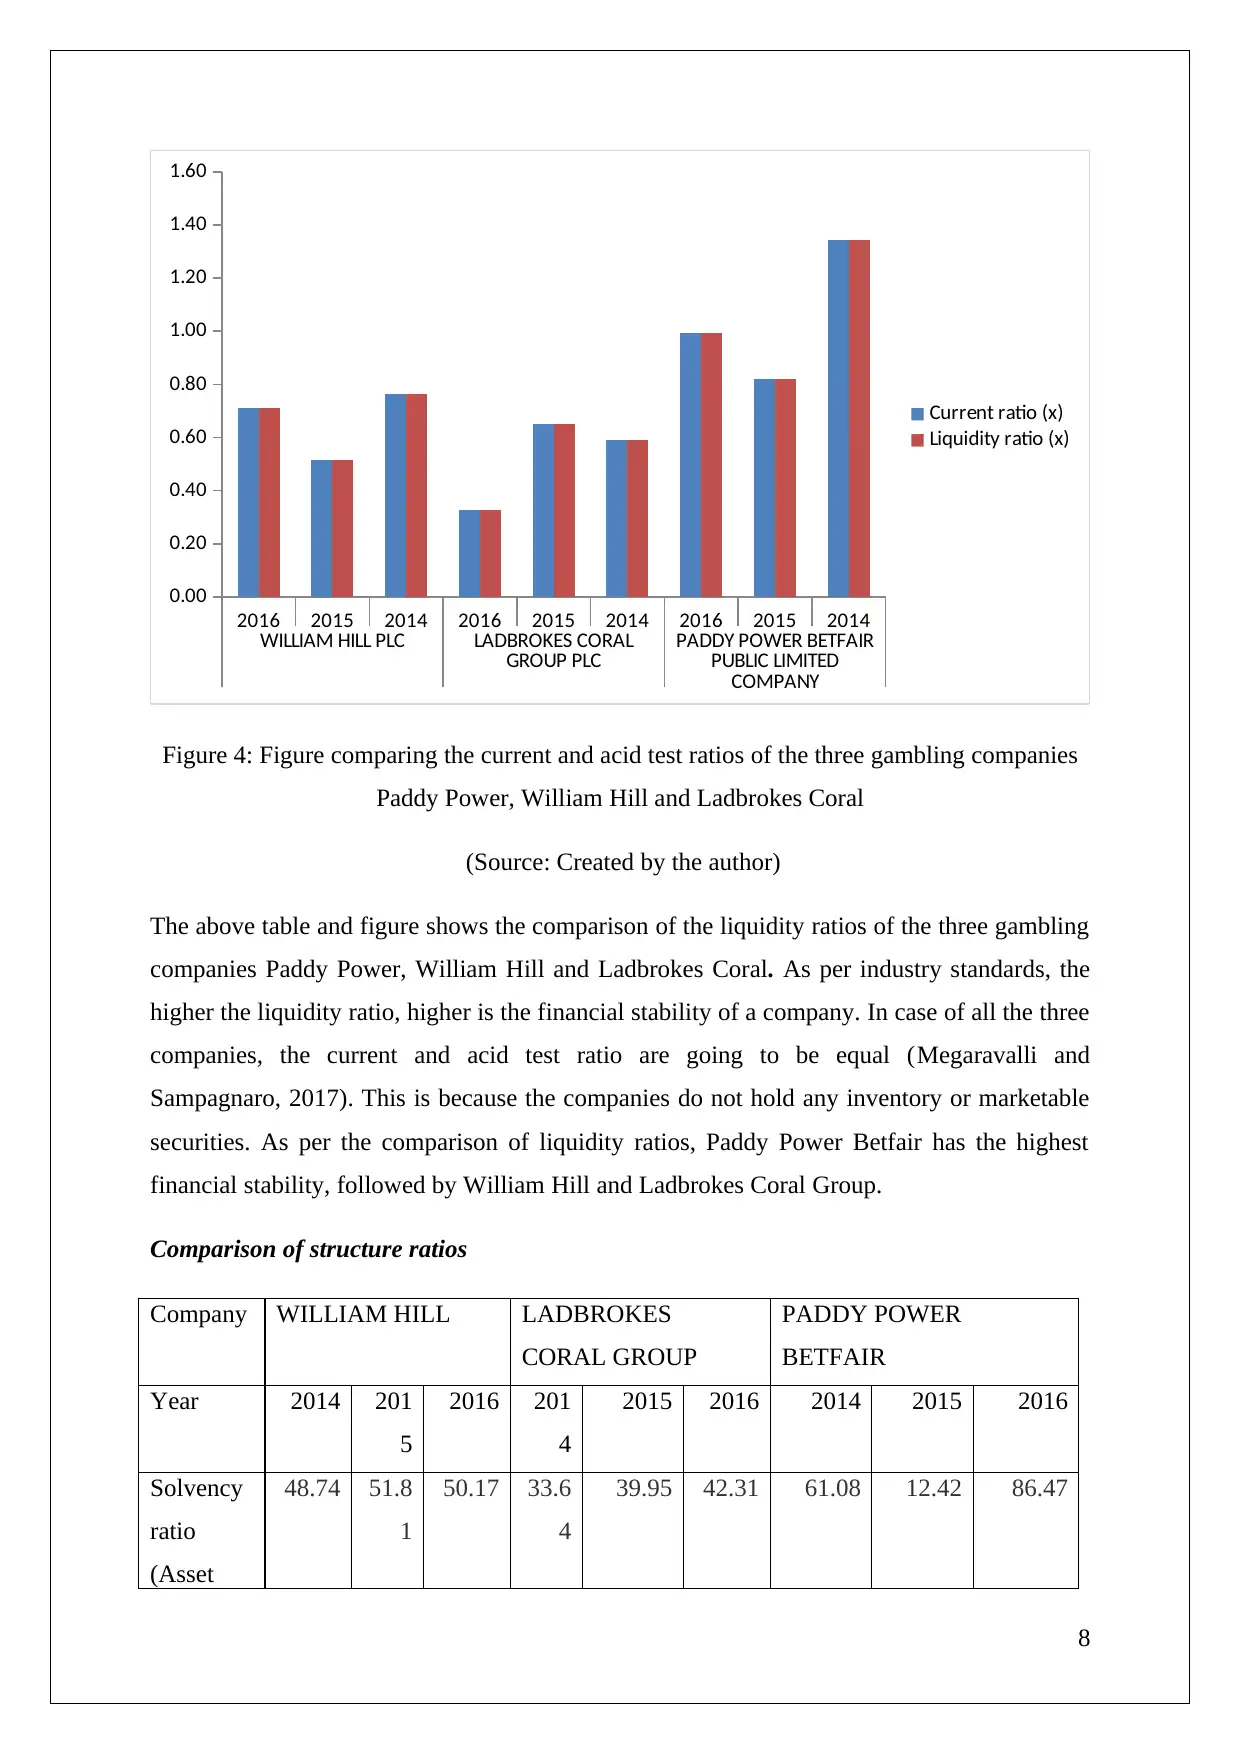
Figure 4: Figure comparing the current and acid test ratios of the three gambling companies
Paddy Power, William Hill and Ladbrokes Coral
(Source: Created by the author)
The above table and figure shows the comparison of the liquidity ratios of the three gambling
companies Paddy Power, William Hill and Ladbrokes Coral. As per industry standards, the
higher the liquidity ratio, higher is the financial stability of a company. In case of all the three
companies, the current and acid test ratio are going to be equal (Megaravalli and
Sampagnaro, 2017). This is because the companies do not hold any inventory or marketable
securities. As per the comparison of liquidity ratios, Paddy Power Betfair has the highest
financial stability, followed by William Hill and Ladbrokes Coral Group.
Comparison of structure ratios
Company WILLIAM HILL LADBROKES
CORAL GROUP
PADDY POWER
BETFAIR
Year 2014 201
5
2016 201
4
2015 2016 2014 2015 2016
Solvency
ratio
(Asset
48.74 51.8
1
50.17 33.6
4
39.95 42.31 61.08 12.42 86.47
8
WILLIAM HILL PLC LADBROKES CORAL
GROUP PLC PADDY POWER BETFAIR
PUBLIC LIMITED
COMPANY
0.00
0.20
0.40
0.60
0.80
1.00
1.20
1.40
1.60
Current ratio (x)
Liquidity ratio (x)
Figure 4: Figure comparing the current and acid test ratios of the three gambling companies
Paddy Power, William Hill and Ladbrokes Coral
(Source: Created by the author)
The above table and figure shows the comparison of the liquidity ratios of the three gambling
companies Paddy Power, William Hill and Ladbrokes Coral. As per industry standards, the
higher the liquidity ratio, higher is the financial stability of a company. In case of all the three
companies, the current and acid test ratio are going to be equal (Megaravalli and
Sampagnaro, 2017). This is because the companies do not hold any inventory or marketable
securities. As per the comparison of liquidity ratios, Paddy Power Betfair has the highest
financial stability, followed by William Hill and Ladbrokes Coral Group.
Comparison of structure ratios
Company WILLIAM HILL LADBROKES
CORAL GROUP
PADDY POWER
BETFAIR
Year 2014 201
5
2016 201
4
2015 2016 2014 2015 2016
Solvency
ratio
(Asset
48.74 51.8
1
50.17 33.6
4
39.95 42.31 61.08 12.42 86.47
8
based)
Sharehold
ers
liquidity
ratio
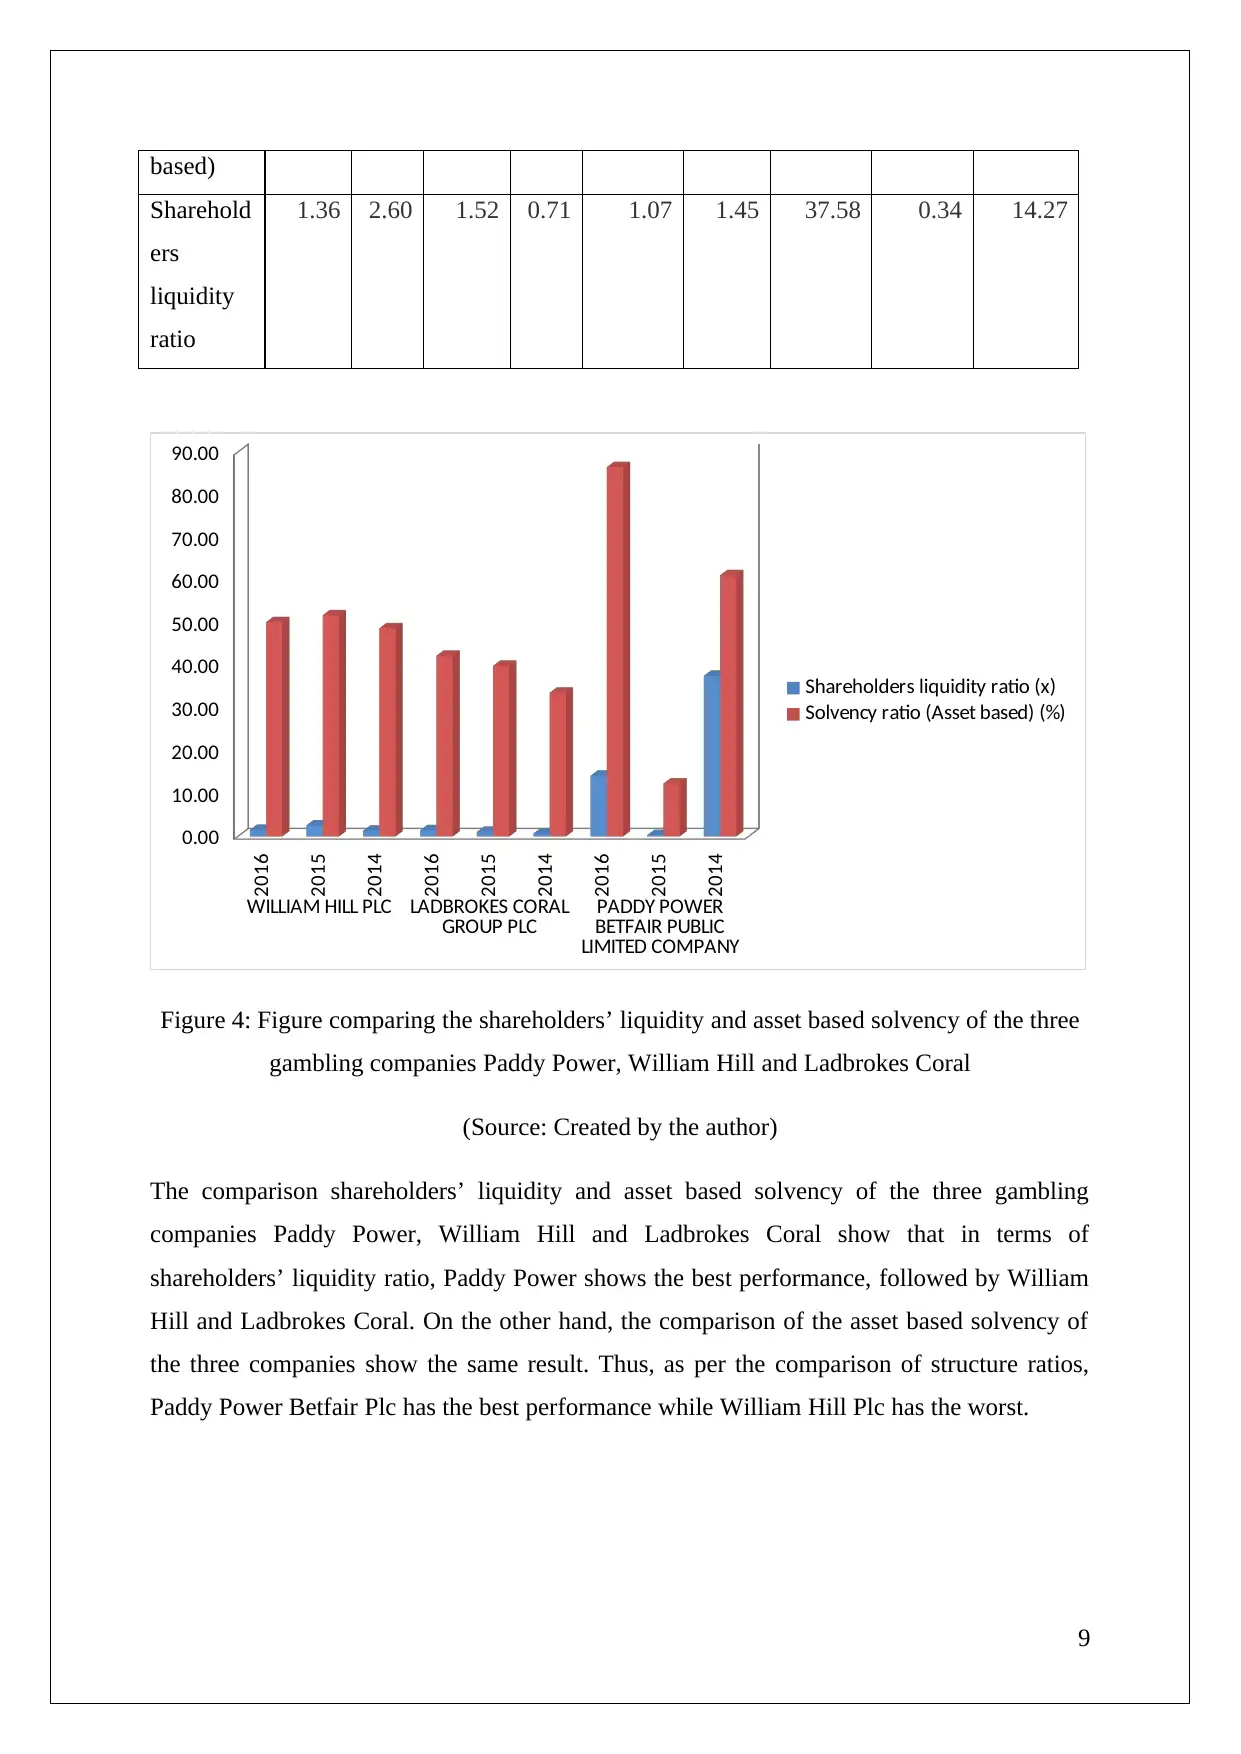
1.36 2.60 1.52 0.71 1.07 1.45 37.58 0.34 14.27
2016
2015
2014
2016
2015
2014
2016
2015
2014
WILLIAM HILL PLC LADBROKES CORAL
GROUP PLC PADDY POWER
BETFAIR PUBLIC
LIMITED COMPANY
0.00
10.00
20.00
30.00
40.00
50.00
60.00
70.00
80.00
90.00
Shareholders liquidity ratio (x)
Solvency ratio (Asset based) (%)
Figure 4: Figure comparing the shareholders’ liquidity and asset based solvency of the three
gambling companies Paddy Power, William Hill and Ladbrokes Coral
(Source: Created by the author)
The comparison shareholders’ liquidity and asset based solvency of the three gambling
companies Paddy Power, William Hill and Ladbrokes Coral show that in terms of
shareholders’ liquidity ratio, Paddy Power shows the best performance, followed by William
Hill and Ladbrokes Coral. On the other hand, the comparison of the asset based solvency of
the three companies show the same result. Thus, as per the comparison of structure ratios,
Paddy Power Betfair Plc has the best performance while William Hill Plc has the worst.
9
Sharehold
ers
liquidity
ratio
1.36 2.60 1.52 0.71 1.07 1.45 37.58 0.34 14.27
2016
2015
2014
2016
2015
2014
2016
2015
2014
WILLIAM HILL PLC LADBROKES CORAL
GROUP PLC PADDY POWER
BETFAIR PUBLIC
LIMITED COMPANY
0.00
10.00
20.00
30.00
40.00
50.00
60.00
70.00
80.00
90.00
Shareholders liquidity ratio (x)
Solvency ratio (Asset based) (%)
Figure 4: Figure comparing the shareholders’ liquidity and asset based solvency of the three
gambling companies Paddy Power, William Hill and Ladbrokes Coral
(Source: Created by the author)
The comparison shareholders’ liquidity and asset based solvency of the three gambling
companies Paddy Power, William Hill and Ladbrokes Coral show that in terms of
shareholders’ liquidity ratio, Paddy Power shows the best performance, followed by William
Hill and Ladbrokes Coral. On the other hand, the comparison of the asset based solvency of
the three companies show the same result. Thus, as per the comparison of structure ratios,
Paddy Power Betfair Plc has the best performance while William Hill Plc has the worst.
9
⊘ This is a preview!⊘
Do you want full access?
Subscribe today to unlock all pages.
Trusted by 1+ million students worldwide
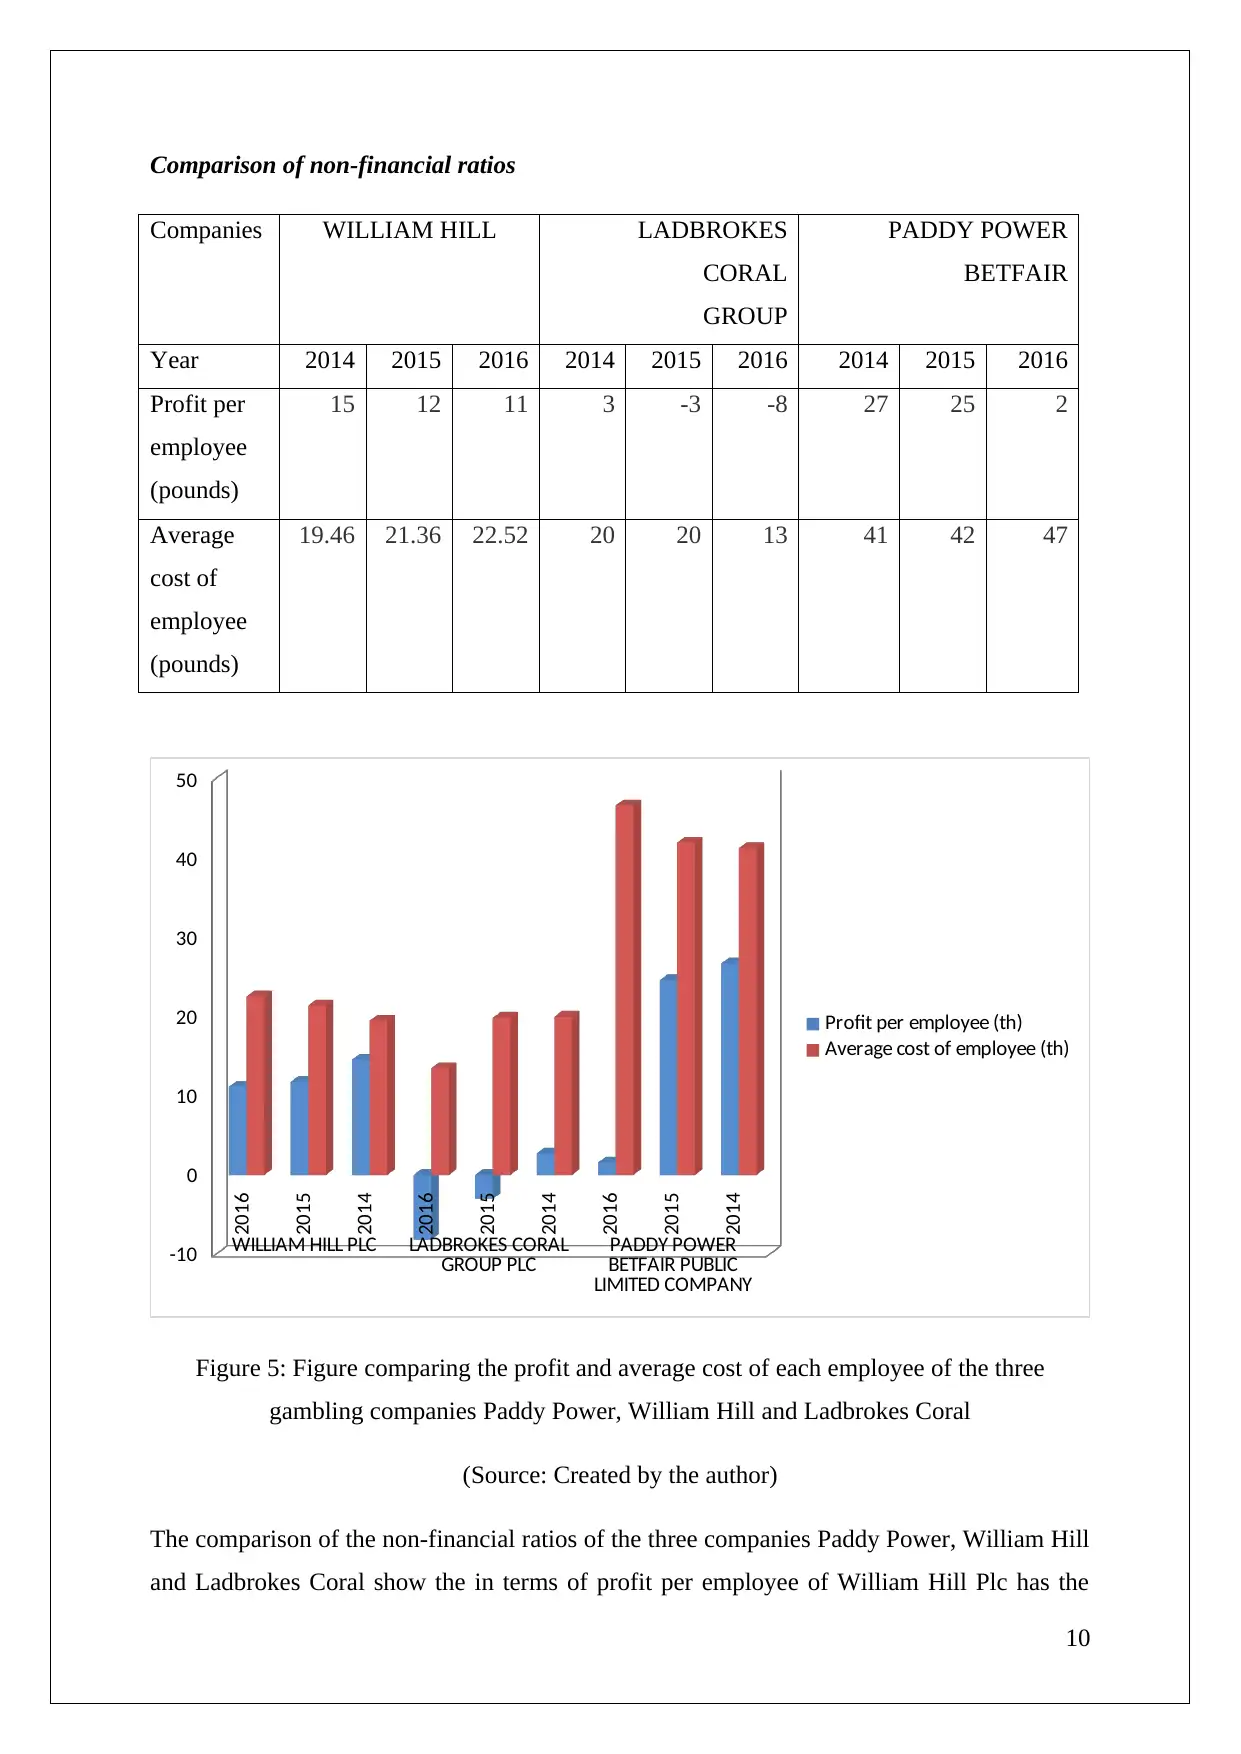
Comparison of non-financial ratios
Companies WILLIAM HILL LADBROKES
CORAL
GROUP
PADDY POWER
BETFAIR
Year 2014 2015 2016 2014 2015 2016 2014 2015 2016
Profit per
employee
(pounds)
15 12 11 3 -3 -8 27 25 2
Average
cost of
employee
(pounds)
19.46 21.36 22.52 20 20 13 41 42 47
2016
2015
2014
2016
2015
2014
2016
2015
2014
WILLIAM HILL PLC LADBROKES CORAL
GROUP PLC PADDY POWER
BETFAIR PUBLIC
LIMITED COMPANY
-10
0
10
20
30
40
50
Profit per employee (th)
Average cost of employee (th)
Figure 5: Figure comparing the profit and average cost of each employee of the three
gambling companies Paddy Power, William Hill and Ladbrokes Coral
(Source: Created by the author)
The comparison of the non-financial ratios of the three companies Paddy Power, William Hill
and Ladbrokes Coral show the in terms of profit per employee of William Hill Plc has the
10
Paraphrase This Document
Need a fresh take? Get an instant paraphrase of this document with our AI Paraphraser
best performance while Ladbrokes Coral has the poorest. In case of comparison of the
average cost spent by the companies for each employee, Paddy Power shows the best
performance while Ladbrokes Coral again remains at the lowest position.
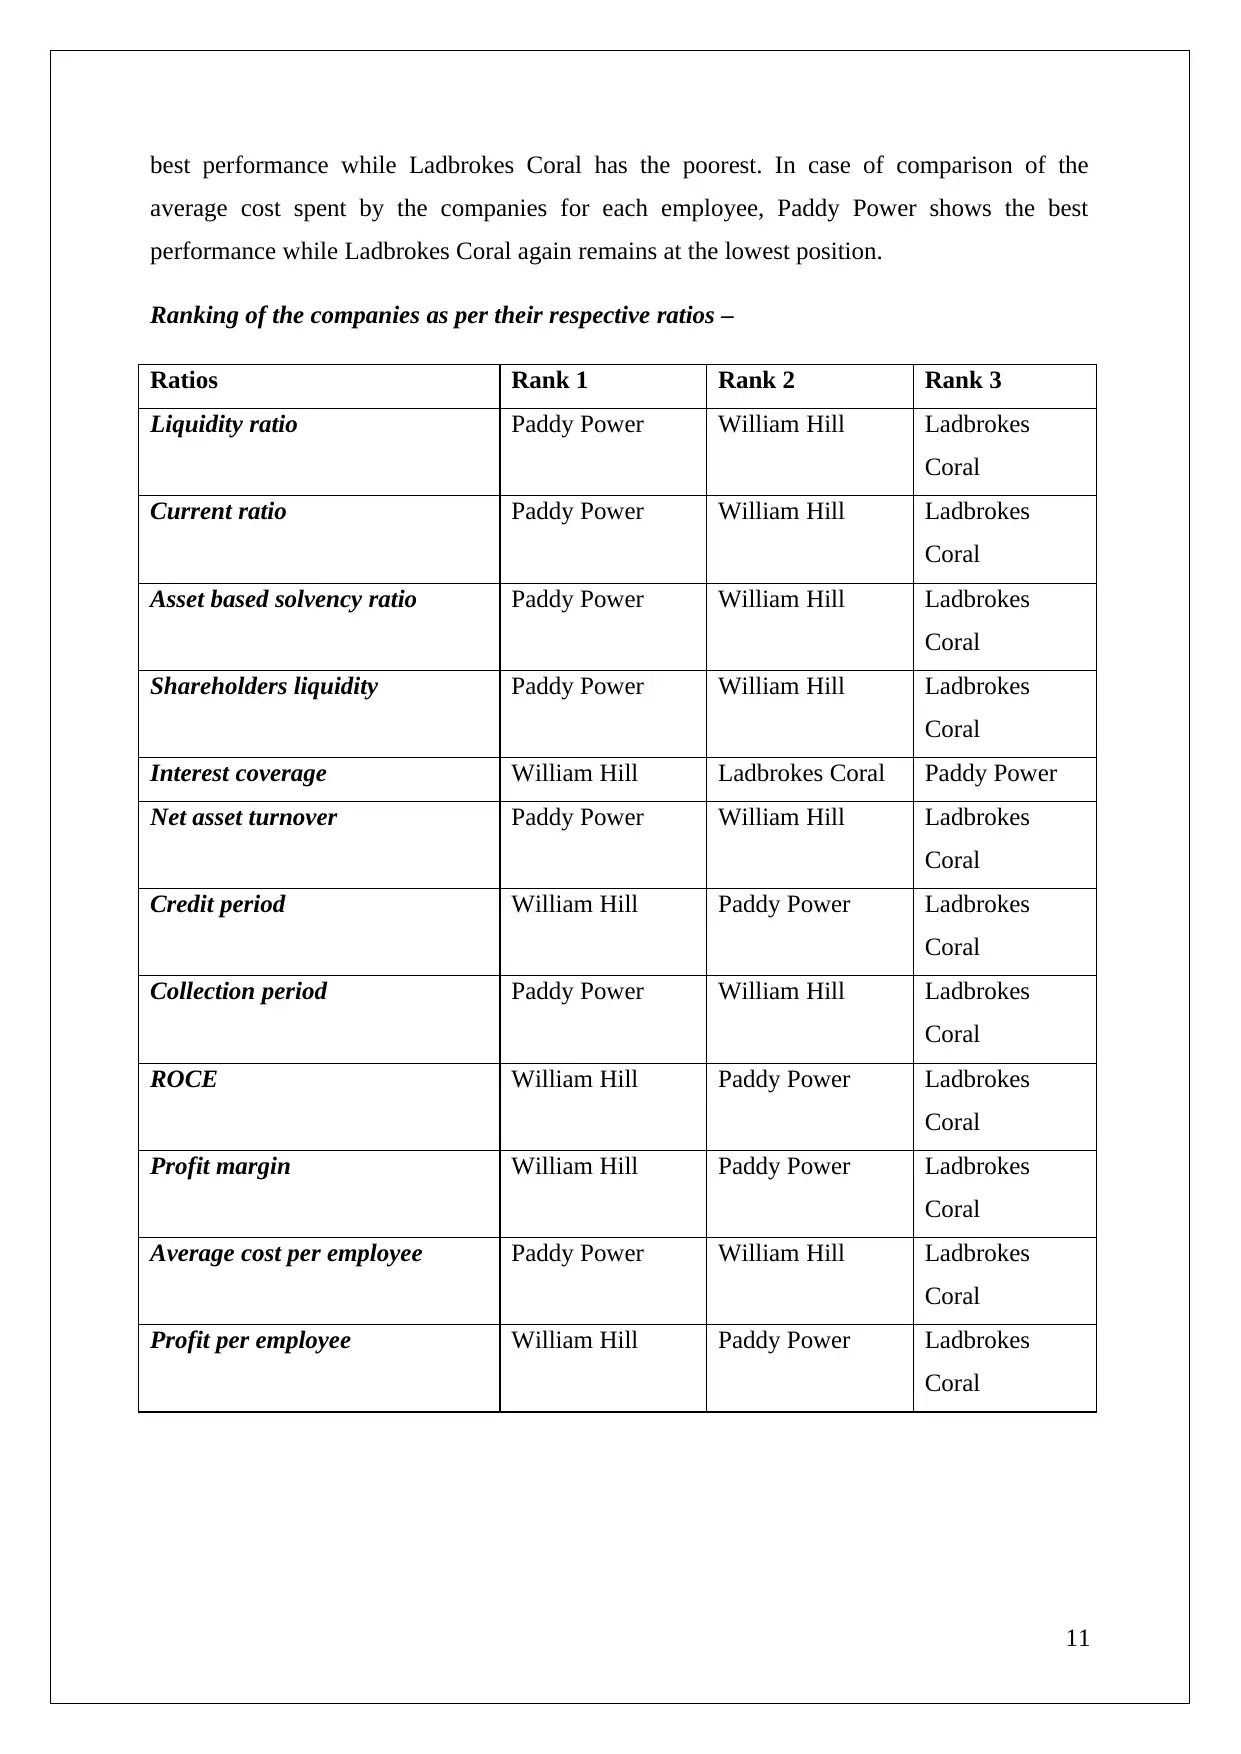
Ranking of the companies as per their respective ratios –
Ratios Rank 1 Rank 2 Rank 3
Liquidity ratio Paddy Power William Hill Ladbrokes
Coral
Current ratio Paddy Power William Hill Ladbrokes
Coral
Asset based solvency ratio Paddy Power William Hill Ladbrokes
Coral
Shareholders liquidity Paddy Power William Hill Ladbrokes
Coral
Interest coverage William Hill Ladbrokes Coral Paddy Power
Net asset turnover Paddy Power William Hill Ladbrokes
Coral
Credit period William Hill Paddy Power Ladbrokes
Coral
Collection period Paddy Power William Hill Ladbrokes
Coral
ROCE William Hill Paddy Power Ladbrokes
Coral
Profit margin William Hill Paddy Power Ladbrokes
Coral
Average cost per employee Paddy Power William Hill Ladbrokes
Coral
Profit per employee William Hill Paddy Power Ladbrokes
Coral
11
average cost spent by the companies for each employee, Paddy Power shows the best
performance while Ladbrokes Coral again remains at the lowest position.
Ranking of the companies as per their respective ratios –
Ratios Rank 1 Rank 2 Rank 3
Liquidity ratio Paddy Power William Hill Ladbrokes
Coral
Current ratio Paddy Power William Hill Ladbrokes
Coral
Asset based solvency ratio Paddy Power William Hill Ladbrokes
Coral
Shareholders liquidity Paddy Power William Hill Ladbrokes
Coral
Interest coverage William Hill Ladbrokes Coral Paddy Power
Net asset turnover Paddy Power William Hill Ladbrokes
Coral
Credit period William Hill Paddy Power Ladbrokes
Coral
Collection period Paddy Power William Hill Ladbrokes
Coral
ROCE William Hill Paddy Power Ladbrokes
Coral
Profit margin William Hill Paddy Power Ladbrokes
Coral
Average cost per employee Paddy Power William Hill Ladbrokes
Coral
Profit per employee William Hill Paddy Power Ladbrokes
Coral
11

(b) Identification of the best performing company in the industry
As per the analysis and comparison of all the financial as well as non-financial ratios of
Paddy Power, William Hill and Ladbrokes Coral, it can be analyzed that the best performing
company in UK gambling industry is Paddy Power Betfair LC. This is because according to
all the financial and non-financial ratios, Paddy Power Betfair PLC stands at Rank 1. In
addition to ratio analysis, the SWOT analysis of Paddy Power shows that the strengths of the
company are huge (Orbiseurope.bvdinfo.com, 2017). This is because the company has a high
rate of growth, has highly experienced business units, provides good quality of odds and has
a strong presence online. These factors in turn help the company in acquiring the first rank in
UK gambling industry. Hence, as per comparison of ratios and SWOT analysis, Paddy Power
Betfair PLC is the best performing company in UK gambling industry and proves to be a
positive investment opportunity.
(c) Identification of the most poorly performing company in the industry
According to the comparison of the ratios of the three companies, Ladbrokes Coral Group Plc
shows the poorest performing in the UK gambling industry. In addition to the ratio analysis
and ranking, the SWOT analysis of the company shows that the weaknesses of the company
are more than its strengths. This is mainly because the forecasts of the company related to
product demand is poor, the attrition of the company’s rate of workforce is high, the
marketing operations of the company is poor and it does not invest in adaptation of new
technologies within the company (Orbiseurope.bvdinfo.com, 2017). Thus, Ladbrokes Coral
Group Plc can be analyzed to have the poorest performance among the three companies.
12
⊘ This is a preview!⊘
Do you want full access?
Subscribe today to unlock all pages.
Trusted by 1+ million students worldwide
1 out of 18
Related Documents


Your All-in-One AI-Powered Toolkit for Academic Success.
+13062052269
info@desklib.com
Available 24*7 on WhatsApp / Email
![[object Object]](/_next/static/media/star-bottom.7253800d.svg)
Unlock your academic potential
Copyright © 2020–2026 A2Z Services. All Rights Reserved. Developed and managed by ZUCOL.