Comprehensive Report: Trends in UK Higher Education Student Enrollment
VerifiedAdded on 2020/10/22
|15
|3022
|303
Report
AI Summary
This report examines the trends in student numbers within the UK higher education sector, analyzing data from sources like ONS and HESA. It explores the changes in student demographics, including the number of young people in full-time education from 1992 to 2016, and the impact of migration and employment rates on student enrollment. The report presents statistical figures and charts to illustrate the shifts in student numbers from the UK, EU, and international backgrounds. It delves into first-year enrollments, higher education qualifications obtained, and the overall number of students at various levels, including undergraduates and postgraduates. The analysis highlights the fluctuations in student numbers, the influence of tuition fees, and the increasing presence of international students. The report concludes by summarizing the key findings regarding the evolution of student enrollment in UK higher education and its implications. The report is contributed by a student to Desklib, a platform offering AI-based study tools.

REPORT
Paraphrase This Document
Need a fresh take? Get an instant paraphrase of this document with our AI Paraphraser
Table of Contents
INTRODUCTION...........................................................................................................................1
Report Topic- How has the number of students in UK higher education changed?........................1
Young people aged 18-24 in full-time education from 1992 to 2016.........................................2
Migration of students..................................................................................................................2
Employment rate in full-time education.....................................................................................3
Students numbers in UK higher education.................................................................................4
First year enrolments of students in HE from 2007-08 to 2016-17............................................5
Higher education qualifications obtaining by qualification level from 2007-08 to 2016-17......6
Number of Students in Higher Education...................................................................................6
International Students.................................................................................................................9
........................................................................................................................................................10
Students by domicile.................................................................................................................11
CONCLUSION..............................................................................................................................11
REFERENCES..............................................................................................................................12
INTRODUCTION
UK higher education sector has accomplished good growth in recent years. Present report
deals with how has the number of students in UK higher education has undergone change.
Statistical data from reputed websites such as ONS, HESA will be taken for analysing secondary
data in effective manner. Trend of change in number of students from UK, EU and international
will be assessed with statistical figures and charts for assessing change. Hence, UK higher
education sector will be analysed for completing research quite effectually.
Report Topic- How has the number of students in UK higher education
changed?
UK has been the most popular country which has attracted millions of students from
around the world. In financial year 2015-16, more than 992,125 entrants were being admitted to
163 higher educational institutions (Denzin & Giardina, 2018). This is evident from the fact that
number of enrolments in 2006-07 were just 65,175 which clearly shows increment in students
visit in the UK over the years. It means that students across the ten year period have changed up
to a high extent in terms of number of admissions to universities. This means that entrants have
gradually increased over the period which includes domestic and international students.
1
⊘ This is a preview!⊘
Do you want full access?
Subscribe today to unlock all pages.
Trusted by 1+ million students worldwide
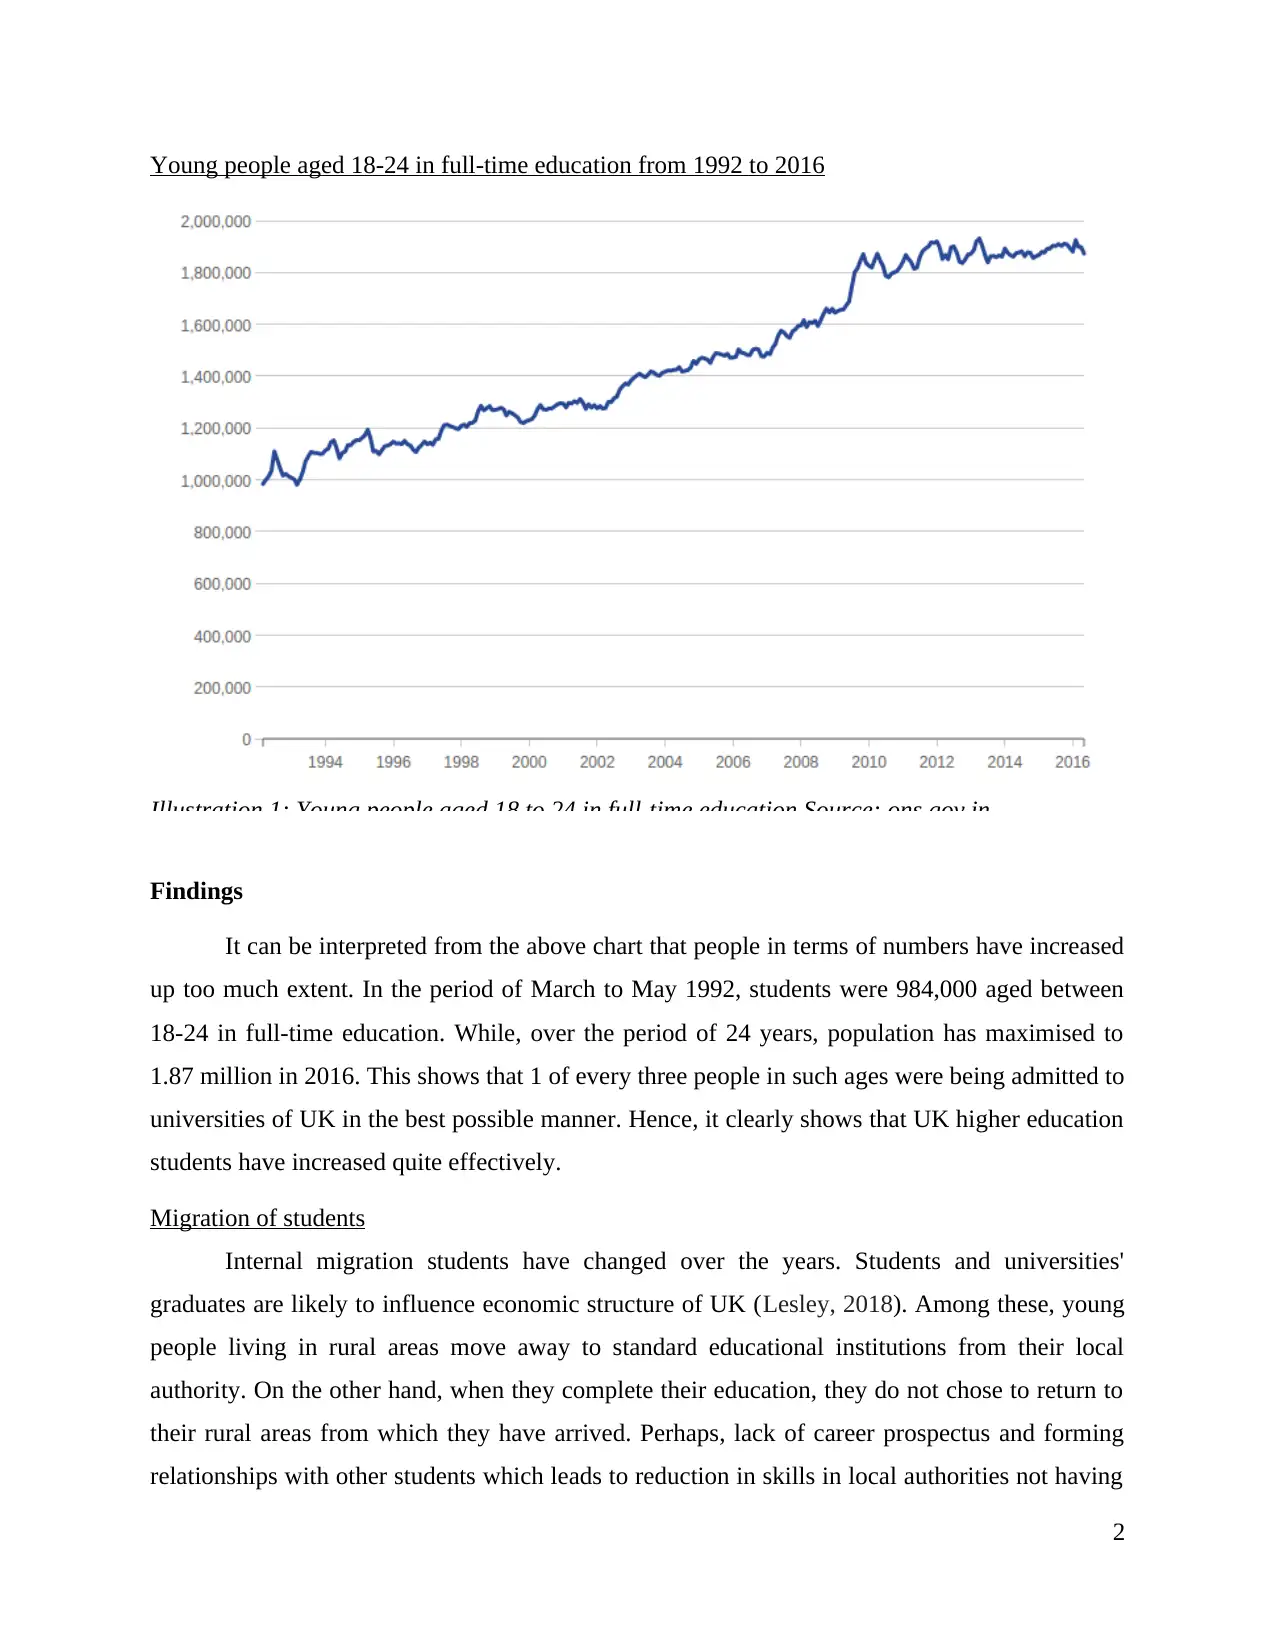
Young people aged 18-24 in full-time education from 1992 to 2016
Illustration 1: Young people aged 18 to 24 in full-time education Source: ons.gov.in
Findings
It can be interpreted from the above chart that people in terms of numbers have increased
up too much extent. In the period of March to May 1992, students were 984,000 aged between
18-24 in full-time education. While, over the period of 24 years, population has maximised to
1.87 million in 2016. This shows that 1 of every three people in such ages were being admitted to
universities of UK in the best possible manner. Hence, it clearly shows that UK higher education
students have increased quite effectively.
Migration of students
Internal migration students have changed over the years. Students and universities'
graduates are likely to influence economic structure of UK (Lesley, 2018). Among these, young
people living in rural areas move away to standard educational institutions from their local
authority. On the other hand, when they complete their education, they do not chose to return to
their rural areas from which they have arrived. Perhaps, lack of career prospectus and forming
relationships with other students which leads to reduction in skills in local authorities not having
2
Paraphrase This Document
Need a fresh take? Get an instant paraphrase of this document with our AI Paraphraser
quality institutions. London is one of exciting city and it is perceived to be having larger
universities' hub and labour market contributing to inward migration between ages from 18 to 22.
On the other side, international students from round around the world have lowered since
2007. Nearly quarter of students come for formal study in the UK. In 1977, 29000 international
students were admitted to UK raised to peak of almost 9 times amount in 2010. While, it is being
noticed that in recent years, long-term immigrants coming for formal studies have decreased as
164,000 numbers are declined in March 2016.
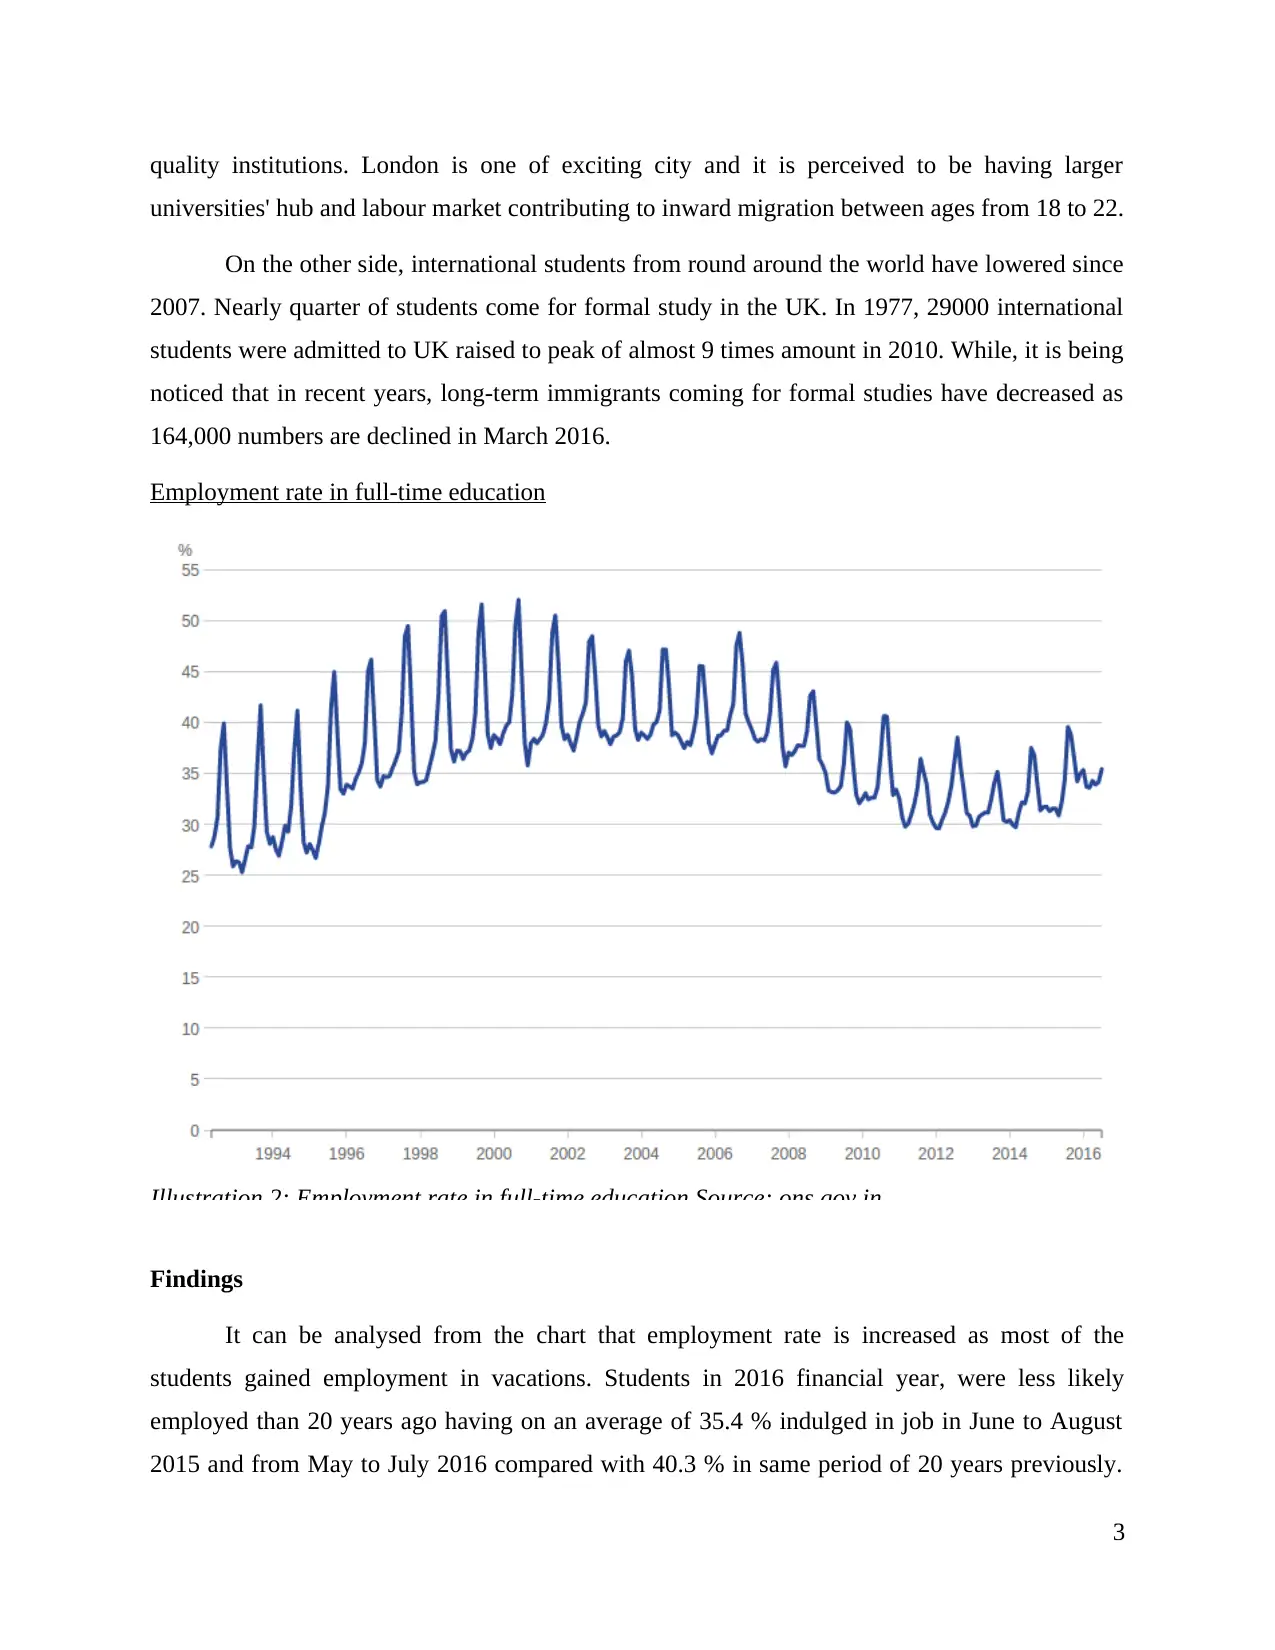
Employment rate in full-time education
Illustration 2: Employment rate in full-time education Source: ons.gov.in
Findings
It can be analysed from the chart that employment rate is increased as most of the
students gained employment in vacations. Students in 2016 financial year, were less likely
employed than 20 years ago having on an average of 35.4 % indulged in job in June to August
2015 and from May to July 2016 compared with 40.3 % in same period of 20 years previously.
3
universities' hub and labour market contributing to inward migration between ages from 18 to 22.
On the other side, international students from round around the world have lowered since
2007. Nearly quarter of students come for formal study in the UK. In 1977, 29000 international
students were admitted to UK raised to peak of almost 9 times amount in 2010. While, it is being
noticed that in recent years, long-term immigrants coming for formal studies have decreased as
164,000 numbers are declined in March 2016.
Employment rate in full-time education
Illustration 2: Employment rate in full-time education Source: ons.gov.in
Findings
It can be analysed from the chart that employment rate is increased as most of the
students gained employment in vacations. Students in 2016 financial year, were less likely
employed than 20 years ago having on an average of 35.4 % indulged in job in June to August
2015 and from May to July 2016 compared with 40.3 % in same period of 20 years previously.
3
While, those who are not involved were same throughout academic year and as peaks and
troughs were less pronounced in 2016. Russell Group universities has been admitted most of
number of students at an age of 19 when higher education starts. While, at an age of 22, studies
comes to an end and students' leave university.
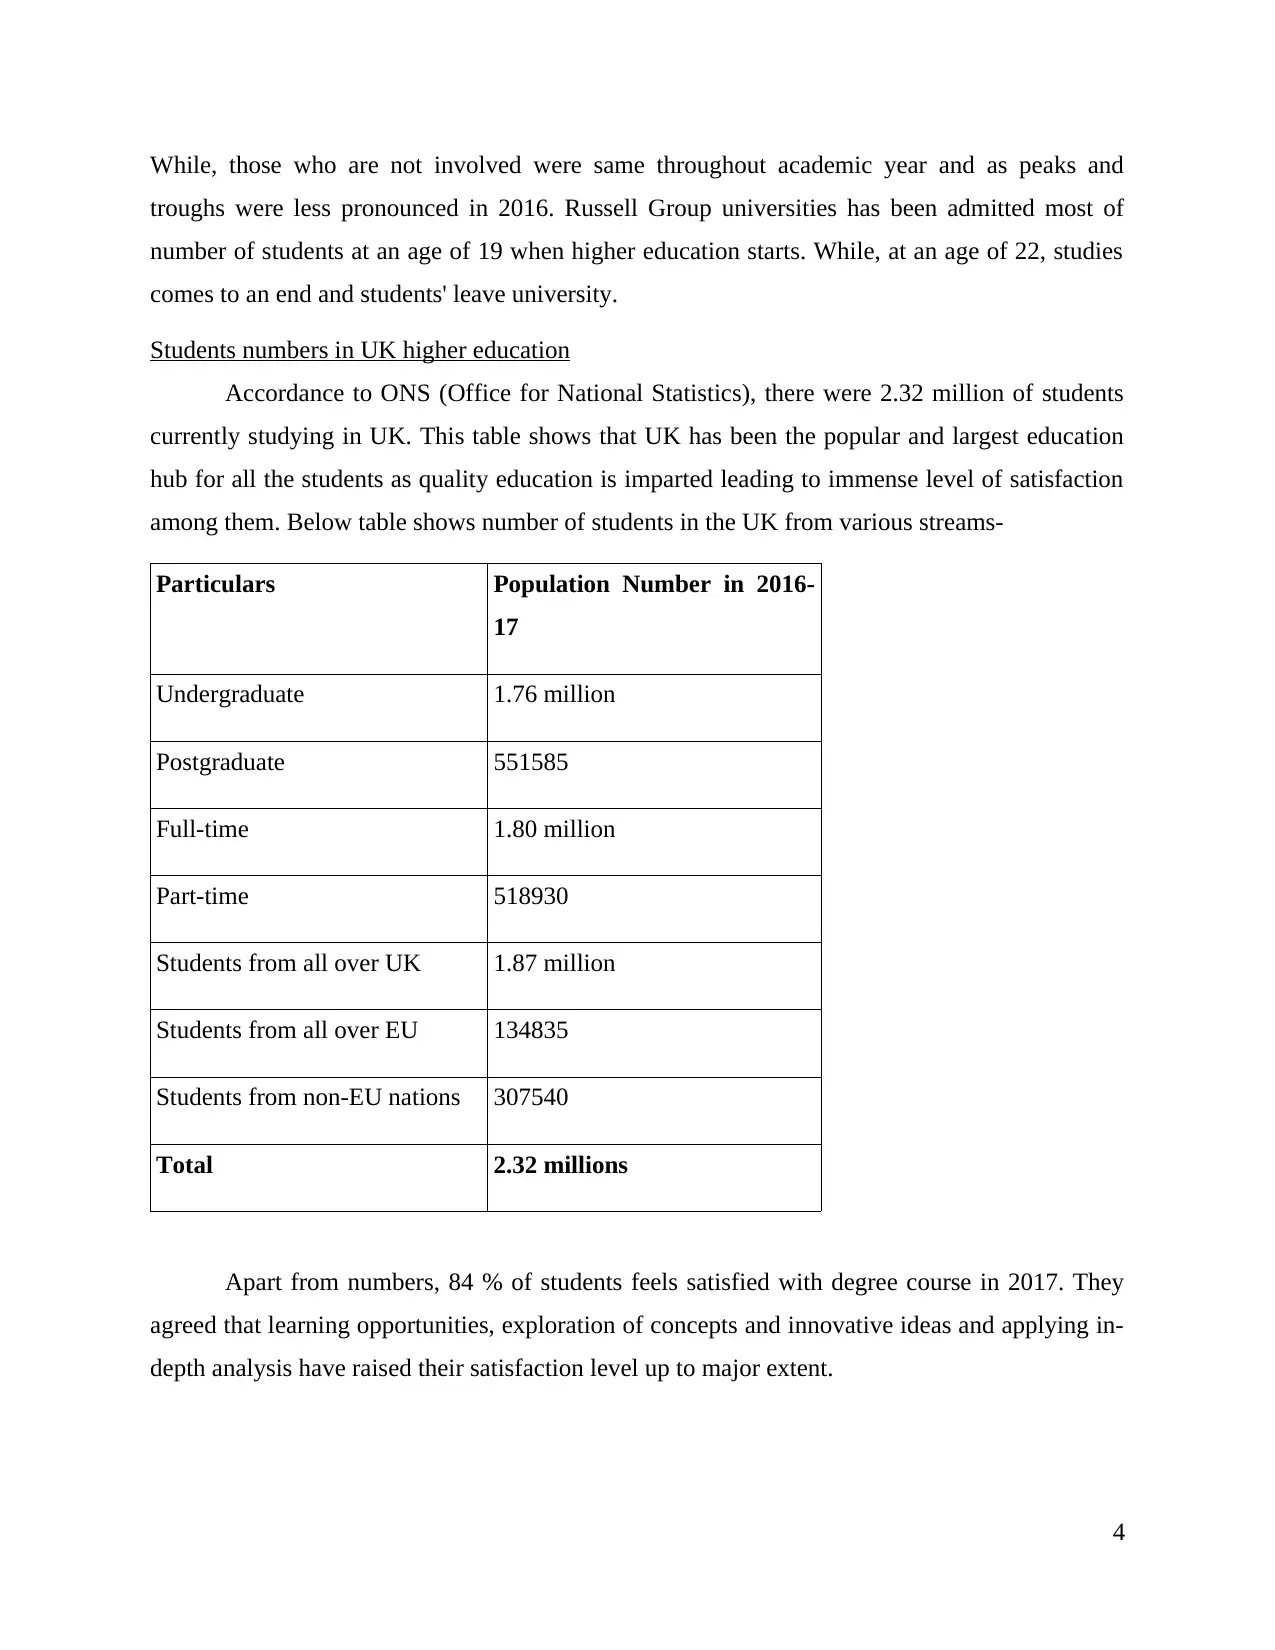
Students numbers in UK higher education
Accordance to ONS (Office for National Statistics), there were 2.32 million of students
currently studying in UK. This table shows that UK has been the popular and largest education
hub for all the students as quality education is imparted leading to immense level of satisfaction
among them. Below table shows number of students in the UK from various streams-
Particulars Population Number in 2016-
17
Undergraduate 1.76 million
Postgraduate 551585
Full-time 1.80 million
Part-time 518930
Students from all over UK 1.87 million
Students from all over EU 134835
Students from non-EU nations 307540
Total 2.32 millions
Apart from numbers, 84 % of students feels satisfied with degree course in 2017. They
agreed that learning opportunities, exploration of concepts and innovative ideas and applying in-
depth analysis have raised their satisfaction level up to major extent.
4
troughs were less pronounced in 2016. Russell Group universities has been admitted most of
number of students at an age of 19 when higher education starts. While, at an age of 22, studies
comes to an end and students' leave university.
Students numbers in UK higher education
Accordance to ONS (Office for National Statistics), there were 2.32 million of students
currently studying in UK. This table shows that UK has been the popular and largest education
hub for all the students as quality education is imparted leading to immense level of satisfaction
among them. Below table shows number of students in the UK from various streams-
Particulars Population Number in 2016-
17
Undergraduate 1.76 million
Postgraduate 551585
Full-time 1.80 million
Part-time 518930
Students from all over UK 1.87 million
Students from all over EU 134835
Students from non-EU nations 307540
Total 2.32 millions
Apart from numbers, 84 % of students feels satisfied with degree course in 2017. They
agreed that learning opportunities, exploration of concepts and innovative ideas and applying in-
depth analysis have raised their satisfaction level up to major extent.
4
⊘ This is a preview!⊘
Do you want full access?
Subscribe today to unlock all pages.
Trusted by 1+ million students worldwide
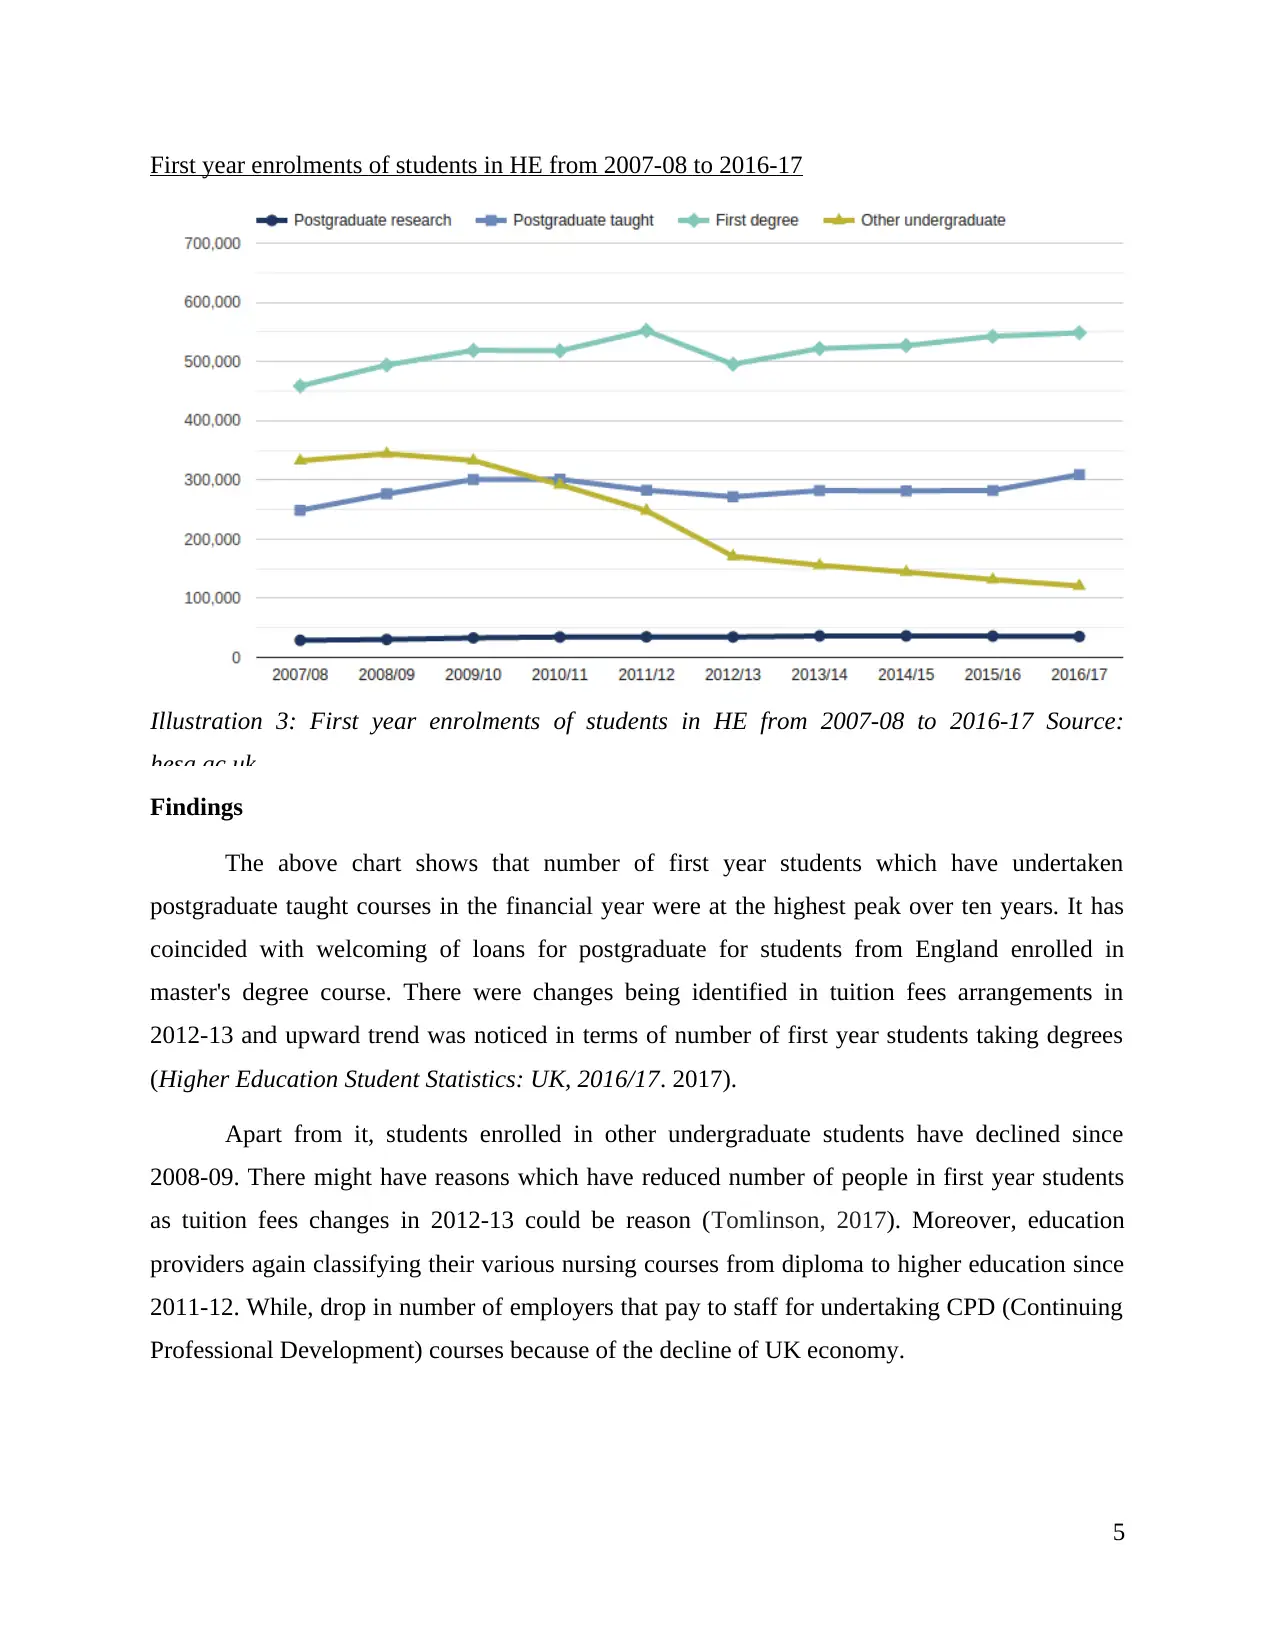
First year enrolments of students in HE from 2007-08 to 2016-17
Illustration 3: First year enrolments of students in HE from 2007-08 to 2016-17 Source:
hesa.ac.uk
Findings
The above chart shows that number of first year students which have undertaken
postgraduate taught courses in the financial year were at the highest peak over ten years. It has
coincided with welcoming of loans for postgraduate for students from England enrolled in
master's degree course. There were changes being identified in tuition fees arrangements in
2012-13 and upward trend was noticed in terms of number of first year students taking degrees
(Higher Education Student Statistics: UK, 2016/17. 2017).
Apart from it, students enrolled in other undergraduate students have declined since
2008-09. There might have reasons which have reduced number of people in first year students
as tuition fees changes in 2012-13 could be reason (Tomlinson, 2017). Moreover, education
providers again classifying their various nursing courses from diploma to higher education since
2011-12. While, drop in number of employers that pay to staff for undertaking CPD (Continuing
Professional Development) courses because of the decline of UK economy.
5
Paraphrase This Document
Need a fresh take? Get an instant paraphrase of this document with our AI Paraphraser
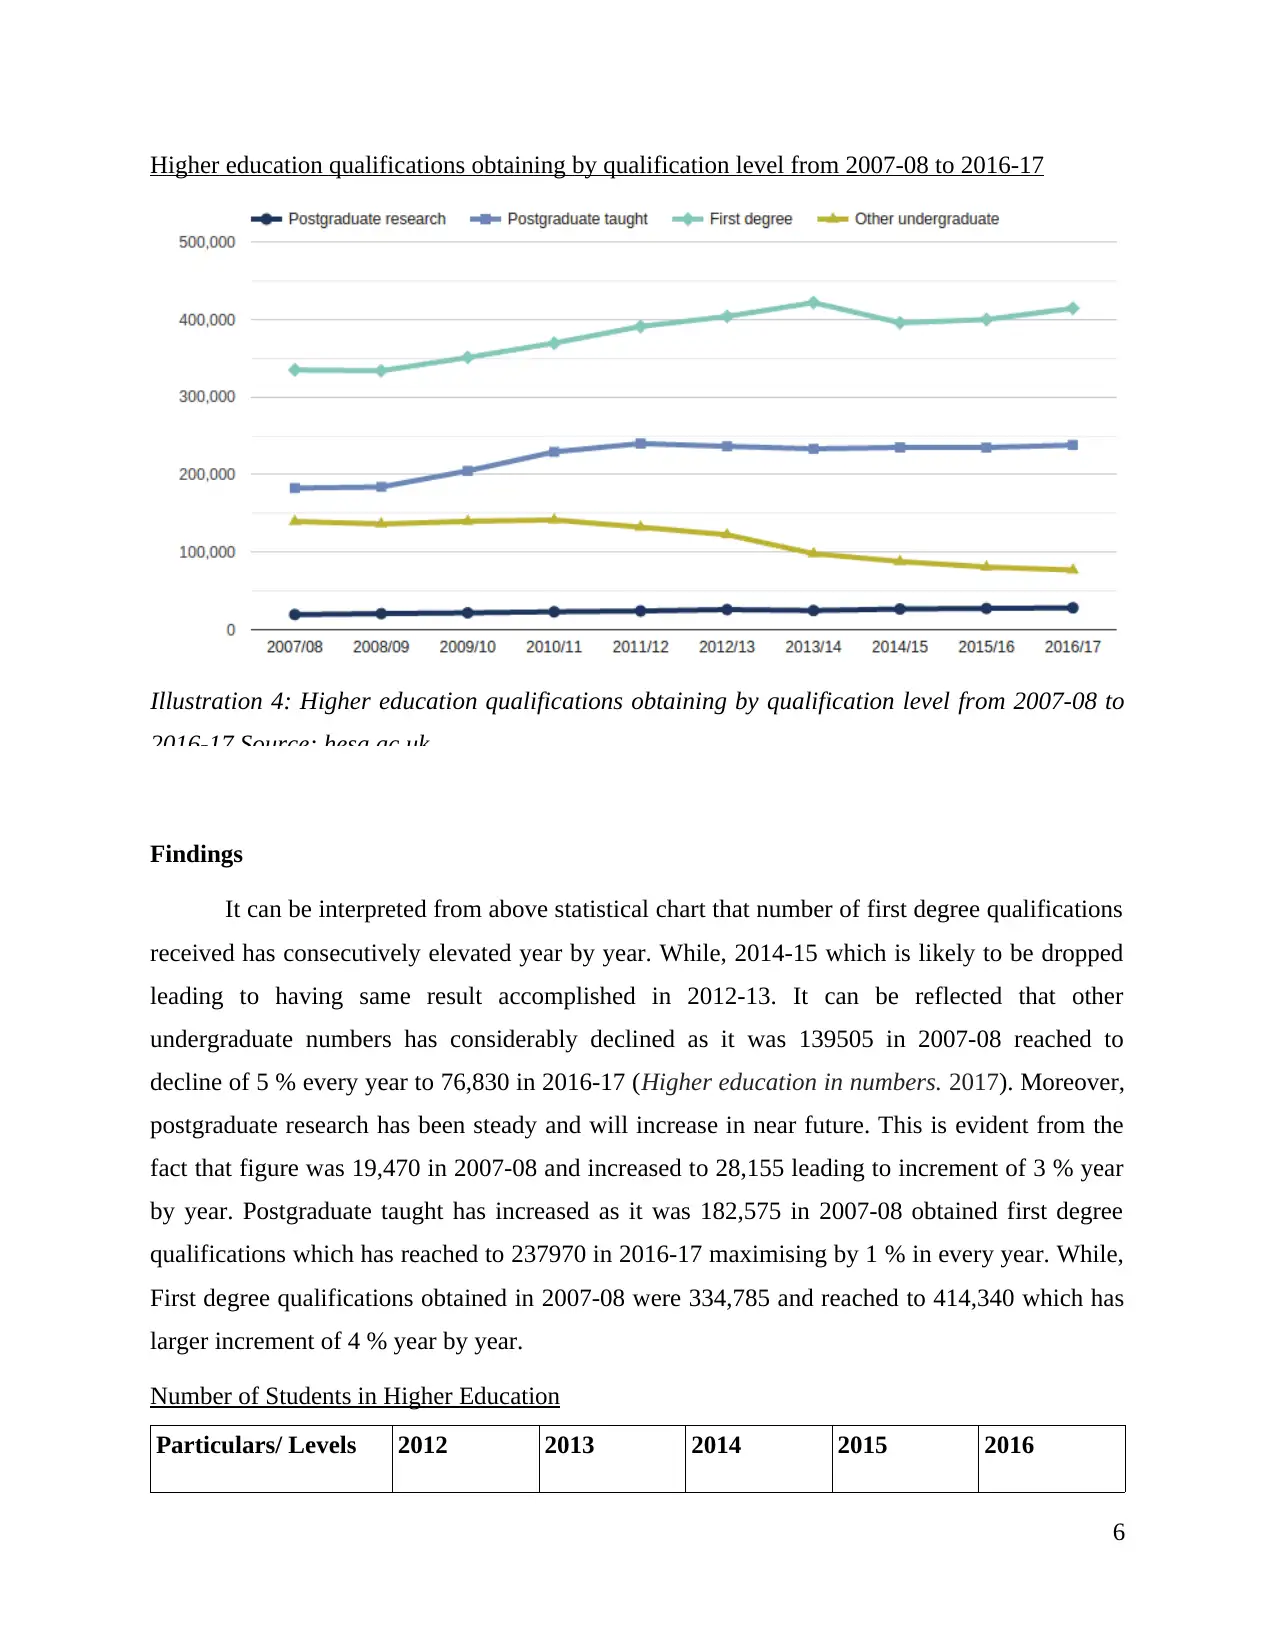
Higher education qualifications obtaining by qualification level from 2007-08 to 2016-17
Illustration 4: Higher education qualifications obtaining by qualification level from 2007-08 to
2016-17 Source: hesa.ac.uk
Findings
It can be interpreted from above statistical chart that number of first degree qualifications
received has consecutively elevated year by year. While, 2014-15 which is likely to be dropped
leading to having same result accomplished in 2012-13. It can be reflected that other
undergraduate numbers has considerably declined as it was 139505 in 2007-08 reached to
decline of 5 % every year to 76,830 in 2016-17 (Higher education in numbers. 2017). Moreover,
postgraduate research has been steady and will increase in near future. This is evident from the
fact that figure was 19,470 in 2007-08 and increased to 28,155 leading to increment of 3 % year
by year. Postgraduate taught has increased as it was 182,575 in 2007-08 obtained first degree
qualifications which has reached to 237970 in 2016-17 maximising by 1 % in every year. While,
First degree qualifications obtained in 2007-08 were 334,785 and reached to 414,340 which has
larger increment of 4 % year by year.
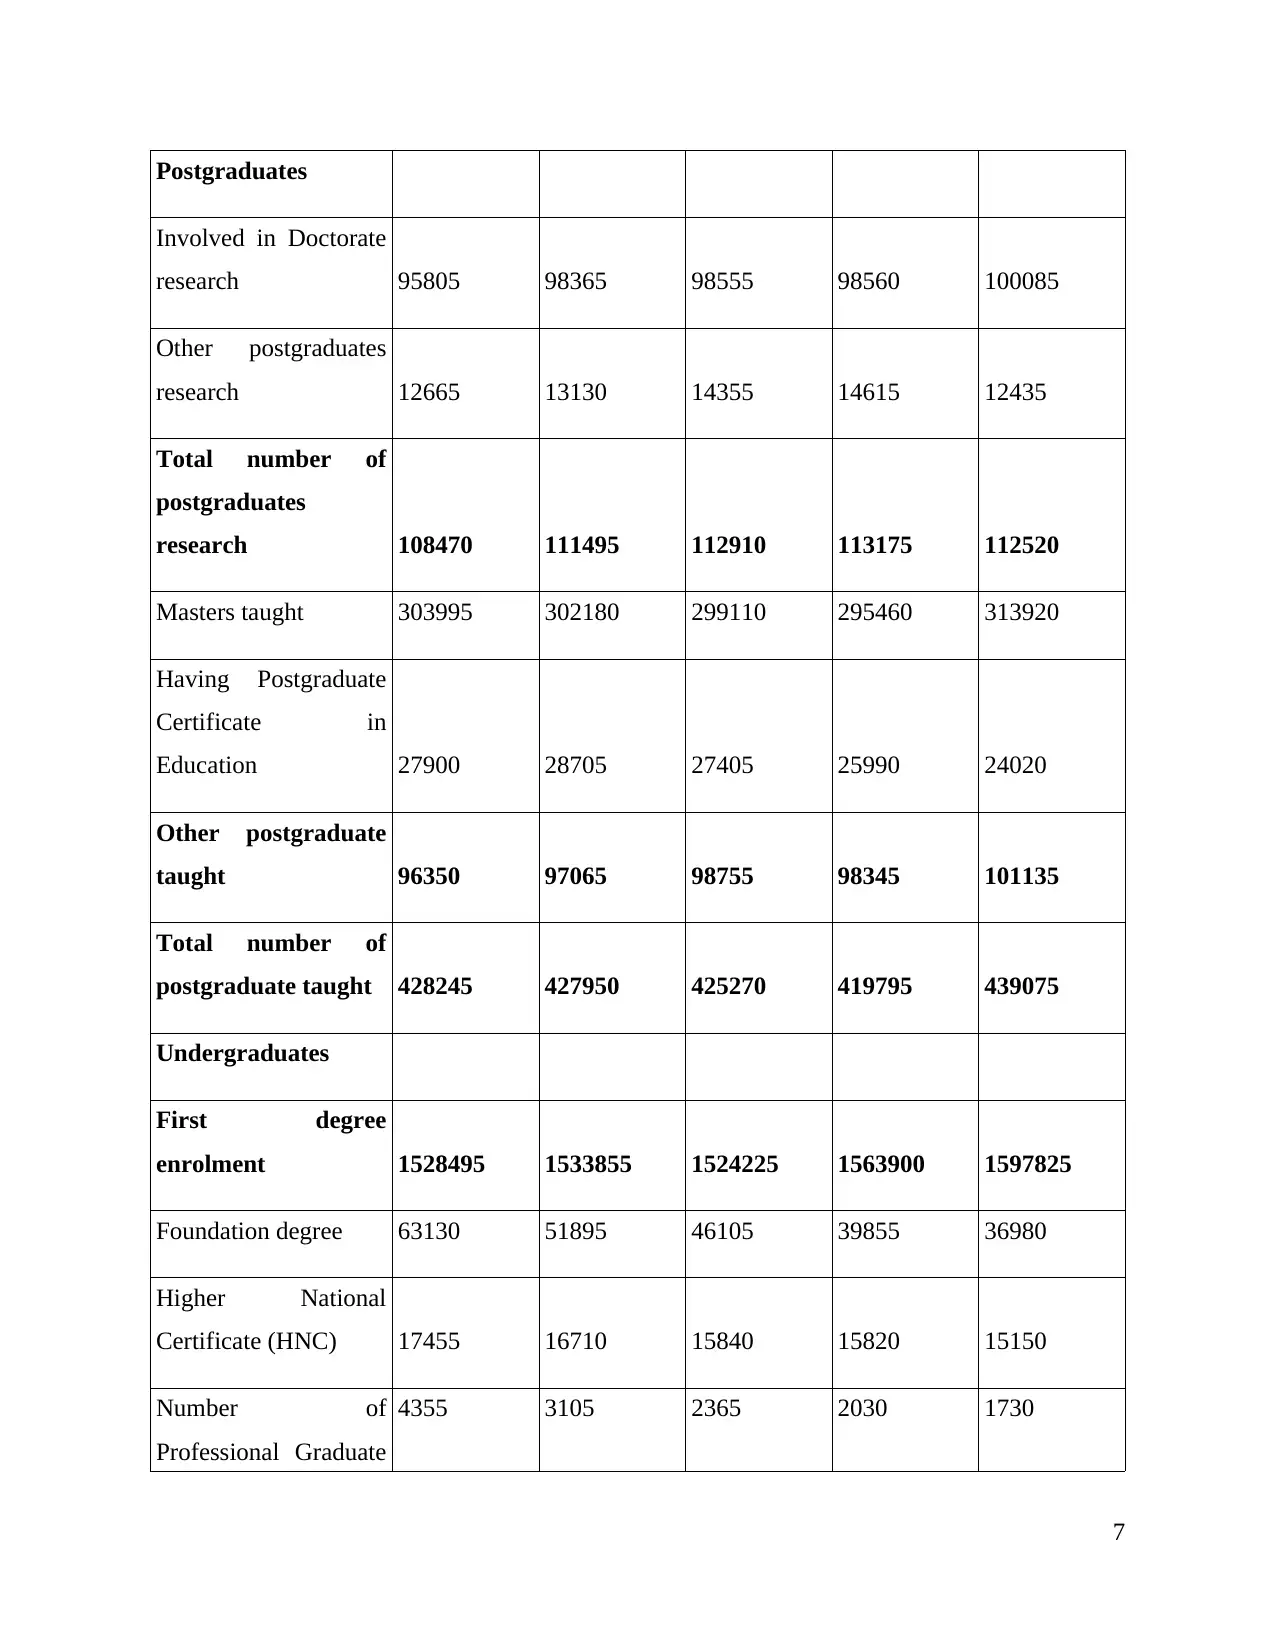
Number of Students in Higher Education
Particulars/ Levels 2012 2013 2014 2015 2016
6
Illustration 4: Higher education qualifications obtaining by qualification level from 2007-08 to
2016-17 Source: hesa.ac.uk
Findings
It can be interpreted from above statistical chart that number of first degree qualifications
received has consecutively elevated year by year. While, 2014-15 which is likely to be dropped
leading to having same result accomplished in 2012-13. It can be reflected that other
undergraduate numbers has considerably declined as it was 139505 in 2007-08 reached to
decline of 5 % every year to 76,830 in 2016-17 (Higher education in numbers. 2017). Moreover,
postgraduate research has been steady and will increase in near future. This is evident from the
fact that figure was 19,470 in 2007-08 and increased to 28,155 leading to increment of 3 % year
by year. Postgraduate taught has increased as it was 182,575 in 2007-08 obtained first degree
qualifications which has reached to 237970 in 2016-17 maximising by 1 % in every year. While,
First degree qualifications obtained in 2007-08 were 334,785 and reached to 414,340 which has
larger increment of 4 % year by year.
Number of Students in Higher Education
Particulars/ Levels 2012 2013 2014 2015 2016
6
Postgraduates
Involved in Doctorate
research 95805 98365 98555 98560 100085
Other postgraduates
research 12665 13130 14355 14615 12435
Total number of
postgraduates
research 108470 111495 112910 113175 112520
Masters taught 303995 302180 299110 295460 313920
Having Postgraduate
Certificate in
Education 27900 28705 27405 25990 24020
Other postgraduate
taught 96350 97065 98755 98345 101135
Total number of
postgraduate taught 428245 427950 425270 419795 439075
Undergraduates
First degree
enrolment 1528495 1533855 1524225 1563900 1597825
Foundation degree 63130 51895 46105 39855 36980
Higher National
Certificate (HNC) 17455 16710 15840 15820 15150
Number of
Professional Graduate
4355 3105 2365 2030 1730
7
⊘ This is a preview!⊘
Do you want full access?
Subscribe today to unlock all pages.
Trusted by 1+ million students worldwide
Certificate in
Education
Other
undergraduates 190320 154355 139360 126245 114600
Total other
undergraduates 275260 226065 203670 183950 168460
Total of all levels of
education 2340470 2299365 2266075 2280820 2317880
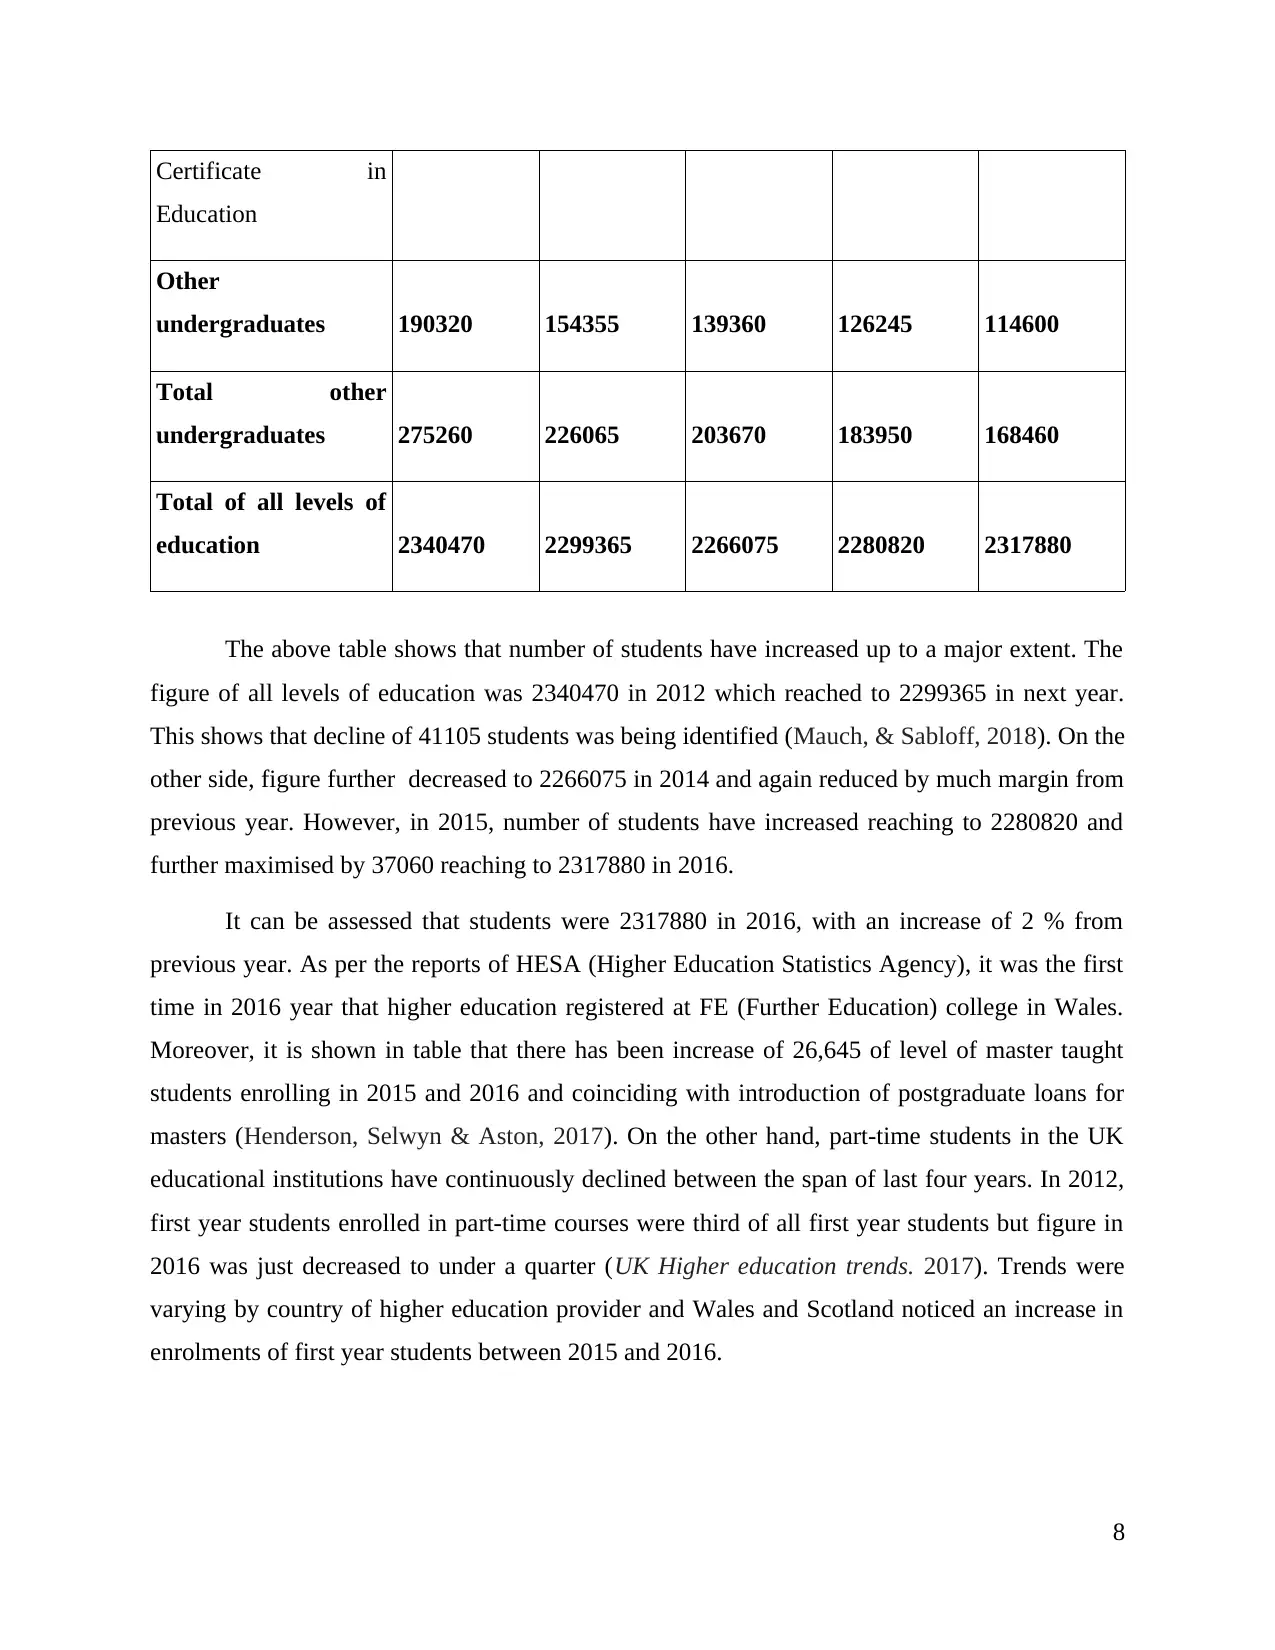
The above table shows that number of students have increased up to a major extent. The
figure of all levels of education was 2340470 in 2012 which reached to 2299365 in next year.
This shows that decline of 41105 students was being identified (Mauch, & Sabloff, 2018). On the
other side, figure further decreased to 2266075 in 2014 and again reduced by much margin from
previous year. However, in 2015, number of students have increased reaching to 2280820 and
further maximised by 37060 reaching to 2317880 in 2016.
It can be assessed that students were 2317880 in 2016, with an increase of 2 % from
previous year. As per the reports of HESA (Higher Education Statistics Agency), it was the first
time in 2016 year that higher education registered at FE (Further Education) college in Wales.
Moreover, it is shown in table that there has been increase of 26,645 of level of master taught
students enrolling in 2015 and 2016 and coinciding with introduction of postgraduate loans for
masters (Henderson, Selwyn & Aston, 2017). On the other hand, part-time students in the UK
educational institutions have continuously declined between the span of last four years. In 2012,
first year students enrolled in part-time courses were third of all first year students but figure in
2016 was just decreased to under a quarter (UK Higher education trends. 2017). Trends were
varying by country of higher education provider and Wales and Scotland noticed an increase in
enrolments of first year students between 2015 and 2016.
8
Education
Other
undergraduates 190320 154355 139360 126245 114600
Total other
undergraduates 275260 226065 203670 183950 168460
Total of all levels of
education 2340470 2299365 2266075 2280820 2317880
The above table shows that number of students have increased up to a major extent. The
figure of all levels of education was 2340470 in 2012 which reached to 2299365 in next year.
This shows that decline of 41105 students was being identified (Mauch, & Sabloff, 2018). On the
other side, figure further decreased to 2266075 in 2014 and again reduced by much margin from
previous year. However, in 2015, number of students have increased reaching to 2280820 and
further maximised by 37060 reaching to 2317880 in 2016.
It can be assessed that students were 2317880 in 2016, with an increase of 2 % from
previous year. As per the reports of HESA (Higher Education Statistics Agency), it was the first
time in 2016 year that higher education registered at FE (Further Education) college in Wales.
Moreover, it is shown in table that there has been increase of 26,645 of level of master taught
students enrolling in 2015 and 2016 and coinciding with introduction of postgraduate loans for
masters (Henderson, Selwyn & Aston, 2017). On the other hand, part-time students in the UK
educational institutions have continuously declined between the span of last four years. In 2012,
first year students enrolled in part-time courses were third of all first year students but figure in
2016 was just decreased to under a quarter (UK Higher education trends. 2017). Trends were
varying by country of higher education provider and Wales and Scotland noticed an increase in
enrolments of first year students between 2015 and 2016.
8
Paraphrase This Document
Need a fresh take? Get an instant paraphrase of this document with our AI Paraphraser
International Students
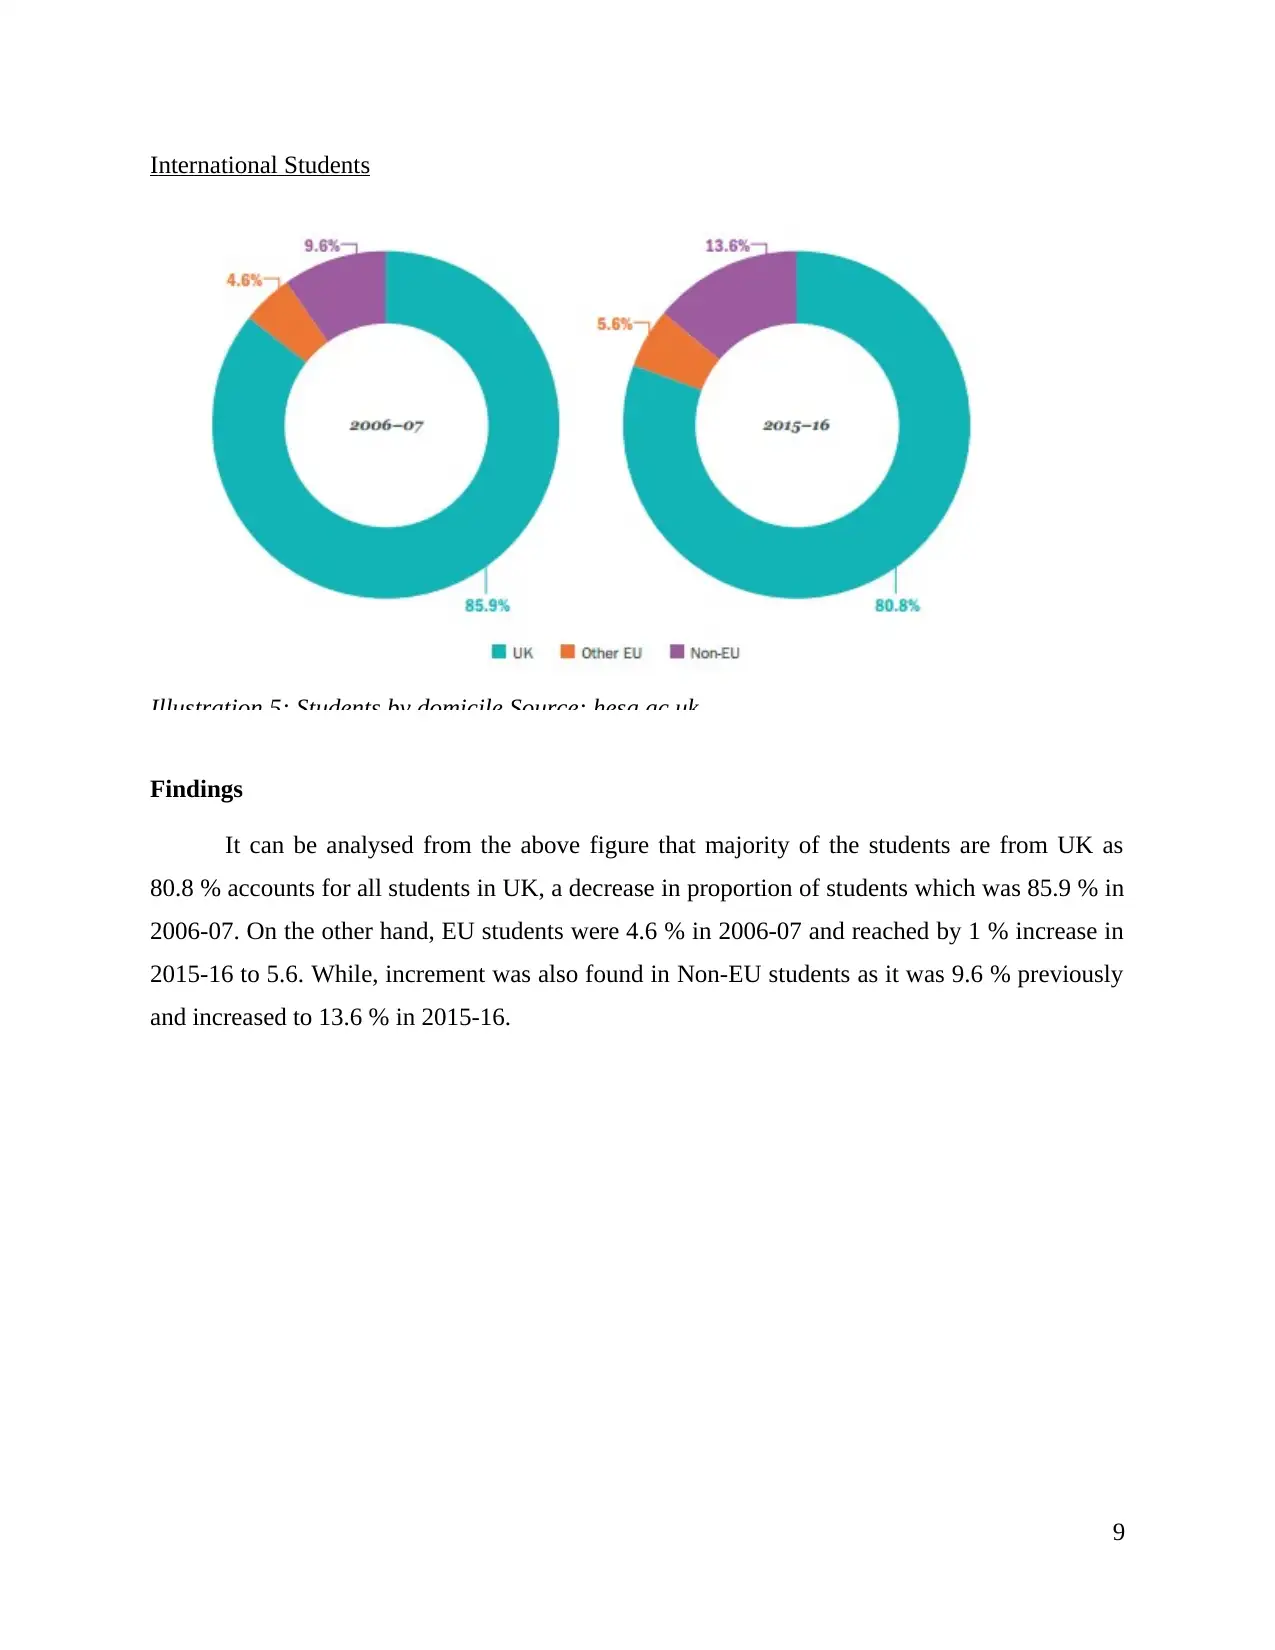
Illustration 5: Students by domicile Source: hesa.ac.uk
Findings
It can be analysed from the above figure that majority of the students are from UK as
80.8 % accounts for all students in UK, a decrease in proportion of students which was 85.9 % in
2006-07. On the other hand, EU students were 4.6 % in 2006-07 and reached by 1 % increase in
2015-16 to 5.6. While, increment was also found in Non-EU students as it was 9.6 % previously
and increased to 13.6 % in 2015-16.
9
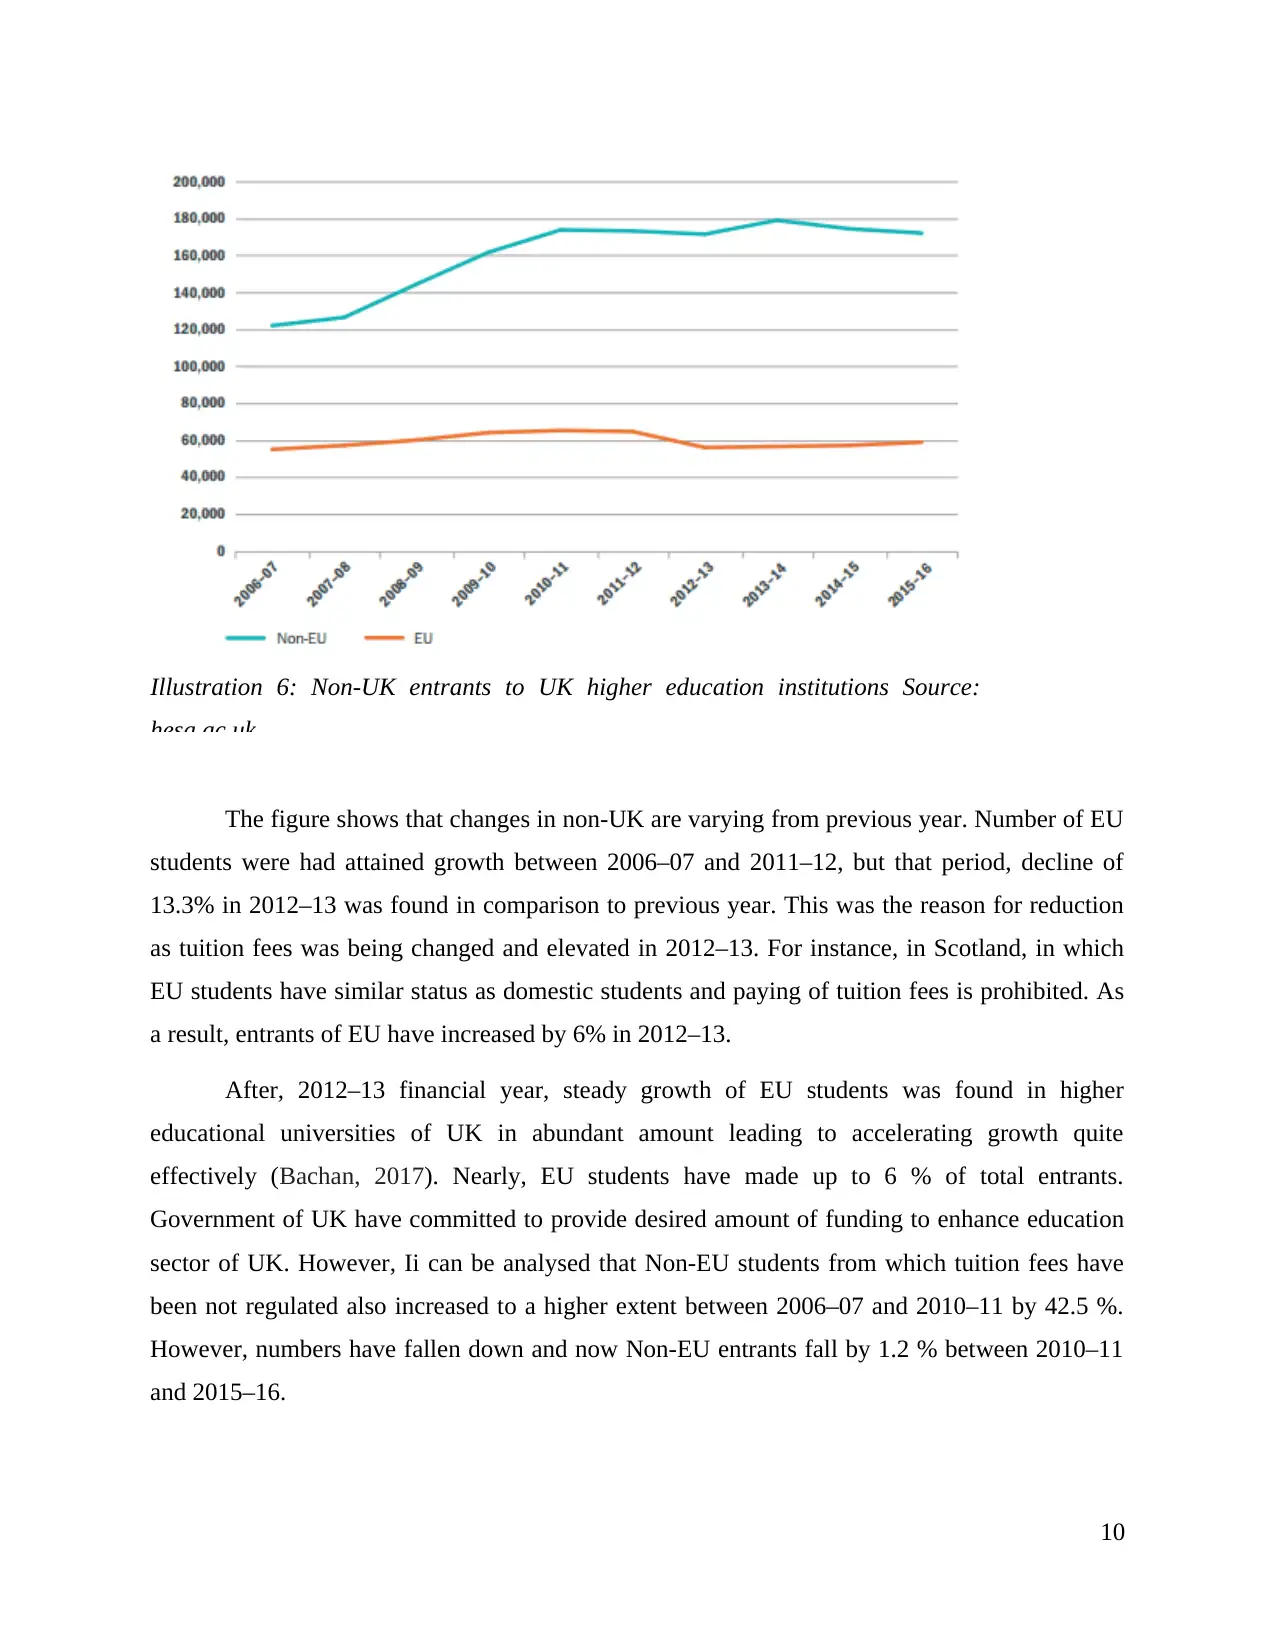
Illustration 6: Non-UK entrants to UK higher education institutions Source:
hesa.ac.uk
The figure shows that changes in non-UK are varying from previous year. Number of EU
students were had attained growth between 2006–07 and 2011–12, but that period, decline of
13.3% in 2012–13 was found in comparison to previous year. This was the reason for reduction
as tuition fees was being changed and elevated in 2012–13. For instance, in Scotland, in which
EU students have similar status as domestic students and paying of tuition fees is prohibited. As
a result, entrants of EU have increased by 6% in 2012–13.
After, 2012–13 financial year, steady growth of EU students was found in higher
educational universities of UK in abundant amount leading to accelerating growth quite
effectively (Bachan, 2017). Nearly, EU students have made up to 6 % of total entrants.
Government of UK have committed to provide desired amount of funding to enhance education
sector of UK. However, Ii can be analysed that Non-EU students from which tuition fees have
been not regulated also increased to a higher extent between 2006–07 and 2010–11 by 42.5 %.
However, numbers have fallen down and now Non-EU entrants fall by 1.2 % between 2010–11
and 2015–16.
10
⊘ This is a preview!⊘
Do you want full access?
Subscribe today to unlock all pages.
Trusted by 1+ million students worldwide
1 out of 15
Related Documents


Your All-in-One AI-Powered Toolkit for Academic Success.
+13062052269
info@desklib.com
Available 24*7 on WhatsApp / Email
![[object Object]](/_next/static/media/star-bottom.7253800d.svg)
Unlock your academic potential
Copyright © 2020–2026 A2Z Services. All Rights Reserved. Developed and managed by ZUCOL.