Analysis of UK Housing Market: Economics for Business Report
VerifiedAdded on 2021/04/21
|17
|3613
|22
Report
AI Summary
This report provides an analysis of the UK housing market, focusing on the period from 2006 to 2016. It examines key economic factors influencing house prices, including GDP growth rate, unemployment rate, buyer confidence, housing affordability, prevailing market interest rates, and demand. The report also investigates the impact of UK governmental schemes on the housing market, such as Starter Homes, Shared Ownership, and Help to Buy. The analysis reveals the fluctuations in the UK housing sector during the specified time frame, the effects of various economic indicators, and the effectiveness of government interventions. The report concludes that while government schemes initially showed promise, they ultimately failed to provide the necessary stimuli to the market. The report highlights the dynamic nature of the UK housing market and the complex interplay of economic factors and governmental policies.
Running head: ECONOMICS FOR BUSINESS
Economics for business
Name of the Student:
Name of the University:
Author notes
Economics for business
Name of the Student:
Name of the University:
Author notes
Paraphrase This Document
Need a fresh take? Get an instant paraphrase of this document with our AI Paraphraser
1ECONOMICS FOR BUSINESS
Executive summary:
To conclude it will provide a summarized overview of the analysis and state the final words
regarding the researchable. UK is one of the most developed economy in the world that has
faced large amount of immigration over the time since industrialization. With ever rising
number of the population in the country, UK has effectively truncated various economic
factors in order to provide its economy a sustainable growth. This report is meant to analyze
various factors that has contributed substantially to determine the price of the houses in the
economy. In addition to this, it will portray how the housing policies from the UK
government has affected the housing sector. From the analysis it can be seen that there has
been various factors that has led to fluctuation in the economy of the country as well as in the
housing sector too. Now, when it comes to the impact of the UK governmental scheme for
houses, then it can be seen that the schemes has been beneficial during the initial days. Thus
to conclude the analysis it can be stated that the housing sector of the UK has faced various
fluctuation over the time and though there has been governmental schemes to gauge the
situation, they have failed to provide required stimuli to the market.
2ECONOMICS FOR BUSINESS
Table of Contents
Introduction:...............................................................................................................................3
Factors that determine the price of houses from 2006 to 2016:.................................................3
Growth rate GDP:..................................................................................................................4
Rate of unemployment:..........................................................................................................5
Buyer’s confidence:...............................................................................................................6
Affordability of houses:.........................................................................................................8
Prevailing market interest rate:..............................................................................................8
Demand pull in the market:....................................................................................................9
Impact of UK governmental scheme in housing market:.........................................................11
Starter Homes:......................................................................................................................12
Shared ownership:................................................................................................................12
Help to Buy:.........................................................................................................................12
Conclusion:..............................................................................................................................13
Reference:................................................................................................................................14
⊘ This is a preview!⊘
Do you want full access?
Subscribe today to unlock all pages.
Trusted by 1+ million students worldwide
3ECONOMICS FOR BUSINESS
Introduction:
UK is one of the most developed economy in the world that has faced large amount of
immigration over the time since industrialization. With the higher amount of growth
depending upon the colonization economy, the country has become where it is now.
According to the Favell (2016), UK is one of the nations that faces highest amount of
immigration and it has made the housing sector to grow to a large extent. With ever rising
number of the population in the country, UK has effectively truncated various economic
factors in order to provide its economy a sustainable growth. One of the most prominent
sector that has faced largest amount of growth since the country started to cannonballing its
growth rate is the housing sector (Boquet 2017). However, since the last decade it has been
observed that there has been various fluctuations in the housing sector in the economy. This
report is meant to analyze various factors that has contributed substantially to determine the
price of the houses in the economy. In addition to this, it will portray how the housing
policies from the UK government has affected the housing sector.
Factors that determine the price of houses from 2006 to 2016:
UK being one of the developed nations always used to face high amount of
immigrants and the multifaceted factors faced by the UK economy, various researches has
argued that there were various factors that caused the fluctuation in the housing sector of UK
during the 2006 to 2016. According to the researchers like Wilcox (2014), 2006 to 2016 can
be considered as one of the best time for the UK housing society that caused both the highest
growth and highest fall in the UK housing sector over the last five decades. Various factors
that aided to determination of the UK housing prices from the given time period are as
follows:
Paraphrase This Document
Need a fresh take? Get an instant paraphrase of this document with our AI Paraphraser
4ECONOMICS FOR BUSINESS
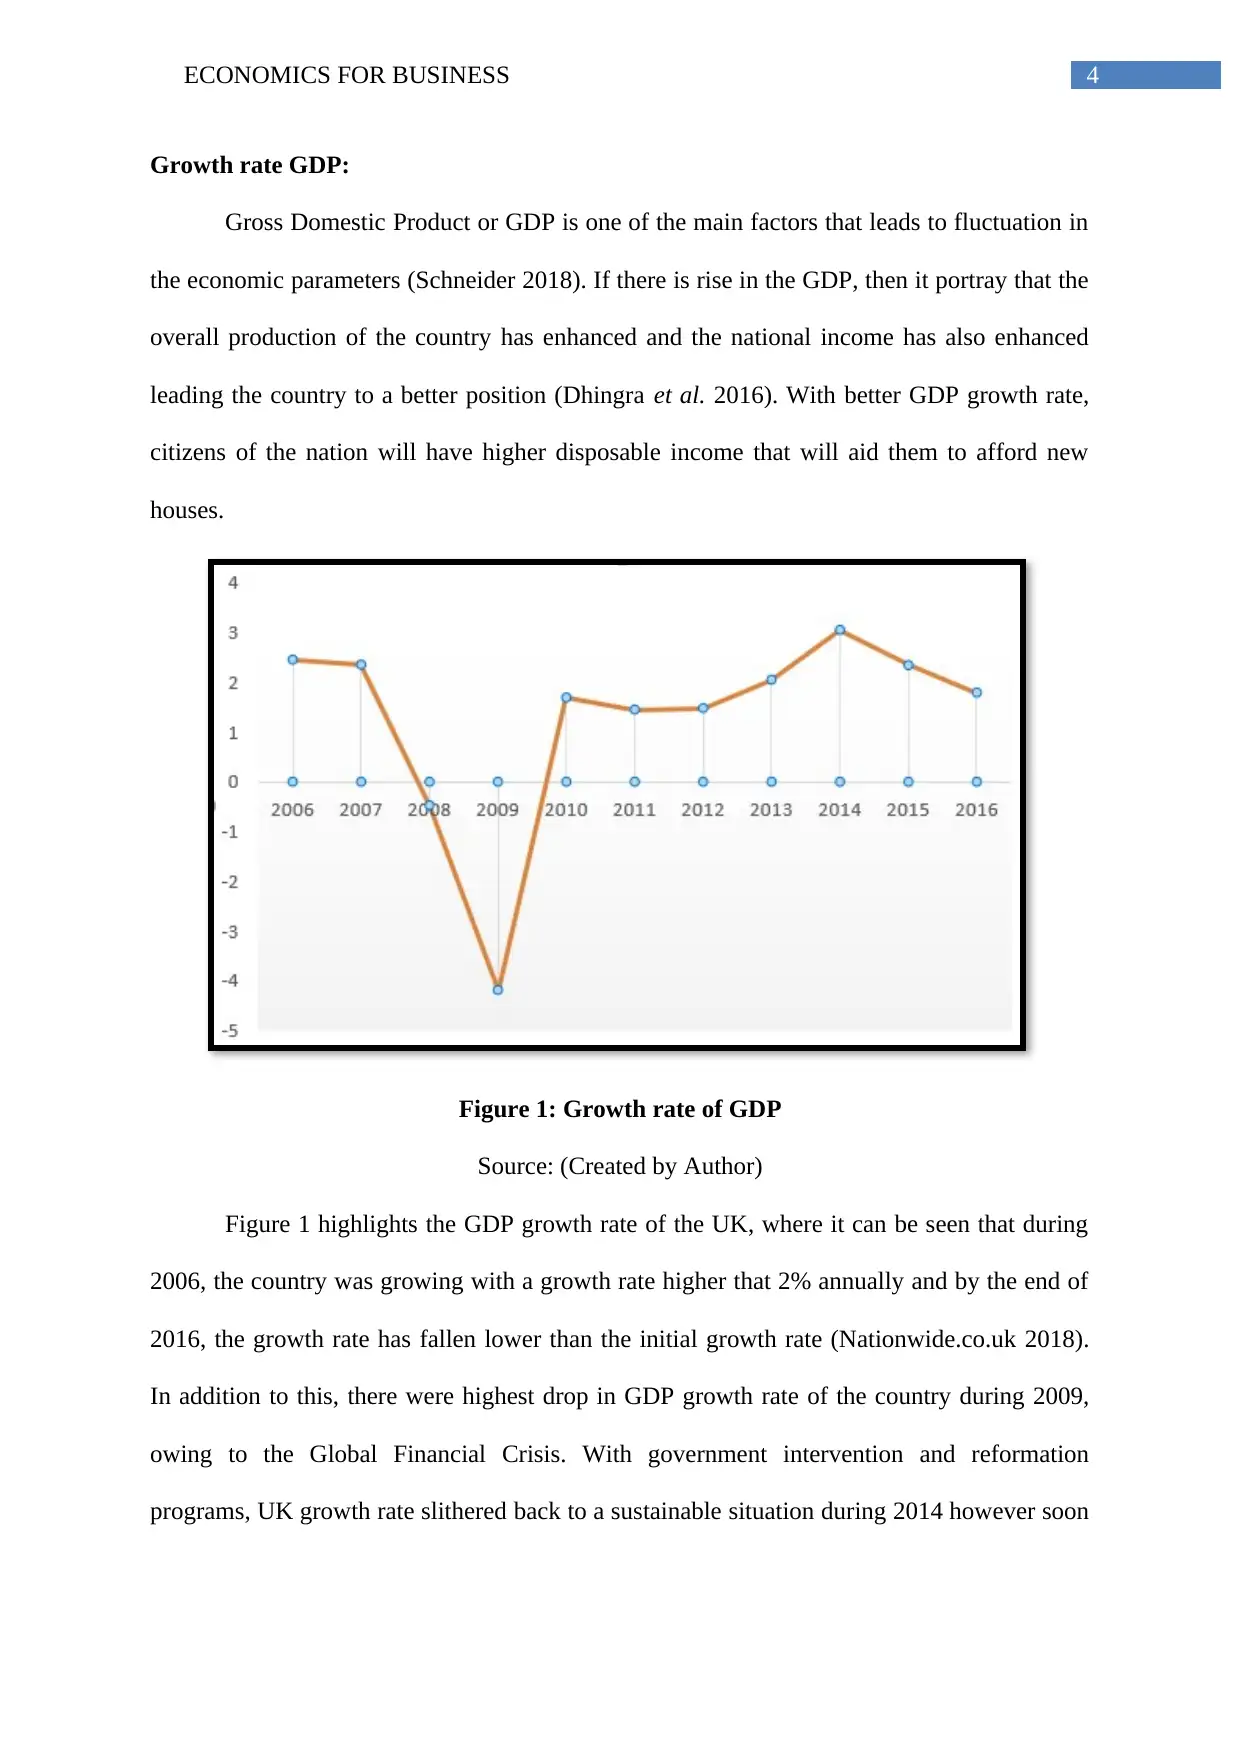
Growth rate GDP:
Gross Domestic Product or GDP is one of the main factors that leads to fluctuation in
the economic parameters (Schneider 2018). If there is rise in the GDP, then it portray that the
overall production of the country has enhanced and the national income has also enhanced
leading the country to a better position (Dhingra et al. 2016). With better GDP growth rate,
citizens of the nation will have higher disposable income that will aid them to afford new
houses.
Figure 1: Growth rate of GDP
Source: (Created by Author)
Figure 1 highlights the GDP growth rate of the UK, where it can be seen that during
2006, the country was growing with a growth rate higher that 2% annually and by the end of
2016, the growth rate has fallen lower than the initial growth rate (Nationwide.co.uk 2018).
In addition to this, there were highest drop in GDP growth rate of the country during 2009,
owing to the Global Financial Crisis. With government intervention and reformation
programs, UK growth rate slithered back to a sustainable situation during 2014 however soon
5ECONOMICS FOR BUSINESS
it started to fall. Thus it can be stated that GDP growth is an important factor that determine
the housing price in UK.
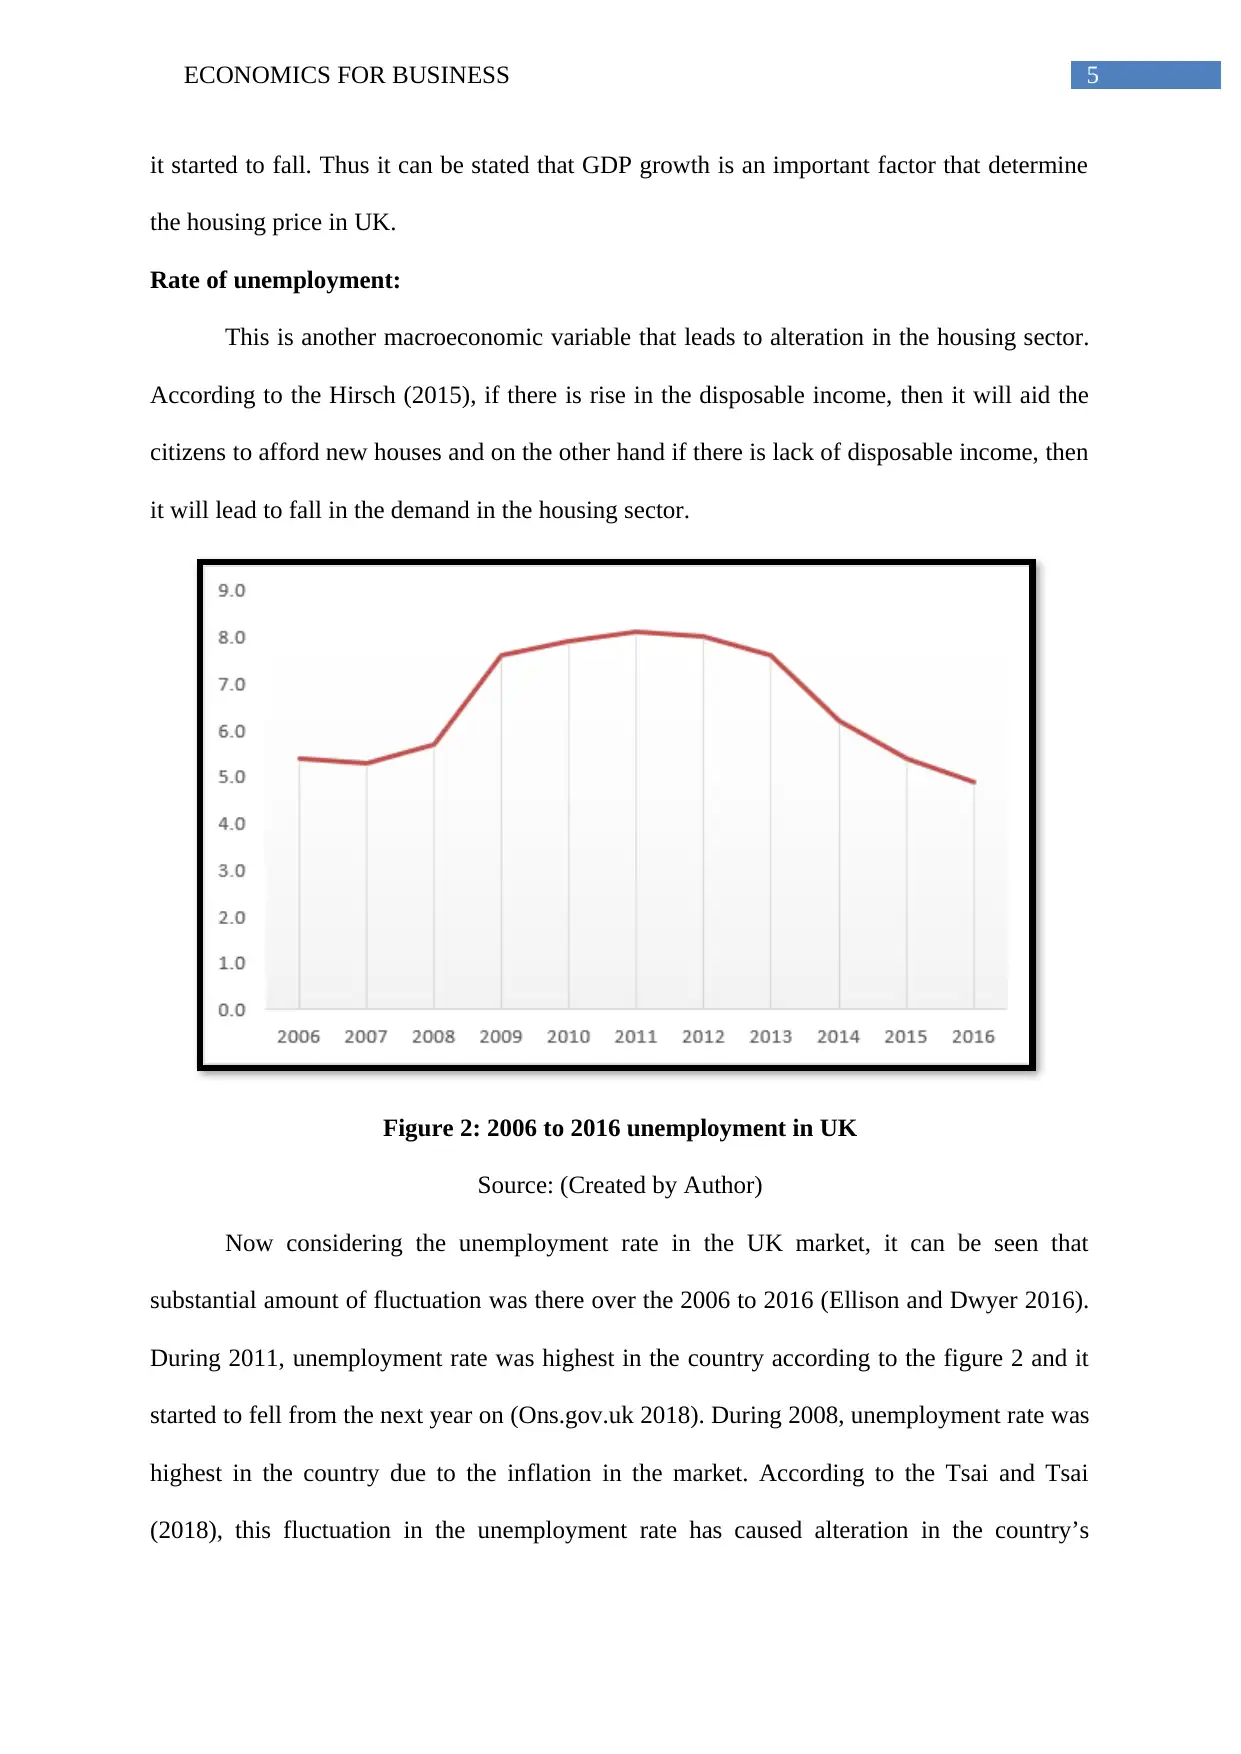
Rate of unemployment:
This is another macroeconomic variable that leads to alteration in the housing sector.
According to the Hirsch (2015), if there is rise in the disposable income, then it will aid the
citizens to afford new houses and on the other hand if there is lack of disposable income, then
it will lead to fall in the demand in the housing sector.
Figure 2: 2006 to 2016 unemployment in UK
Source: (Created by Author)
Now considering the unemployment rate in the UK market, it can be seen that
substantial amount of fluctuation was there over the 2006 to 2016 (Ellison and Dwyer 2016).
During 2011, unemployment rate was highest in the country according to the figure 2 and it
started to fell from the next year on (Ons.gov.uk 2018). During 2008, unemployment rate was
highest in the country due to the inflation in the market. According to the Tsai and Tsai
(2018), this fluctuation in the unemployment rate has caused alteration in the country’s
it started to fall. Thus it can be stated that GDP growth is an important factor that determine
the housing price in UK.
Rate of unemployment:
This is another macroeconomic variable that leads to alteration in the housing sector.
According to the Hirsch (2015), if there is rise in the disposable income, then it will aid the
citizens to afford new houses and on the other hand if there is lack of disposable income, then
it will lead to fall in the demand in the housing sector.
Figure 2: 2006 to 2016 unemployment in UK
Source: (Created by Author)
Now considering the unemployment rate in the UK market, it can be seen that
substantial amount of fluctuation was there over the 2006 to 2016 (Ellison and Dwyer 2016).
During 2011, unemployment rate was highest in the country according to the figure 2 and it
started to fell from the next year on (Ons.gov.uk 2018). During 2008, unemployment rate was
highest in the country due to the inflation in the market. According to the Tsai and Tsai
(2018), this fluctuation in the unemployment rate has caused alteration in the country’s
⊘ This is a preview!⊘
Do you want full access?
Subscribe today to unlock all pages.
Trusted by 1+ million students worldwide
6ECONOMICS FOR BUSINESS
housing sector and the slight high rate of unemployment from natural unemployment rate has
caused fall in the market demand leading to fall in the price of the new houses.
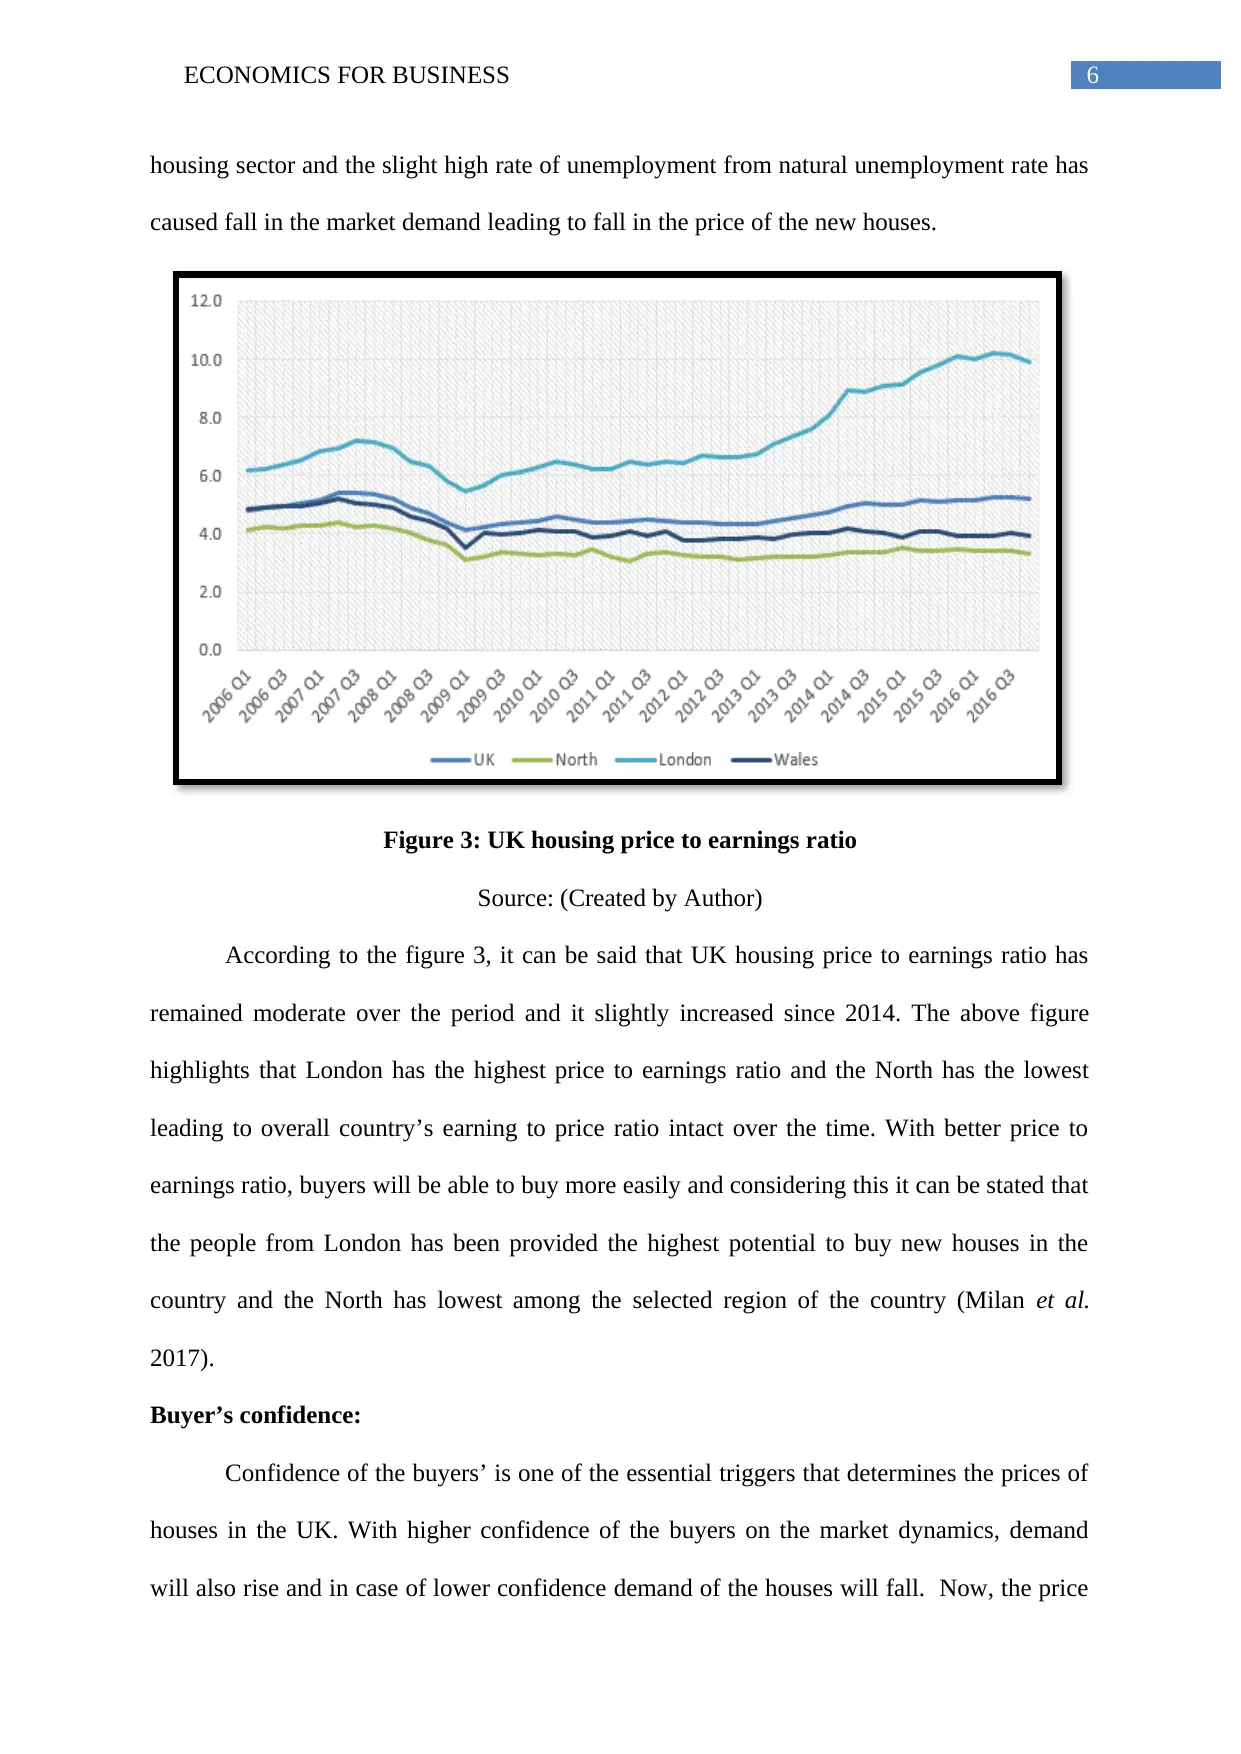
Figure 3: UK housing price to earnings ratio
Source: (Created by Author)
According to the figure 3, it can be said that UK housing price to earnings ratio has
remained moderate over the period and it slightly increased since 2014. The above figure
highlights that London has the highest price to earnings ratio and the North has the lowest
leading to overall country’s earning to price ratio intact over the time. With better price to
earnings ratio, buyers will be able to buy more easily and considering this it can be stated that
the people from London has been provided the highest potential to buy new houses in the
country and the North has lowest among the selected region of the country (Milan et al.
2017).
Buyer’s confidence:
Confidence of the buyers’ is one of the essential triggers that determines the prices of
houses in the UK. With higher confidence of the buyers on the market dynamics, demand
will also rise and in case of lower confidence demand of the houses will fall. Now, the price
housing sector and the slight high rate of unemployment from natural unemployment rate has
caused fall in the market demand leading to fall in the price of the new houses.
Figure 3: UK housing price to earnings ratio
Source: (Created by Author)
According to the figure 3, it can be said that UK housing price to earnings ratio has
remained moderate over the period and it slightly increased since 2014. The above figure
highlights that London has the highest price to earnings ratio and the North has the lowest
leading to overall country’s earning to price ratio intact over the time. With better price to
earnings ratio, buyers will be able to buy more easily and considering this it can be stated that
the people from London has been provided the highest potential to buy new houses in the
country and the North has lowest among the selected region of the country (Milan et al.
2017).
Buyer’s confidence:
Confidence of the buyers’ is one of the essential triggers that determines the prices of
houses in the UK. With higher confidence of the buyers on the market dynamics, demand
will also rise and in case of lower confidence demand of the houses will fall. Now, the price
Paraphrase This Document
Need a fresh take? Get an instant paraphrase of this document with our AI Paraphraser
7ECONOMICS FOR BUSINESS
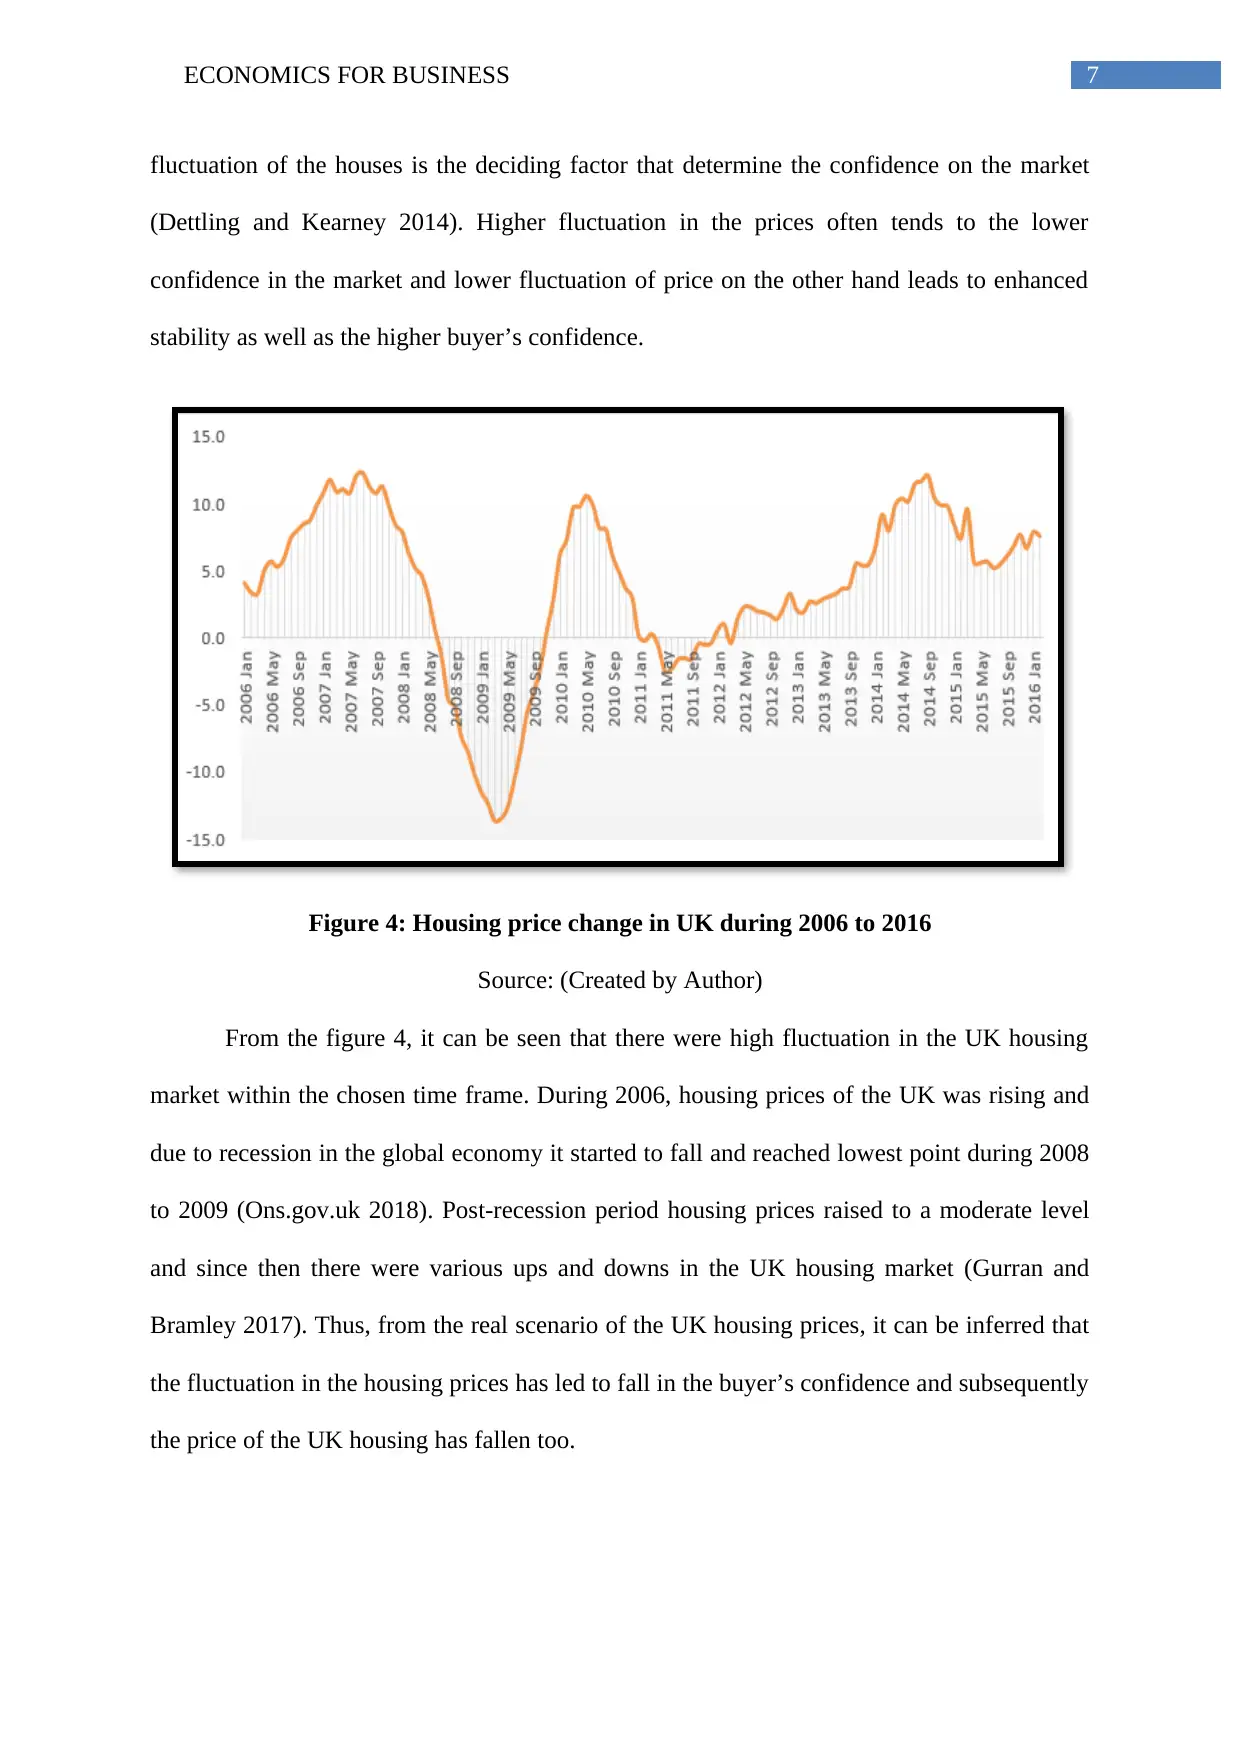
fluctuation of the houses is the deciding factor that determine the confidence on the market
(Dettling and Kearney 2014). Higher fluctuation in the prices often tends to the lower
confidence in the market and lower fluctuation of price on the other hand leads to enhanced
stability as well as the higher buyer’s confidence.
Figure 4: Housing price change in UK during 2006 to 2016
Source: (Created by Author)
From the figure 4, it can be seen that there were high fluctuation in the UK housing
market within the chosen time frame. During 2006, housing prices of the UK was rising and
due to recession in the global economy it started to fall and reached lowest point during 2008
to 2009 (Ons.gov.uk 2018). Post-recession period housing prices raised to a moderate level
and since then there were various ups and downs in the UK housing market (Gurran and
Bramley 2017). Thus, from the real scenario of the UK housing prices, it can be inferred that
the fluctuation in the housing prices has led to fall in the buyer’s confidence and subsequently
the price of the UK housing has fallen too.
8ECONOMICS FOR BUSINESS
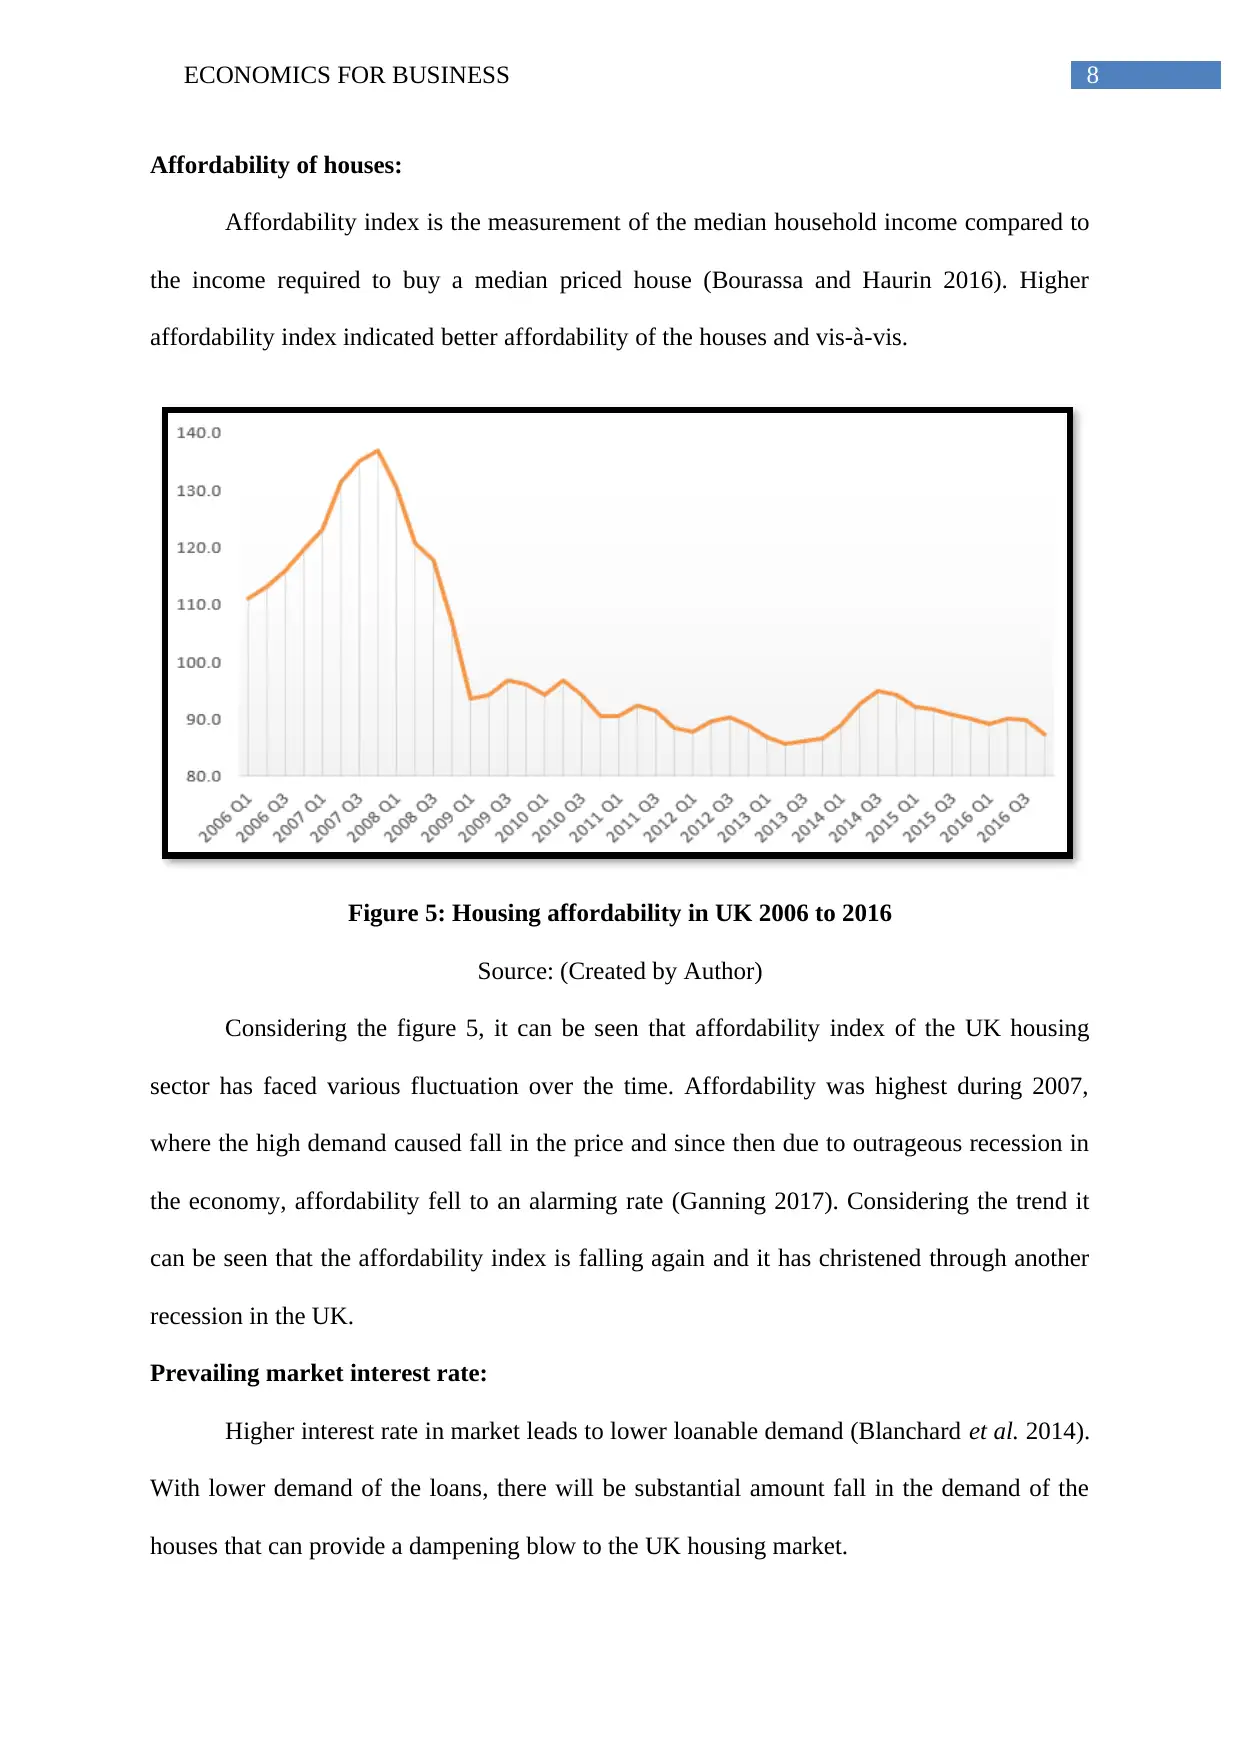
Affordability of houses:
Affordability index is the measurement of the median household income compared to
the income required to buy a median priced house (Bourassa and Haurin 2016). Higher
affordability index indicated better affordability of the houses and vis-à-vis.
Figure 5: Housing affordability in UK 2006 to 2016
Source: (Created by Author)
Considering the figure 5, it can be seen that affordability index of the UK housing
sector has faced various fluctuation over the time. Affordability was highest during 2007,
where the high demand caused fall in the price and since then due to outrageous recession in
the economy, affordability fell to an alarming rate (Ganning 2017). Considering the trend it
can be seen that the affordability index is falling again and it has christened through another
recession in the UK.
Prevailing market interest rate:
Higher interest rate in market leads to lower loanable demand (Blanchard et al. 2014).
With lower demand of the loans, there will be substantial amount fall in the demand of the
houses that can provide a dampening blow to the UK housing market.
⊘ This is a preview!⊘
Do you want full access?
Subscribe today to unlock all pages.
Trusted by 1+ million students worldwide
9ECONOMICS FOR BUSINESS
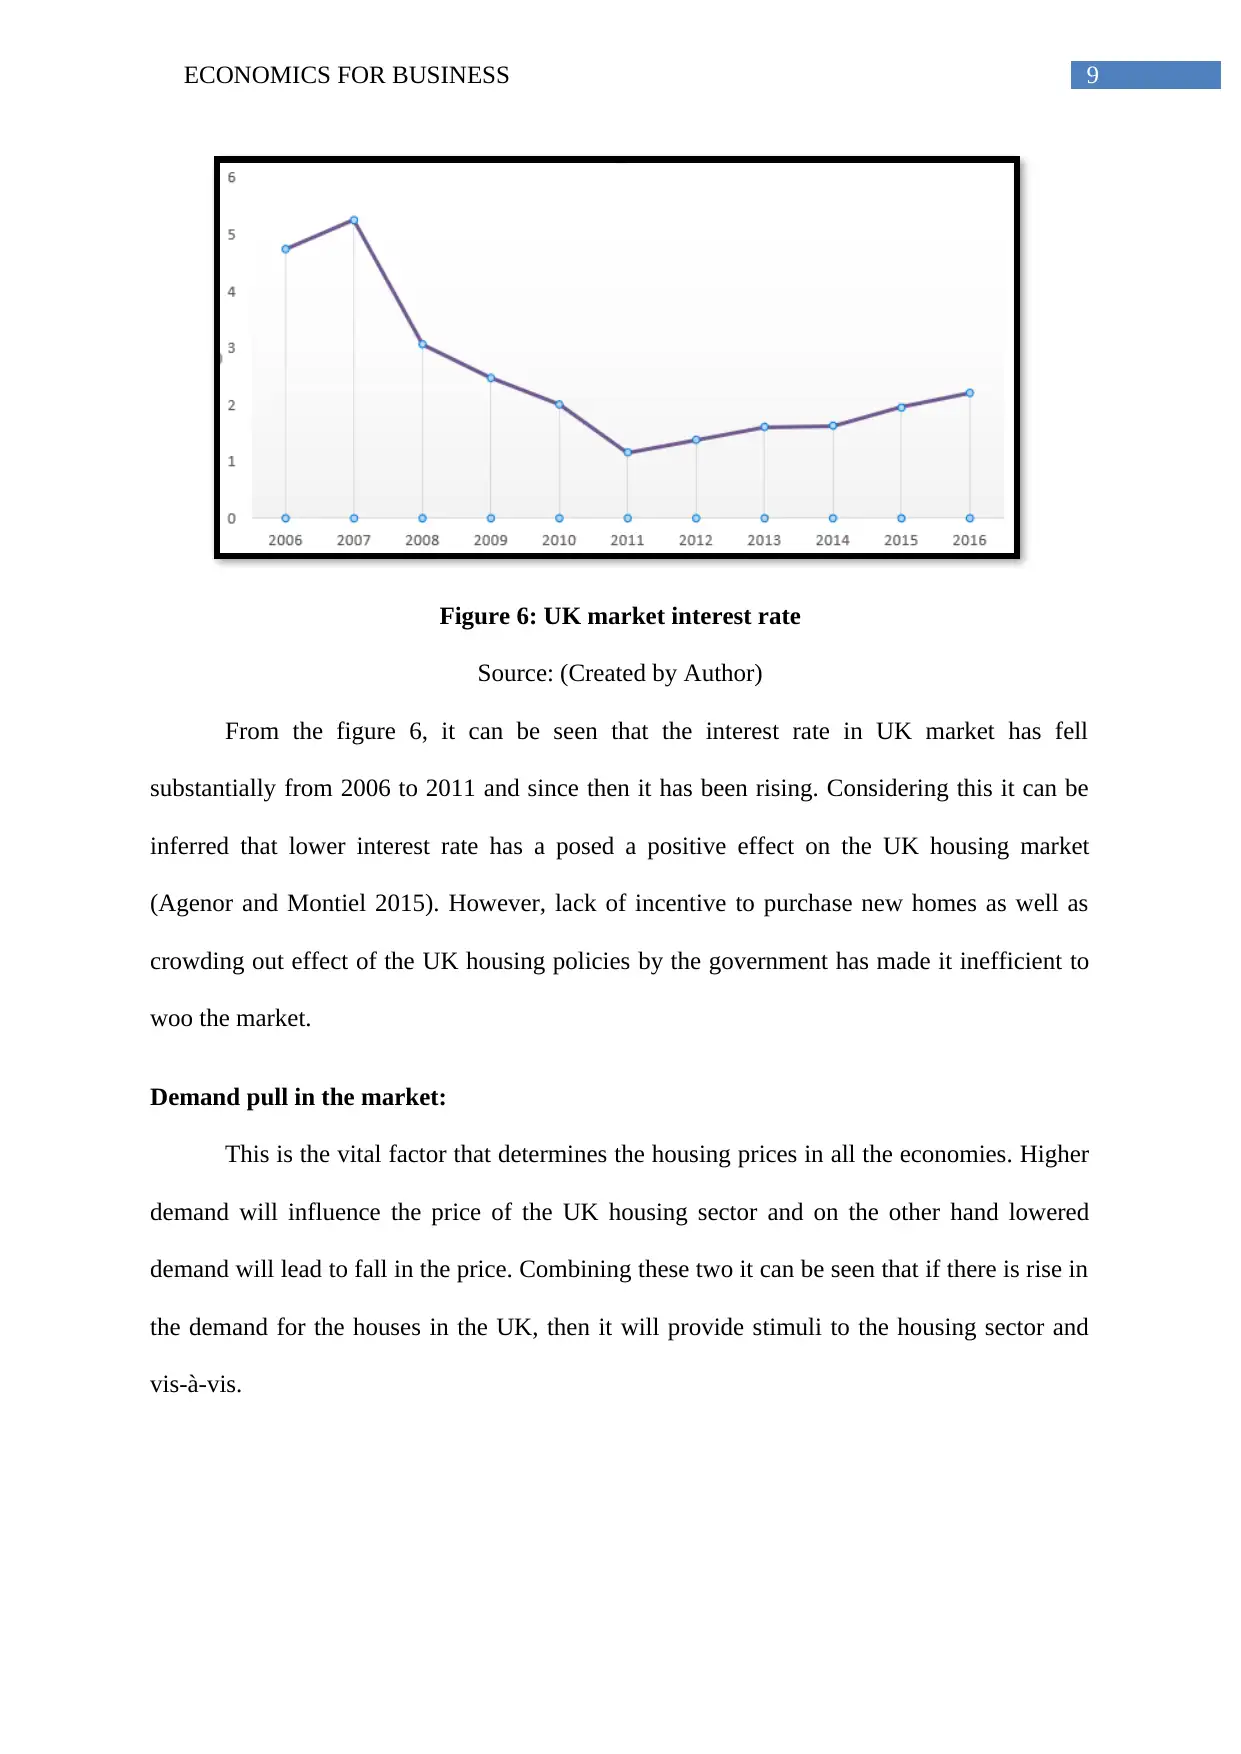
Figure 6: UK market interest rate
Source: (Created by Author)
From the figure 6, it can be seen that the interest rate in UK market has fell
substantially from 2006 to 2011 and since then it has been rising. Considering this it can be
inferred that lower interest rate has a posed a positive effect on the UK housing market
(Agenor and Montiel 2015). However, lack of incentive to purchase new homes as well as
crowding out effect of the UK housing policies by the government has made it inefficient to
woo the market.
Demand pull in the market:
This is the vital factor that determines the housing prices in all the economies. Higher
demand will influence the price of the UK housing sector and on the other hand lowered
demand will lead to fall in the price. Combining these two it can be seen that if there is rise in
the demand for the houses in the UK, then it will provide stimuli to the housing sector and
vis-à-vis.
Paraphrase This Document
Need a fresh take? Get an instant paraphrase of this document with our AI Paraphraser
10ECONOMICS FOR BUSINESS
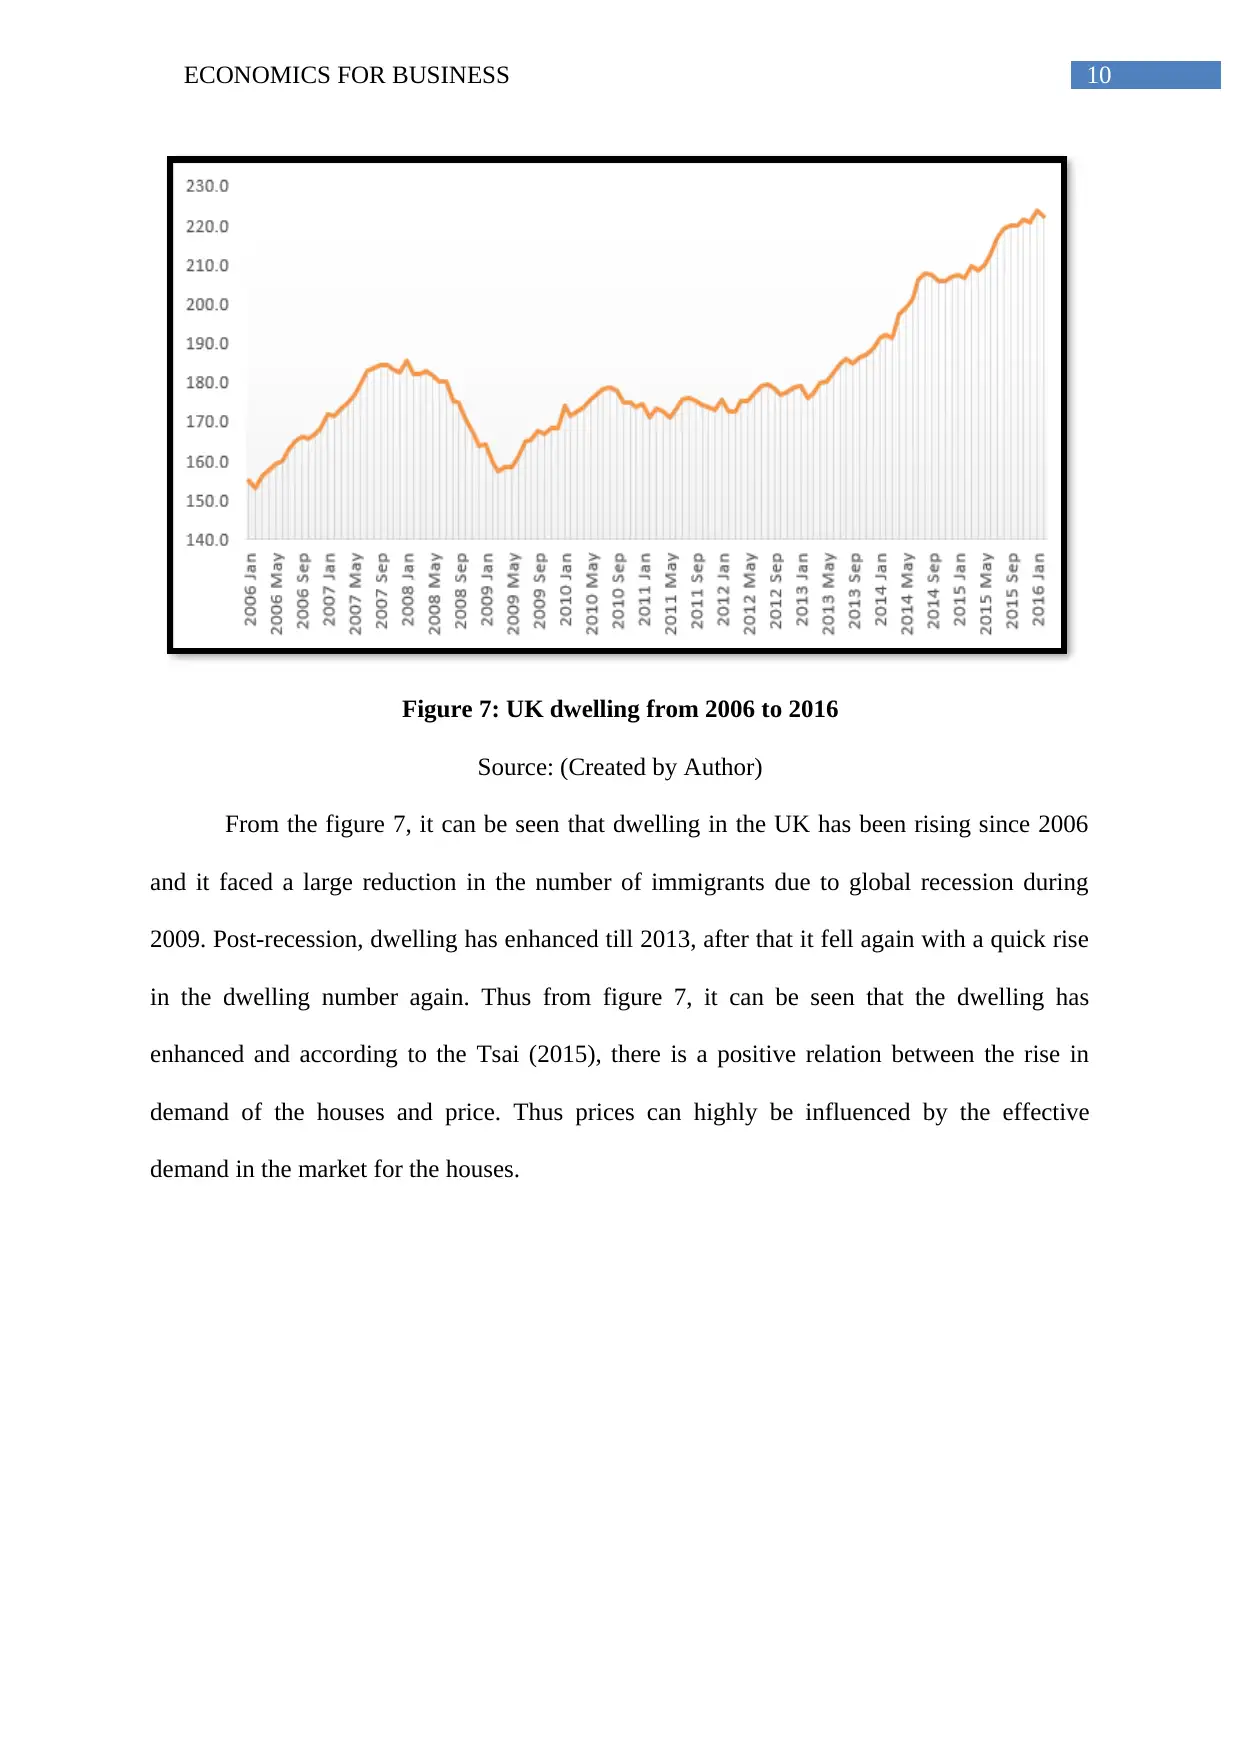
Figure 7: UK dwelling from 2006 to 2016
Source: (Created by Author)
From the figure 7, it can be seen that dwelling in the UK has been rising since 2006
and it faced a large reduction in the number of immigrants due to global recession during
2009. Post-recession, dwelling has enhanced till 2013, after that it fell again with a quick rise
in the dwelling number again. Thus from figure 7, it can be seen that the dwelling has
enhanced and according to the Tsai (2015), there is a positive relation between the rise in
demand of the houses and price. Thus prices can highly be influenced by the effective
demand in the market for the houses.
11ECONOMICS FOR BUSINESS
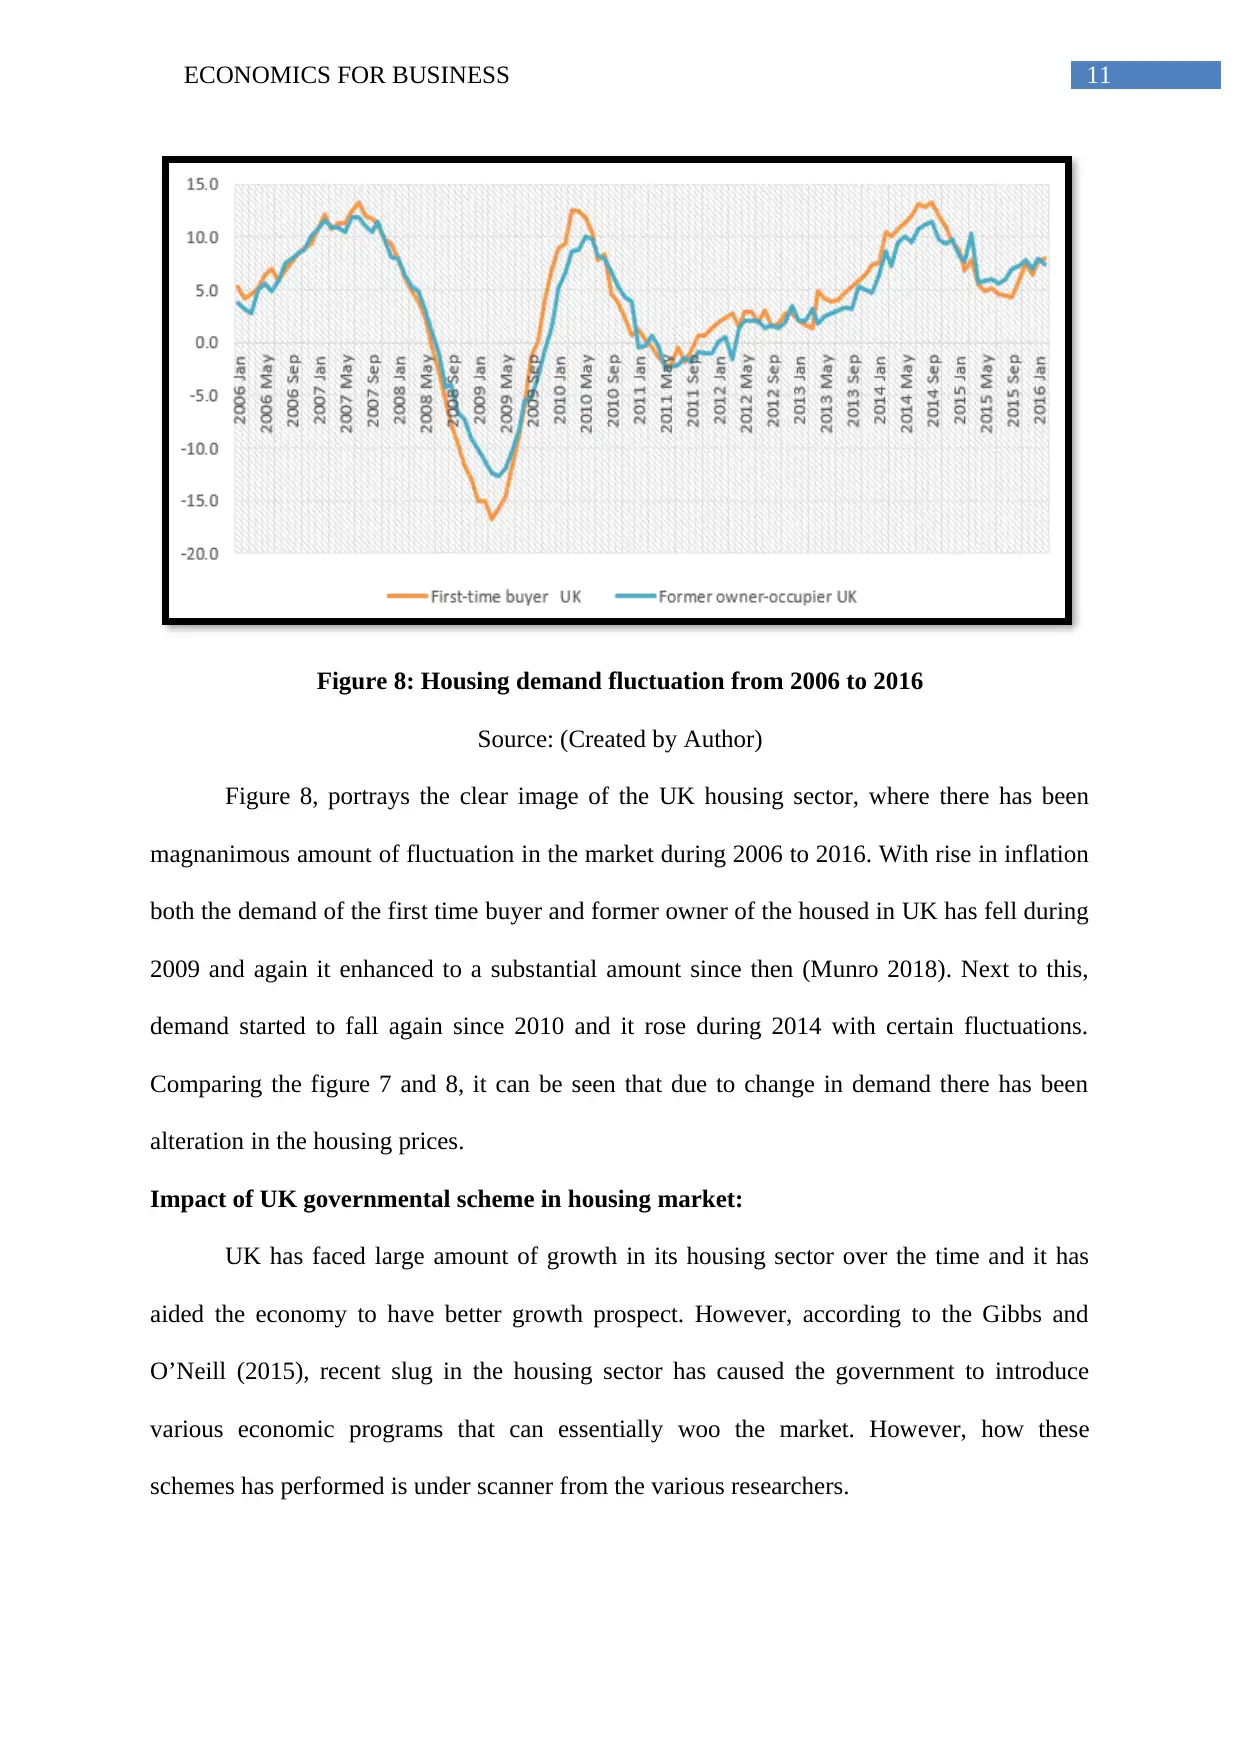
Figure 8: Housing demand fluctuation from 2006 to 2016
Source: (Created by Author)
Figure 8, portrays the clear image of the UK housing sector, where there has been
magnanimous amount of fluctuation in the market during 2006 to 2016. With rise in inflation
both the demand of the first time buyer and former owner of the housed in UK has fell during
2009 and again it enhanced to a substantial amount since then (Munro 2018). Next to this,
demand started to fall again since 2010 and it rose during 2014 with certain fluctuations.
Comparing the figure 7 and 8, it can be seen that due to change in demand there has been
alteration in the housing prices.
Impact of UK governmental scheme in housing market:
UK has faced large amount of growth in its housing sector over the time and it has
aided the economy to have better growth prospect. However, according to the Gibbs and
O’Neill (2015), recent slug in the housing sector has caused the government to introduce
various economic programs that can essentially woo the market. However, how these
schemes has performed is under scanner from the various researchers.
⊘ This is a preview!⊘
Do you want full access?
Subscribe today to unlock all pages.
Trusted by 1+ million students worldwide
1 out of 17
Related Documents


Your All-in-One AI-Powered Toolkit for Academic Success.
+13062052269
info@desklib.com
Available 24*7 on WhatsApp / Email
![[object Object]](/_next/static/media/star-bottom.7253800d.svg)
Unlock your academic potential
Copyright © 2020–2026 A2Z Services. All Rights Reserved. Developed and managed by ZUCOL.