Economics Assignment: UK Housing Market and Rent Increases Analysis

Verified

Added on  2023/06/08

|11
|1871
|172
Report
AI Summary
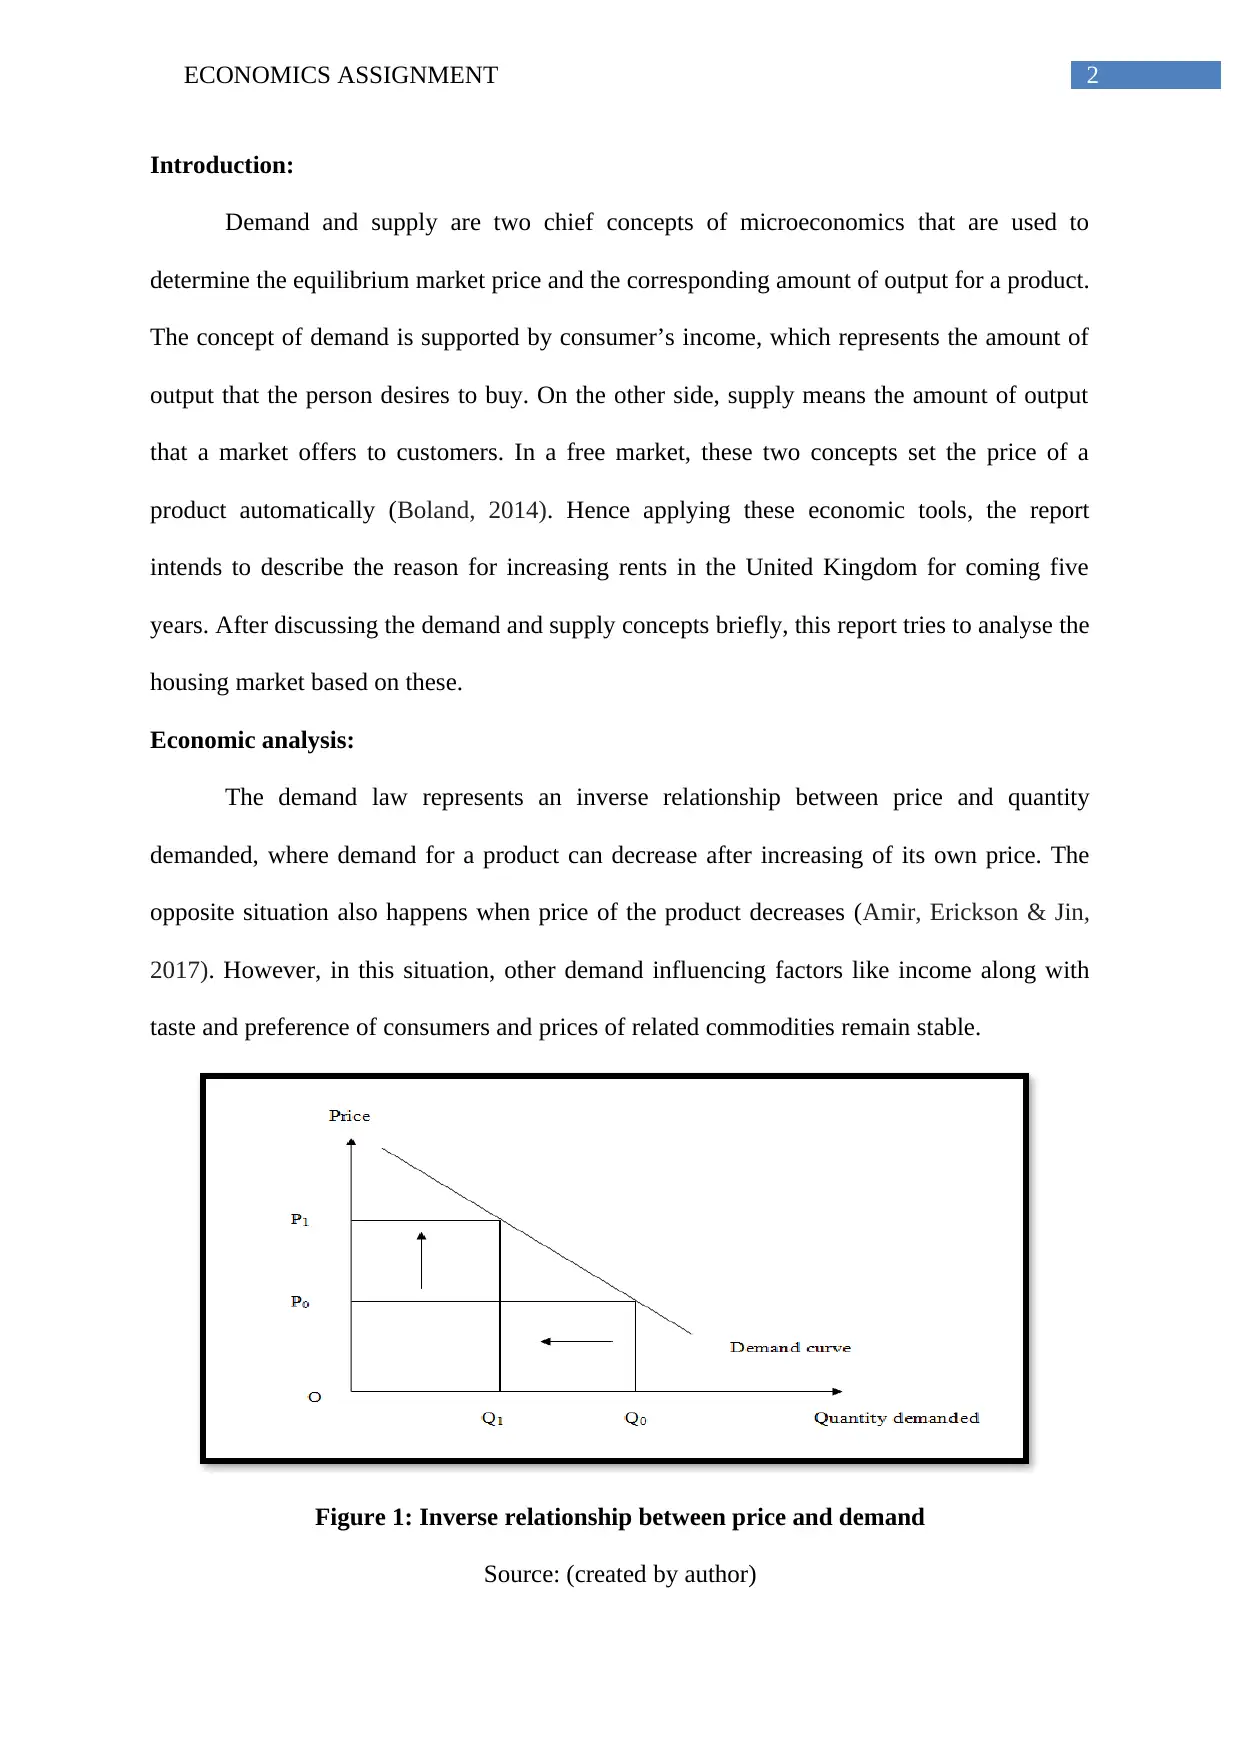
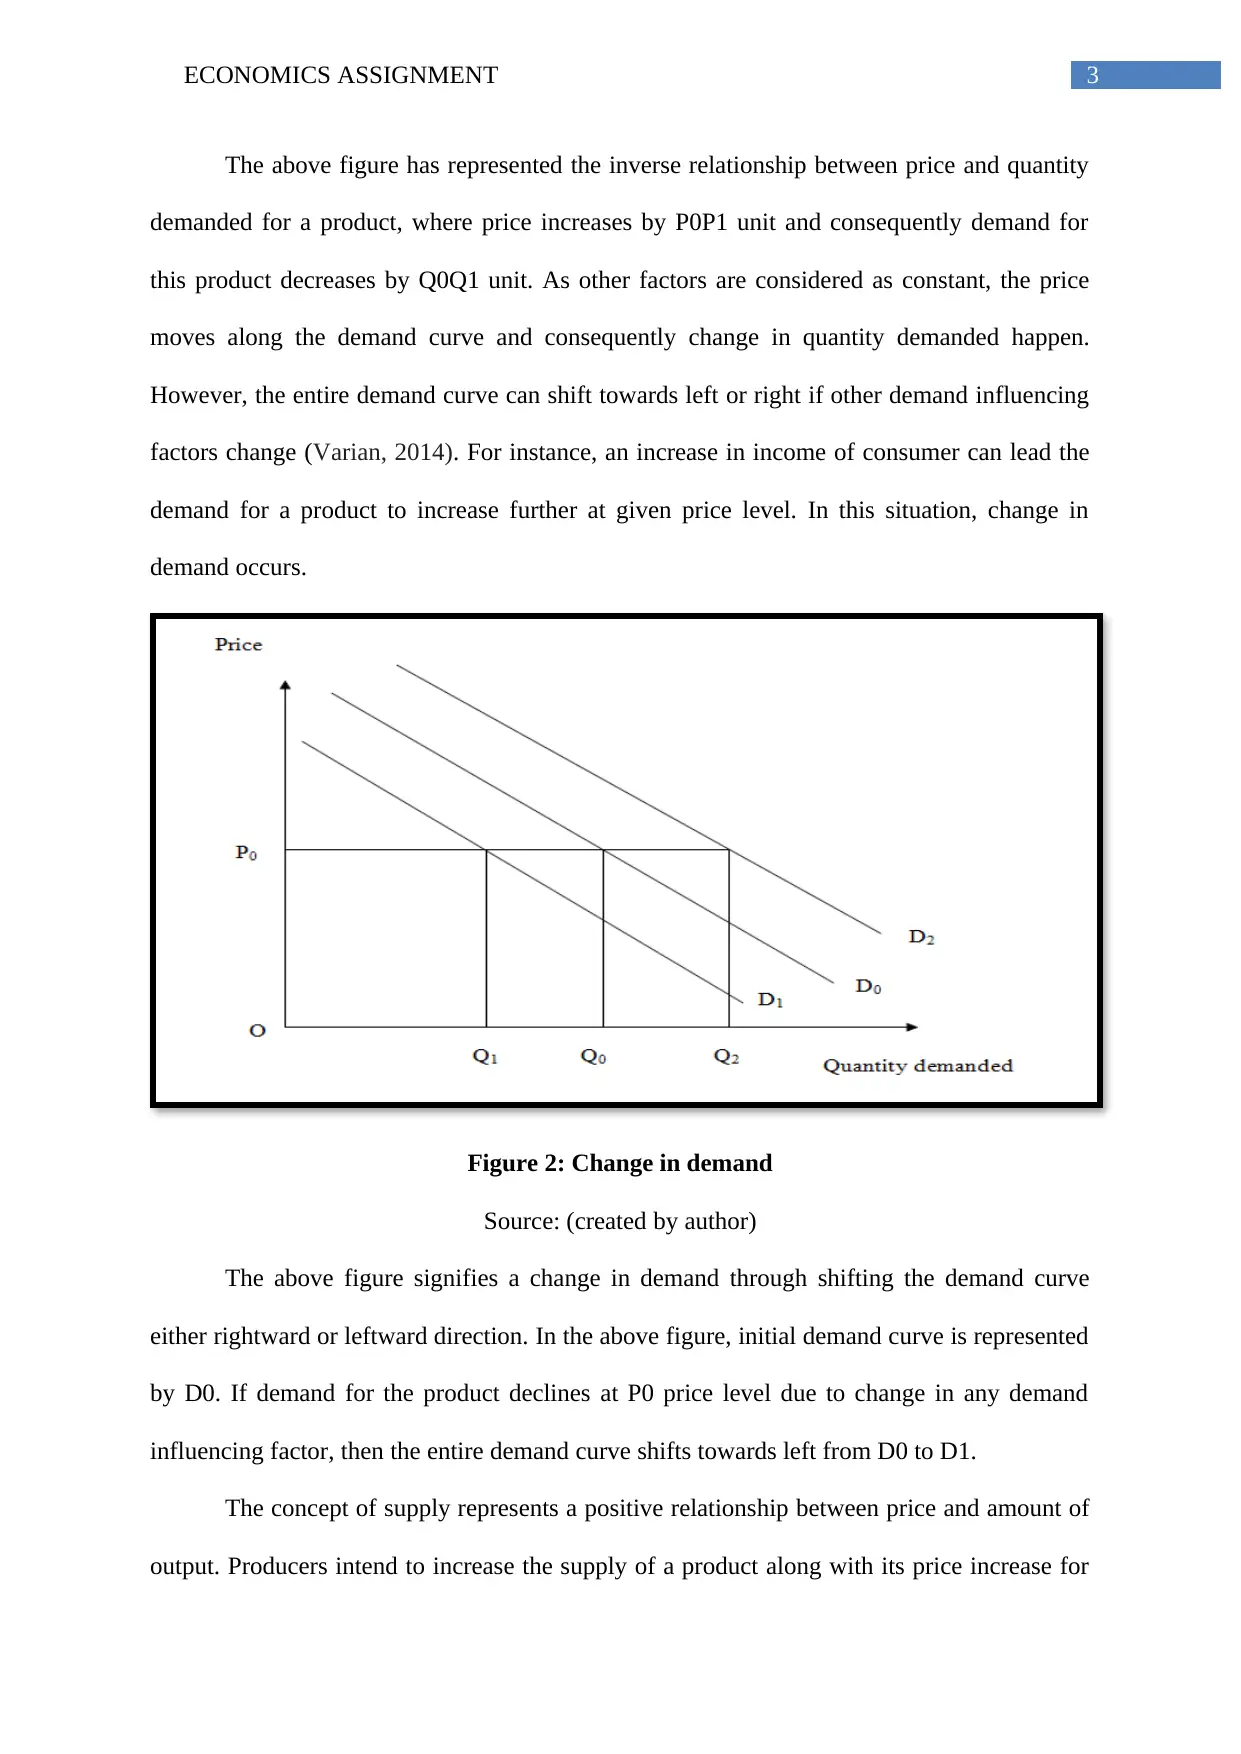
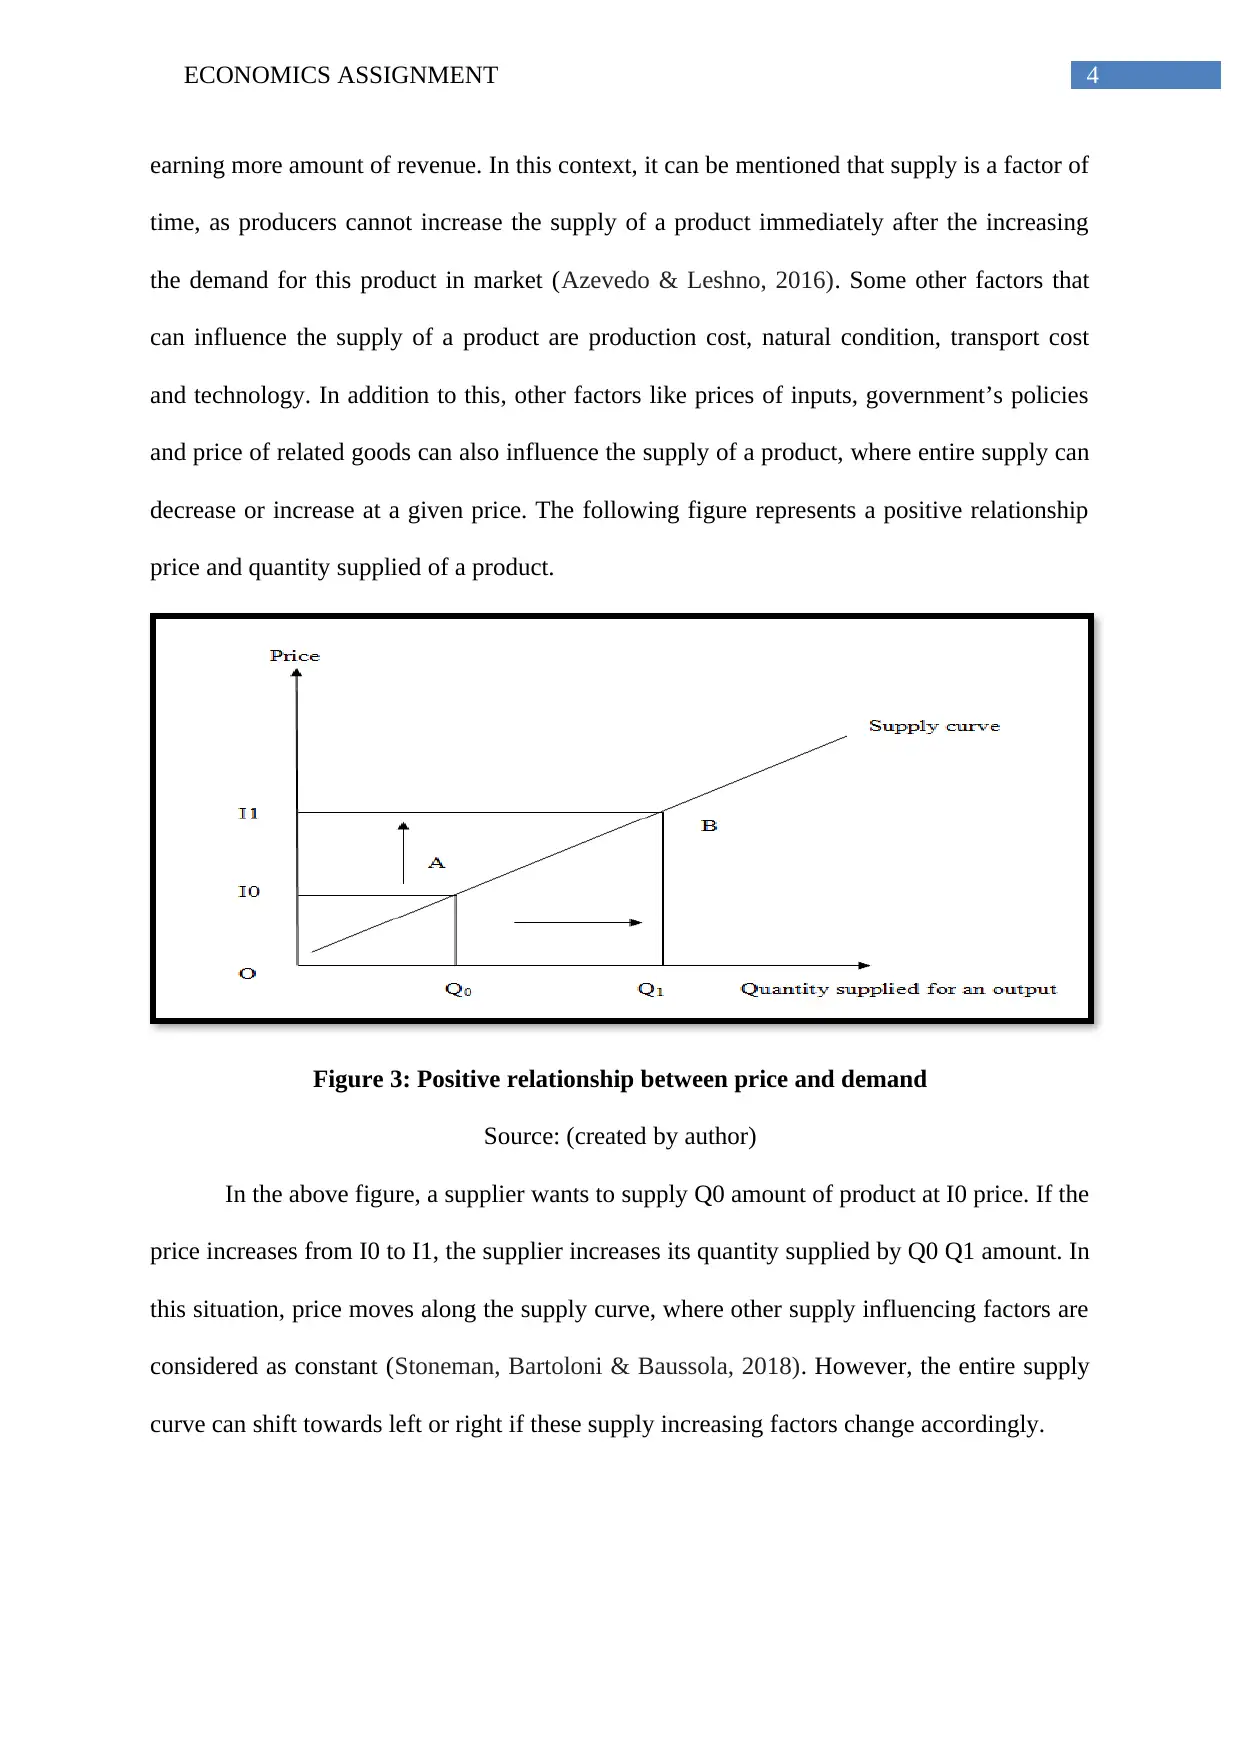
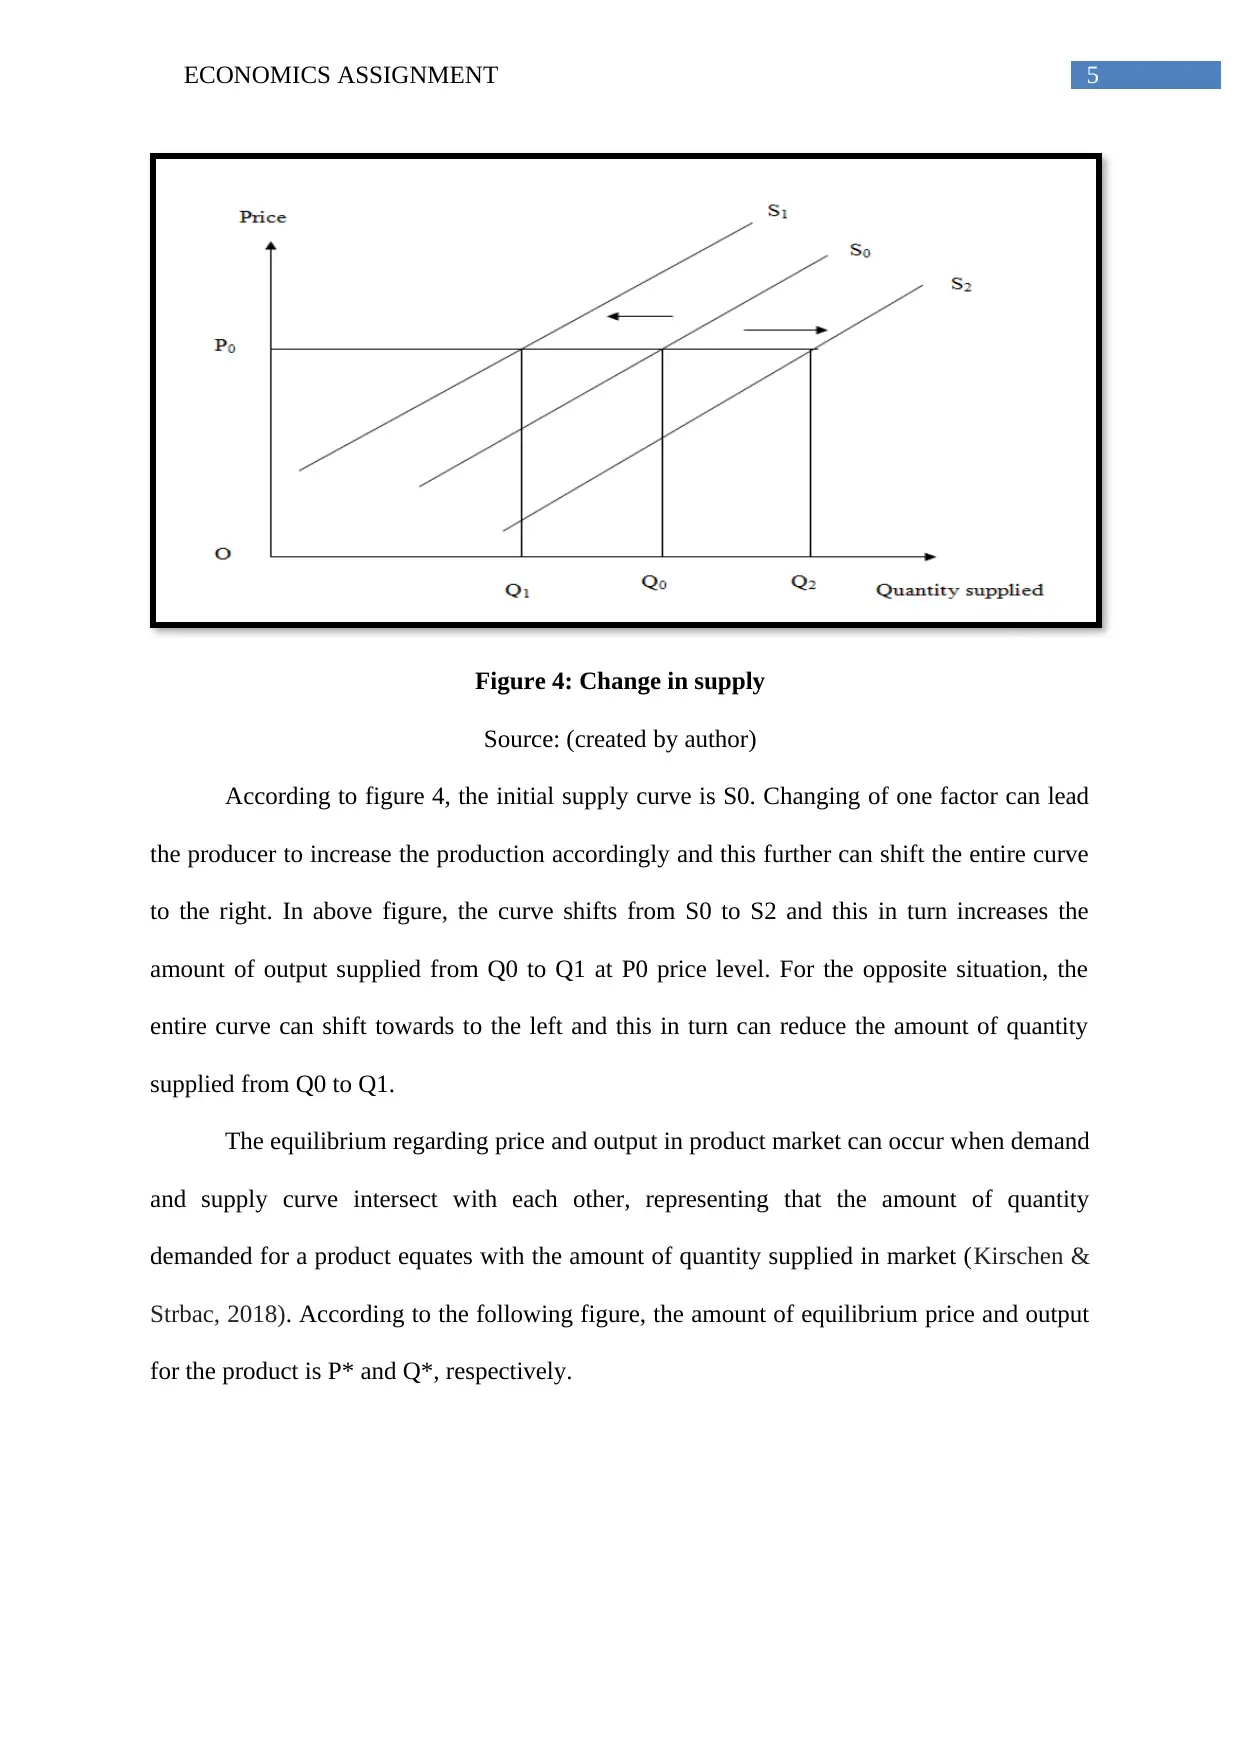
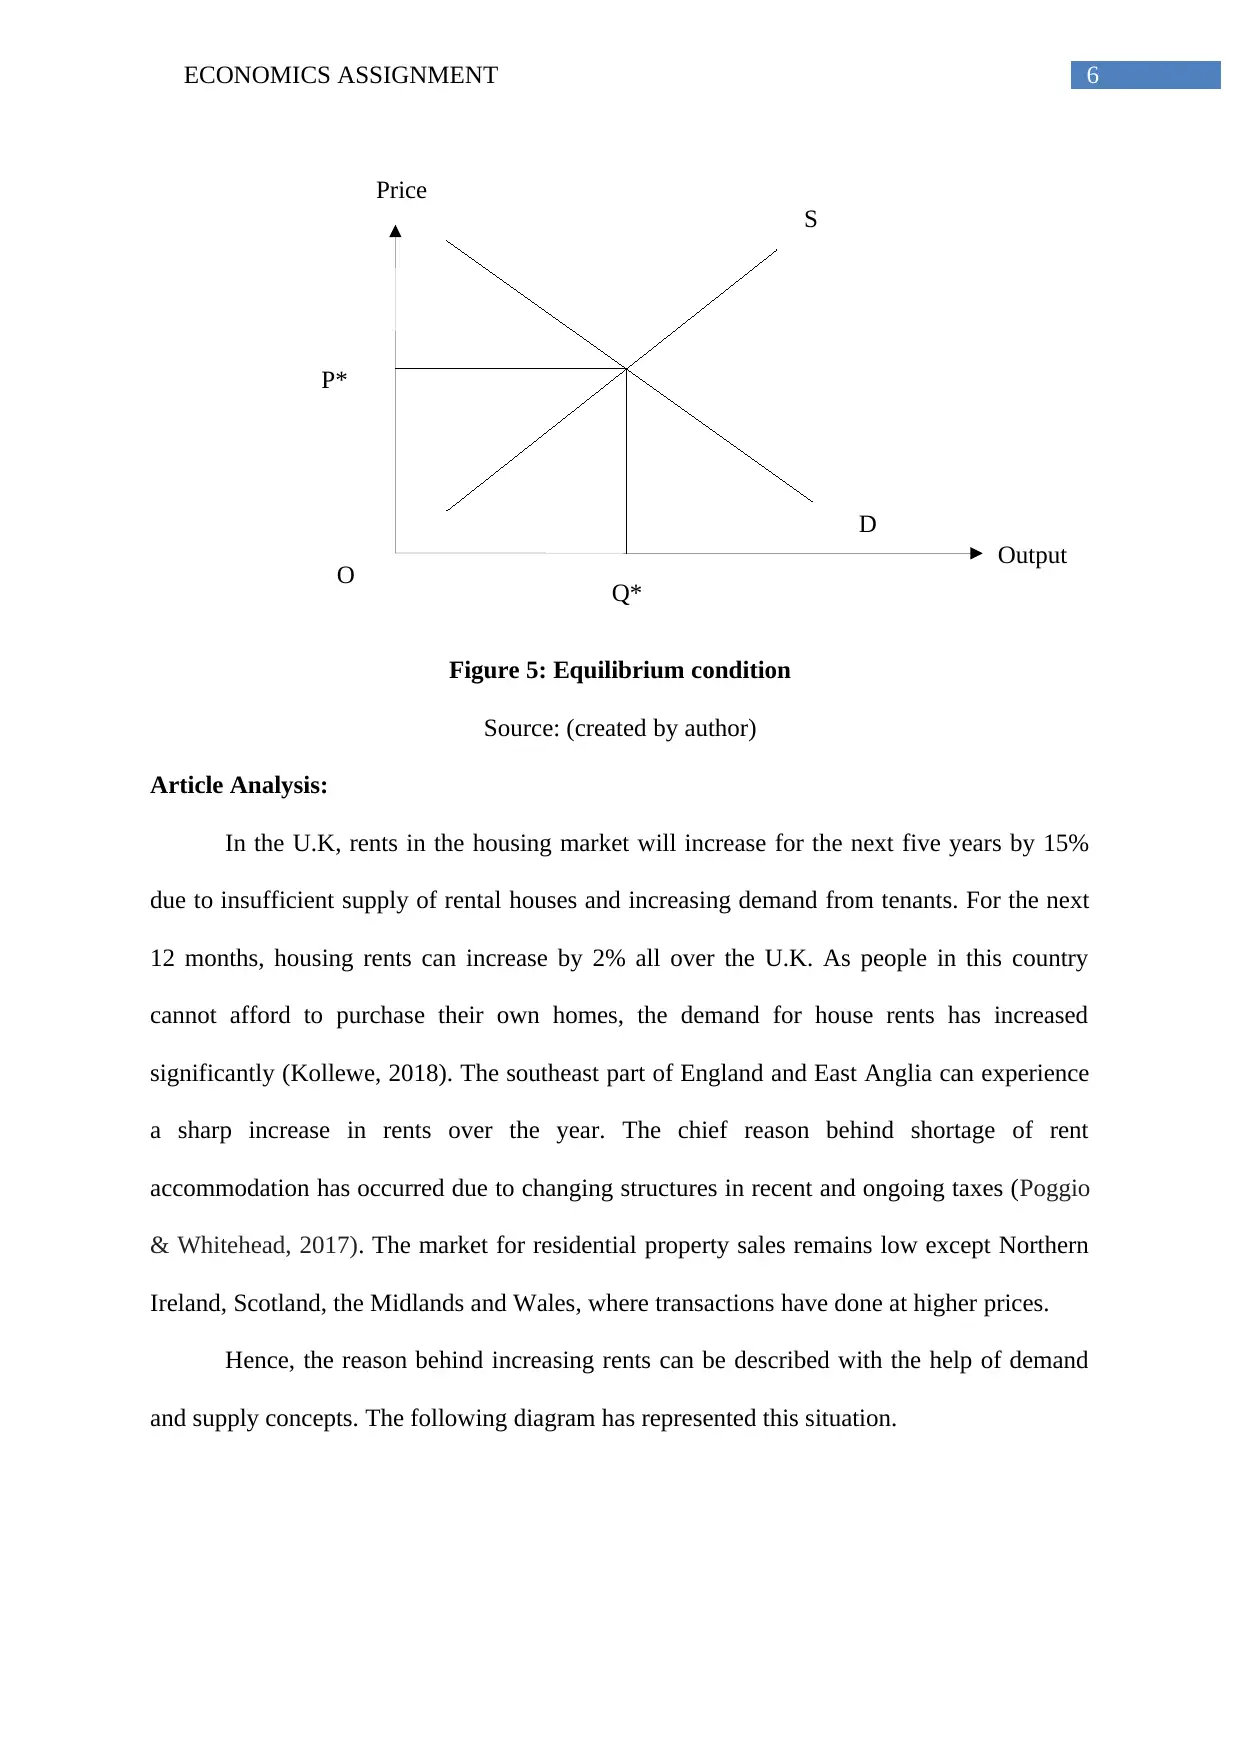
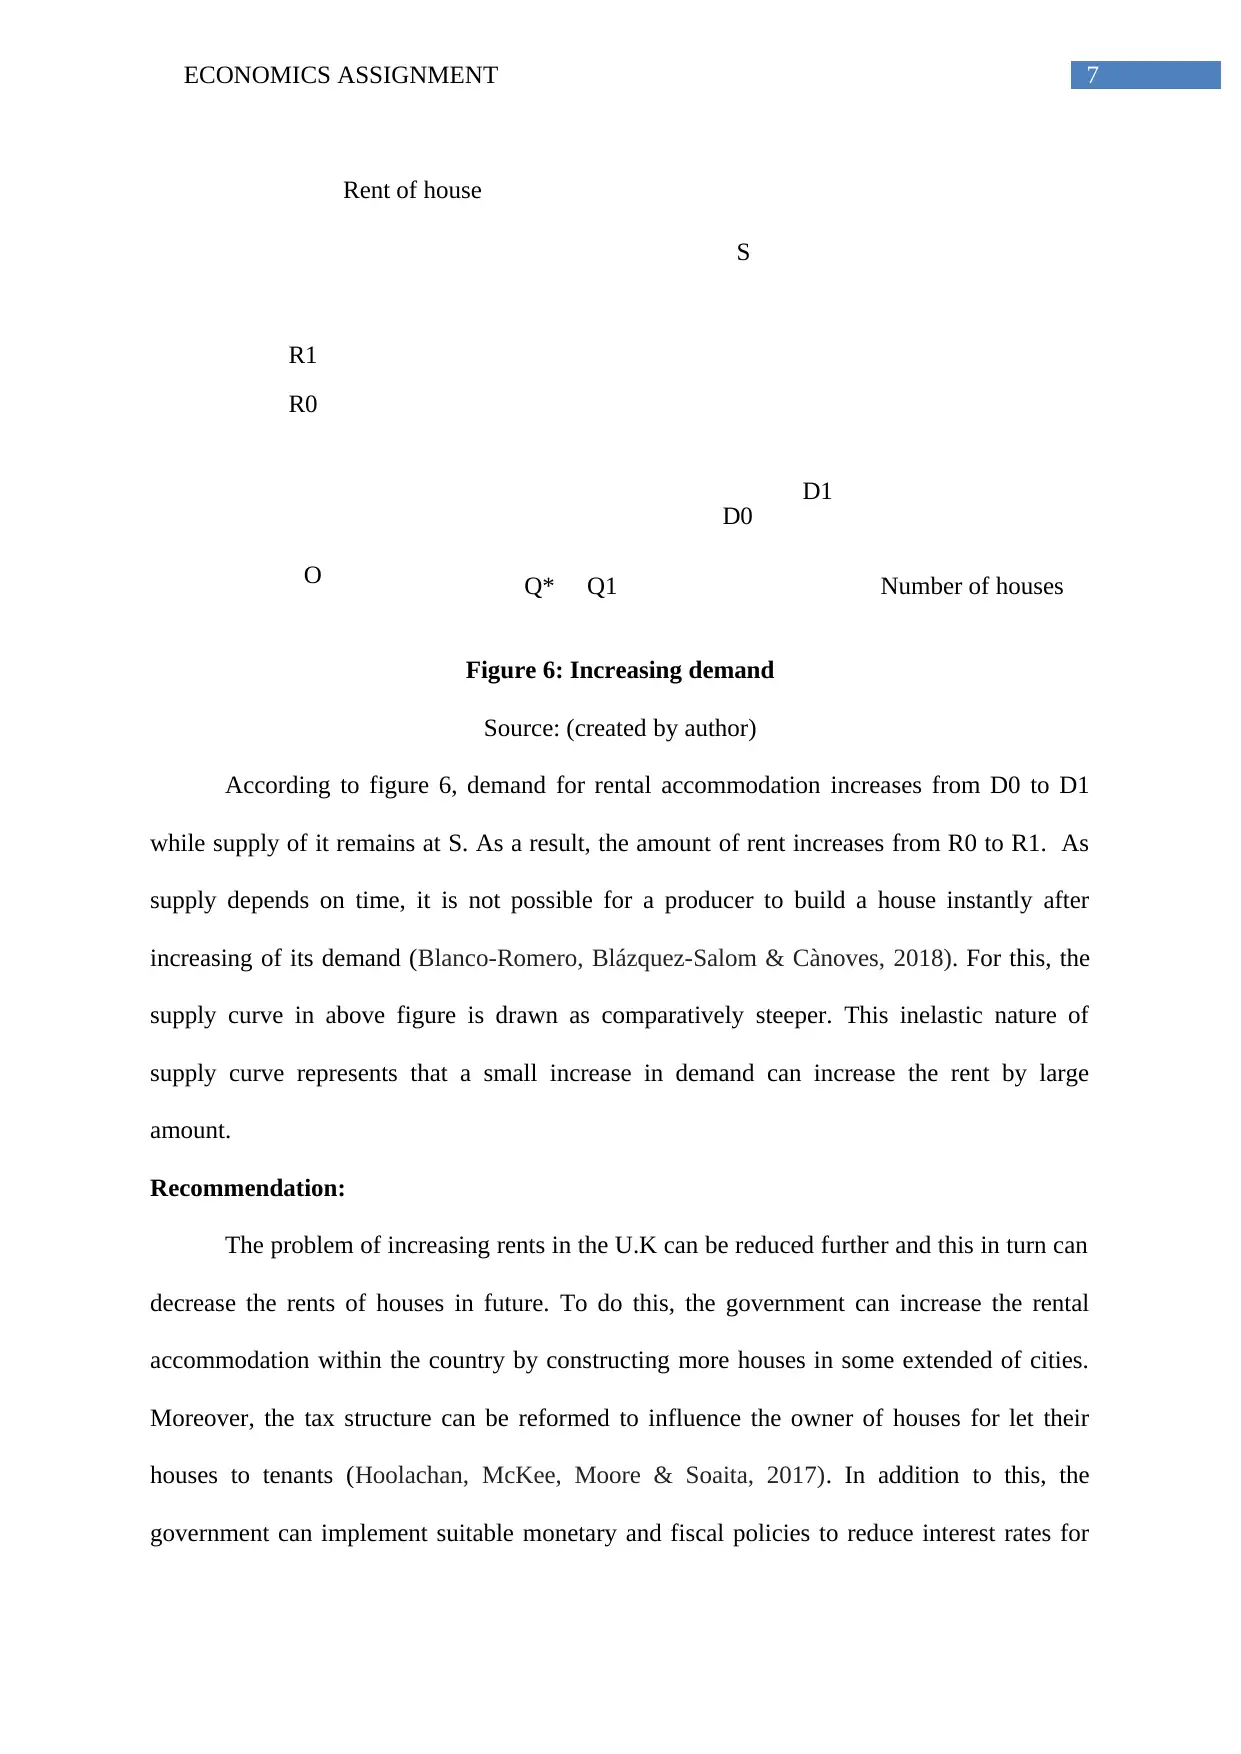
This economics assignment provides an analysis of the UK housing market, specifically addressing the issue of increasing rents. The report begins with an introduction to fundamental microeconomic concepts such as demand and supply, explaining their inverse and positive relationships, respectively, with price and quantity. These concepts are then applied to analyze the UK housing market, examining the factors contributing to the rise in rents, including insufficient supply of rental houses and increased tenant demand. The report includes graphical representations to illustrate these economic principles and the resulting market equilibrium. Furthermore, it analyzes an article discussing the predicted rent increases, offering recommendations to address the problem, such as increasing rental accommodation through new construction and reforming tax structures. The assignment concludes by summarizing the key findings and reinforcing the application of demand and supply principles in understanding the dynamics of the UK housing market.
tabler-icon-diamond-filled.svg

Contribute Materials

Your contribution can guide someone’s learning journey. Share your documents today.
Document Page
Running head: ECONOMICS ASSIGNMENT
Economics Assignment
Name of the university
Name of the student
Author Note
tabler-icon-diamond-filled.svg

Secure Best Marks with AI Grader

Need help grading? Try our AI Grader for instant feedback on your assignments.
Document Page
1ECONOMICS ASSIGNMENT
Table of Contents
Introduction:...............................................................................................................................2
Economic analysis:.....................................................................................................................2
Article Analysis:.........................................................................................................................6
Recommendation:......................................................................................................................7
Conclusion:................................................................................................................................8
References:.................................................................................................................................9
Document Page
2ECONOMICS ASSIGNMENT
Introduction:
Demand and supply are two chief concepts of microeconomics that are used to
determine the equilibrium market price and the corresponding amount of output for a product.
The concept of demand is supported by consumer’s income, which represents the amount of
output that the person desires to buy. On the other side, supply means the amount of output
that a market offers to customers. In a free market, these two concepts set the price of a
product automatically (Boland, 2014). Hence applying these economic tools, the report
intends to describe the reason for increasing rents in the United Kingdom for coming five
years. After discussing the demand and supply concepts briefly, this report tries to analyse the
housing market based on these.
Economic analysis:
The demand law represents an inverse relationship between price and quantity
demanded, where demand for a product can decrease after increasing of its own price. The
opposite situation also happens when price of the product decreases (Amir, Erickson & Jin,
2017). However, in this situation, other demand influencing factors like income along with
taste and preference of consumers and prices of related commodities remain stable.
Figure 1: Inverse relationship between price and demand
Source: (created by author)
Document Page
3ECONOMICS ASSIGNMENT
The above figure has represented the inverse relationship between price and quantity
demanded for a product, where price increases by P0P1 unit and consequently demand for
this product decreases by Q0Q1 unit. As other factors are considered as constant, the price
moves along the demand curve and consequently change in quantity demanded happen.
However, the entire demand curve can shift towards left or right if other demand influencing
factors change (Varian, 2014). For instance, an increase in income of consumer can lead the
demand for a product to increase further at given price level. In this situation, change in
demand occurs.
Figure 2: Change in demand
Source: (created by author)
The above figure signifies a change in demand through shifting the demand curve
either rightward or leftward direction. In the above figure, initial demand curve is represented
by D0. If demand for the product declines at P0 price level due to change in any demand
influencing factor, then the entire demand curve shifts towards left from D0 to D1.
The concept of supply represents a positive relationship between price and amount of
output. Producers intend to increase the supply of a product along with its price increase for
tabler-icon-diamond-filled.svg

Secure Best Marks with AI Grader

Need help grading? Try our AI Grader for instant feedback on your assignments.
Document Page
4ECONOMICS ASSIGNMENT
earning more amount of revenue. In this context, it can be mentioned that supply is a factor of
time, as producers cannot increase the supply of a product immediately after the increasing
the demand for this product in market (Azevedo & Leshno, 2016). Some other factors that
can influence the supply of a product are production cost, natural condition, transport cost
and technology. In addition to this, other factors like prices of inputs, government’s policies
and price of related goods can also influence the supply of a product, where entire supply can
decrease or increase at a given price. The following figure represents a positive relationship
price and quantity supplied of a product.
Figure 3: Positive relationship between price and demand
Source: (created by author)
In the above figure, a supplier wants to supply Q0 amount of product at I0 price. If the
price increases from I0 to I1, the supplier increases its quantity supplied by Q0 Q1 amount. In
this situation, price moves along the supply curve, where other supply influencing factors are
considered as constant (Stoneman, Bartoloni & Baussola, 2018). However, the entire supply
curve can shift towards left or right if these supply increasing factors change accordingly.
Document Page
5ECONOMICS ASSIGNMENT
Figure 4: Change in supply
Source: (created by author)
According to figure 4, the initial supply curve is S0. Changing of one factor can lead
the producer to increase the production accordingly and this further can shift the entire curve
to the right. In above figure, the curve shifts from S0 to S2 and this in turn increases the
amount of output supplied from Q0 to Q1 at P0 price level. For the opposite situation, the
entire curve can shift towards to the left and this in turn can reduce the amount of quantity
supplied from Q0 to Q1.
The equilibrium regarding price and output in product market can occur when demand
and supply curve intersect with each other, representing that the amount of quantity
demanded for a product equates with the amount of quantity supplied in market (Kirschen &
Strbac, 2018). According to the following figure, the amount of equilibrium price and output
for the product is P* and Q*, respectively.
Document Page
6ECONOMICS ASSIGNMENT
Price
Output
O
D
S
P*
Q*
Figure 5: Equilibrium condition
Source: (created by author)
Article Analysis:
In the U.K, rents in the housing market will increase for the next five years by 15%
due to insufficient supply of rental houses and increasing demand from tenants. For the next
12 months, housing rents can increase by 2% all over the U.K. As people in this country
cannot afford to purchase their own homes, the demand for house rents has increased
significantly (Kollewe, 2018). The southeast part of England and East Anglia can experience
a sharp increase in rents over the year. The chief reason behind shortage of rent
accommodation has occurred due to changing structures in recent and ongoing taxes (Poggio
& Whitehead, 2017). The market for residential property sales remains low except Northern
Ireland, Scotland, the Midlands and Wales, where transactions have done at higher prices.
Hence, the reason behind increasing rents can be described with the help of demand
and supply concepts. The following diagram has represented this situation.
tabler-icon-diamond-filled.svg

Paraphrase This Document

Need a fresh take? Get an instant paraphrase of this document with our AI Paraphraser
Document Page
7ECONOMICS ASSIGNMENT
Rent of house
Number of housesO
D0
S
R0
Q*
D1
Q1
R1
Figure 6: Increasing demand
Source: (created by author)
According to figure 6, demand for rental accommodation increases from D0 to D1
while supply of it remains at S. As a result, the amount of rent increases from R0 to R1. As
supply depends on time, it is not possible for a producer to build a house instantly after
increasing of its demand (Blanco-Romero, Blázquez-Salom & Cànoves, 2018). For this, the
supply curve in above figure is drawn as comparatively steeper. This inelastic nature of
supply curve represents that a small increase in demand can increase the rent by large
amount.
Recommendation:
The problem of increasing rents in the U.K can be reduced further and this in turn can
decrease the rents of houses in future. To do this, the government can increase the rental
accommodation within the country by constructing more houses in some extended of cities.
Moreover, the tax structure can be reformed to influence the owner of houses for let their
houses to tenants (Hoolachan, McKee, Moore & Soaita, 2017). In addition to this, the
government can implement suitable monetary and fiscal policies to reduce interest rates for
Document Page
8ECONOMICS ASSIGNMENT
purchasing a house so that people can afford new houses. As, rents are increasing in some
well-known cities of the U.K, the government can provide subsidies to influence people for
taking rent in some other cities, which are situated nearby but do not have so much economic
importance.
Conclusion:
Thus, the entire report has discussed about two chief microeconomic tools, which are,
demand and supply and their impacts on economy. For this, the problem of increasing rents
in the U.K has been considered, where shortage of rental accommodation and increasing
demand from tenants has led the rents to increase further. The chief reason behind this
shortage of housing supply is reformation of tax structure. On the contrary, demand for rent
has increased because people cannot purchase new houses.
Document Page
9ECONOMICS ASSIGNMENT
References:
Amir, R., Erickson, P., & Jin, J. (2017). On the microeconomic foundations of linear demand
for differentiated products. Journal of Economic Theory, 169, 641-665.
Azevedo, E. M., & Leshno, J. D. (2016). A supply and demand framework for two-sided
matching markets. Journal of Political Economy, 124(5), 1235-1268.
Blanco-Romero, A., Blázquez-Salom, M., & Cànoves, G. (2018). Barcelona, Housing Rent
Bubble in a Tourist City. Social Responses and Local Policies. Sustainability, 10(6),
1-18.
Boland, L. A. (2014). Methodology for a New Microeconomics (Routledge Revivals): The
Critical Foundations. Routledge.
Hoolachan, J., McKee, K., Moore, T., & Soaita, A. M. (2017). ‘Generation rent’and the
ability to ‘settle down’: economic and geographical variation in young people’s
housing transitions. Journal of Youth Studies, 20(1), 63-78.
Kirschen, D. S., & Strbac, G. (2018). Fundamentals of power system economics. John Wiley
& Sons.
Kollewe, J. (2018). Rents in UK will rise for next five years, experts predict. the Guardian.
Retrieved 14 August 2018, from
https://www.theguardian.com/business/2018/aug/09/rents-in-uk-will-rise-for-next-
five-years-experts-predict
Poggio, T., & Whitehead, C. (2017). Social housing in Europe: legacies, new trends and the
crisis. Critical Housing Analysis, 4(1), 1-10.
Stoneman, P., Bartoloni, E., & Baussola, M. (2018). The Microeconomics of Product
Innovation. Oxford University Press.
Varian, H. R. (2014). Intermediate Microeconomics: A Modern Approach: Ninth
International Student Edition. WW Norton & Company.
tabler-icon-diamond-filled.svg

Secure Best Marks with AI Grader

Need help grading? Try our AI Grader for instant feedback on your assignments.
Document Page
10ECONOMICS ASSIGNMENT
chevron_up_icon
1 out of 11
circle_padding
hide_on_mobile
zoom_out_icon
logo.png

Your All-in-One AI-Powered Toolkit for Academic Success.

Available 24*7 on WhatsApp / Email

[object Object]