A Fifteen-Year Analysis of UK Macroeconomic Trends and Indicators
VerifiedAdded on 2020/10/22
|19
|2467
|433
Report
AI Summary
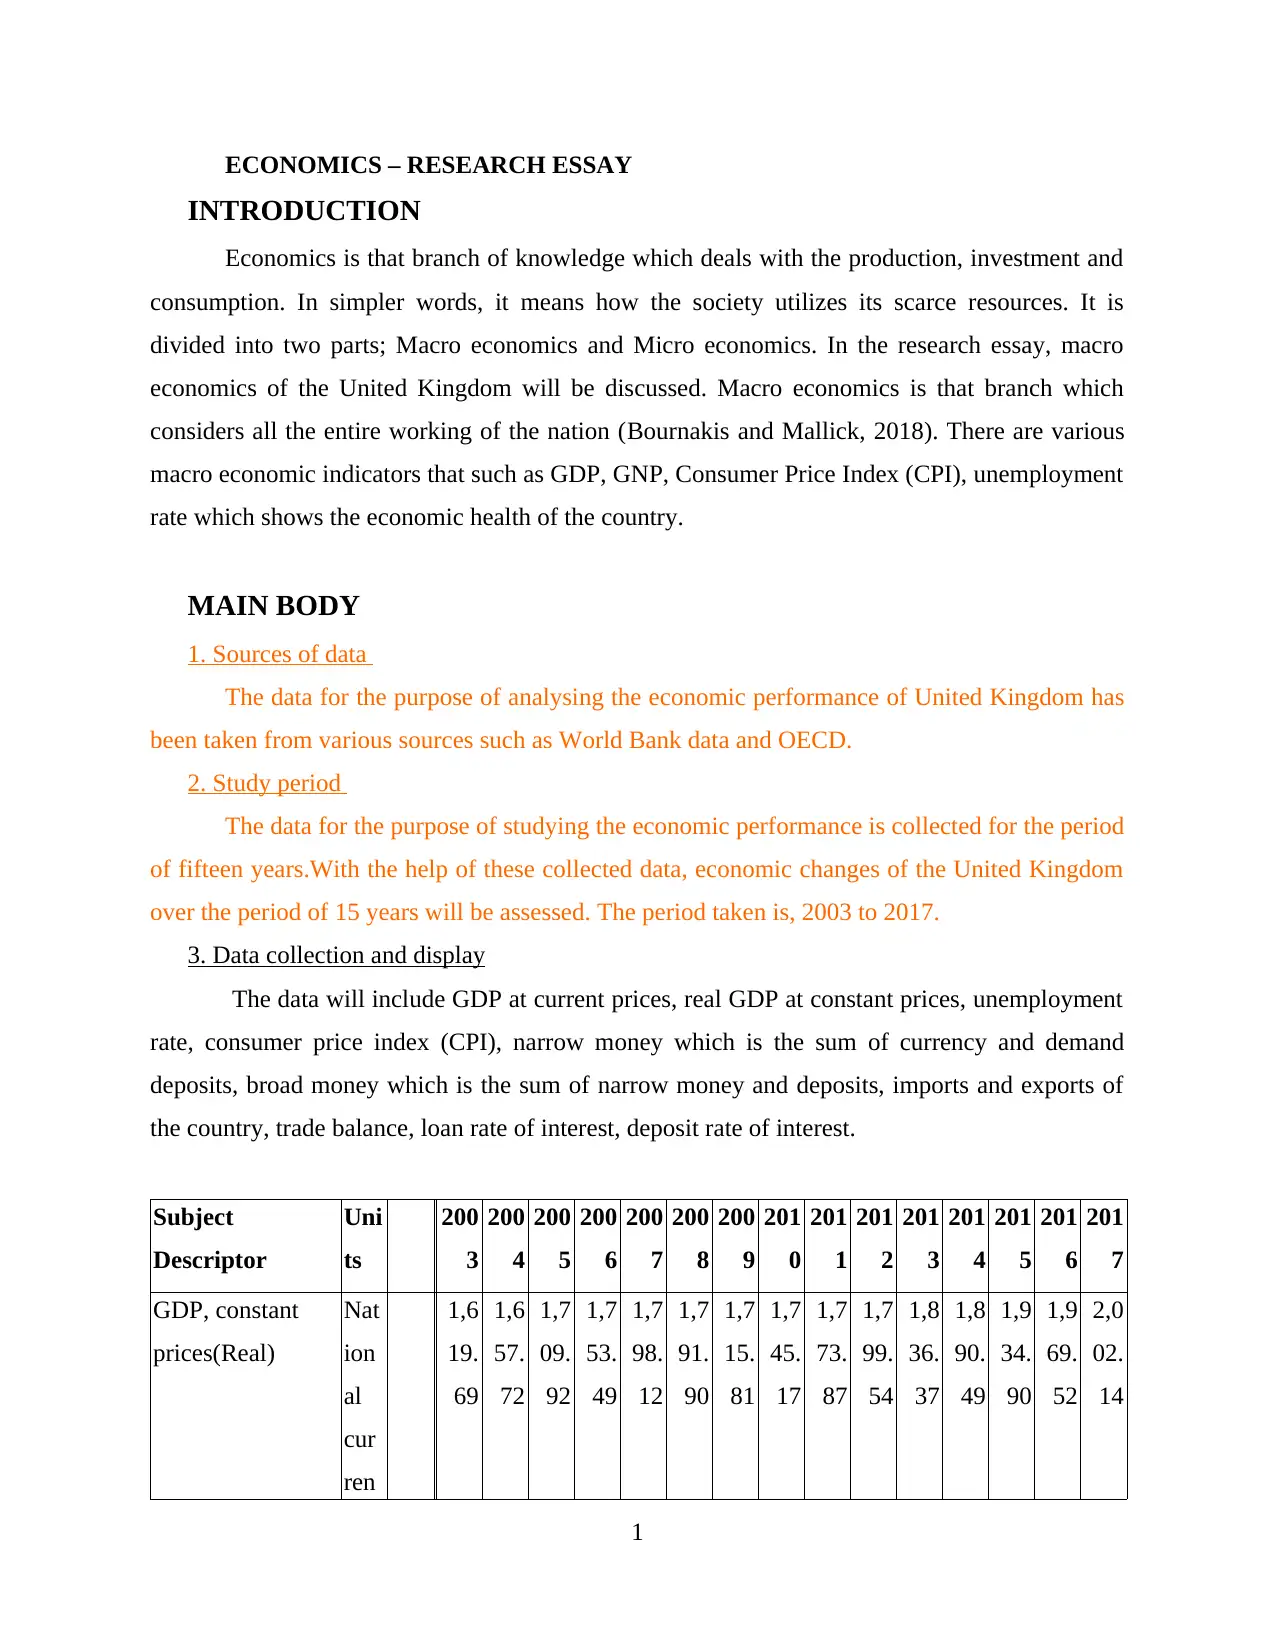
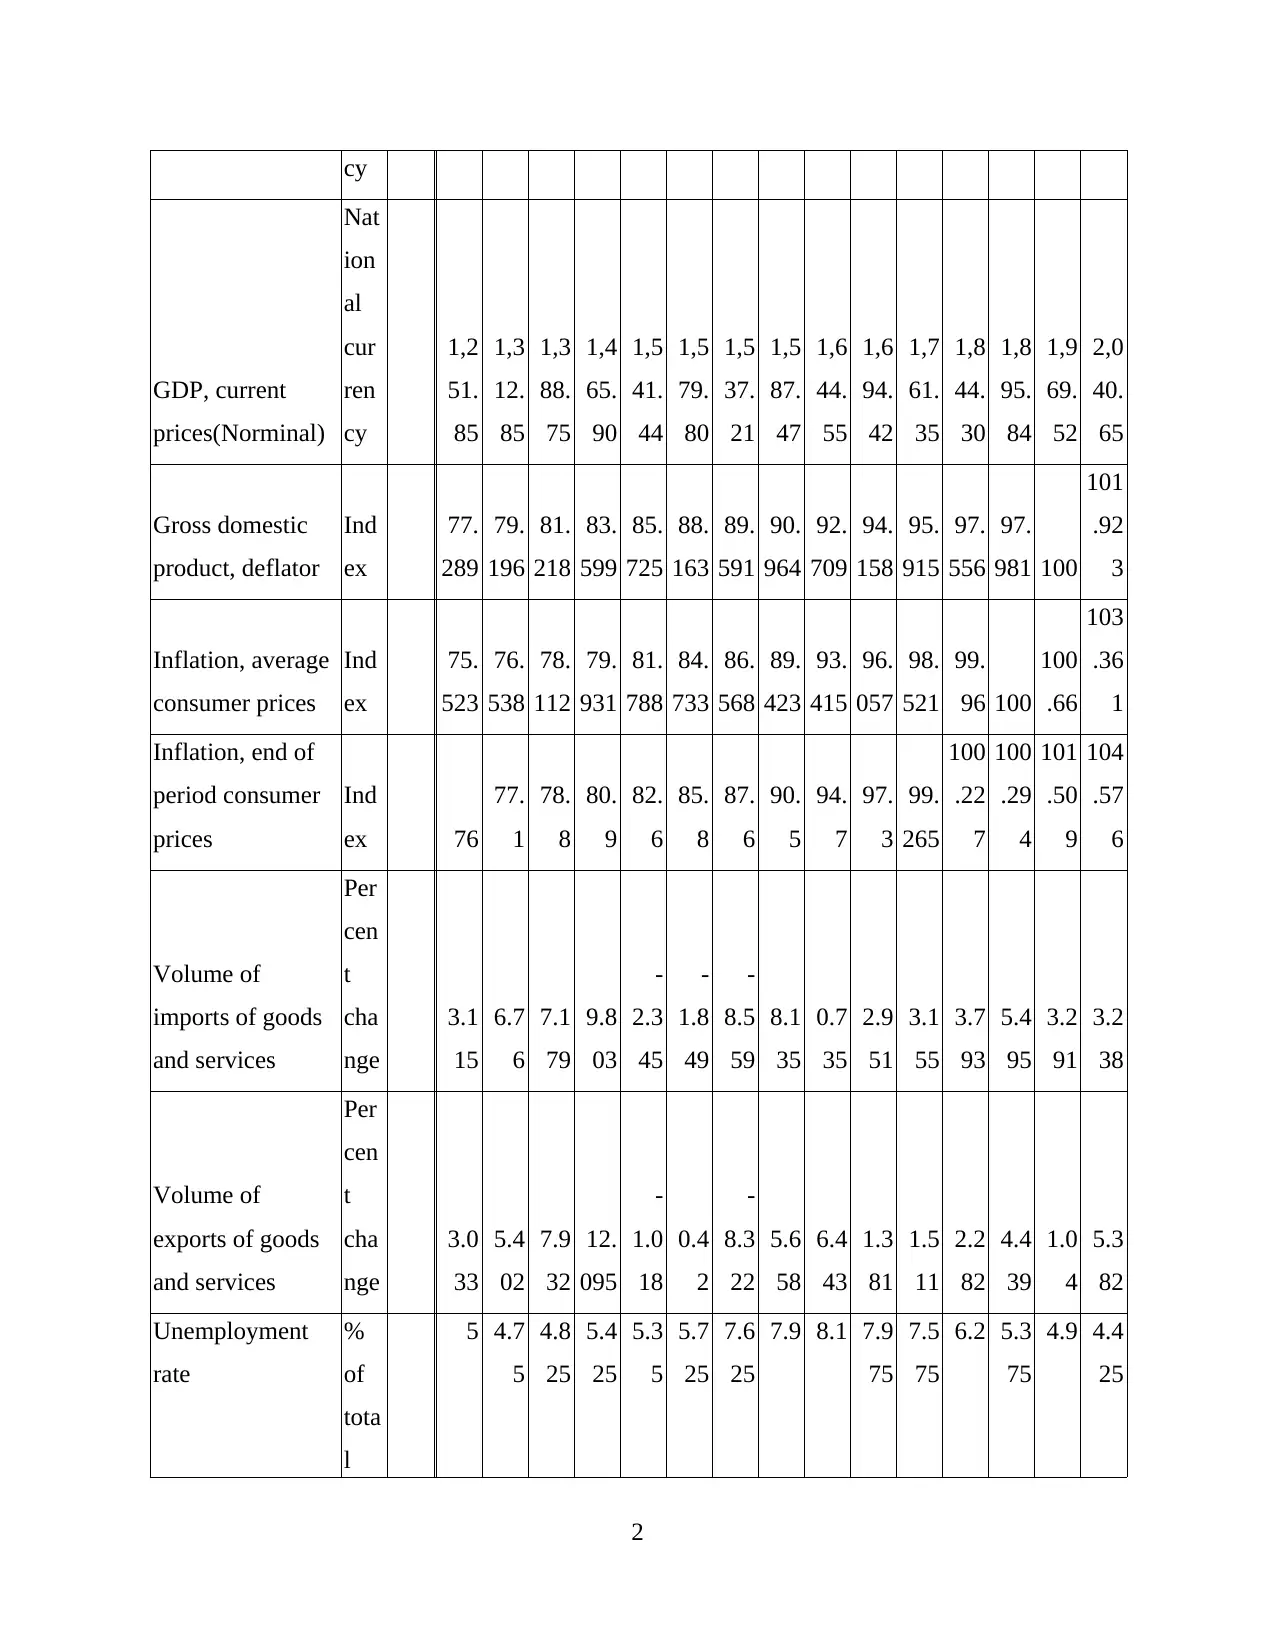
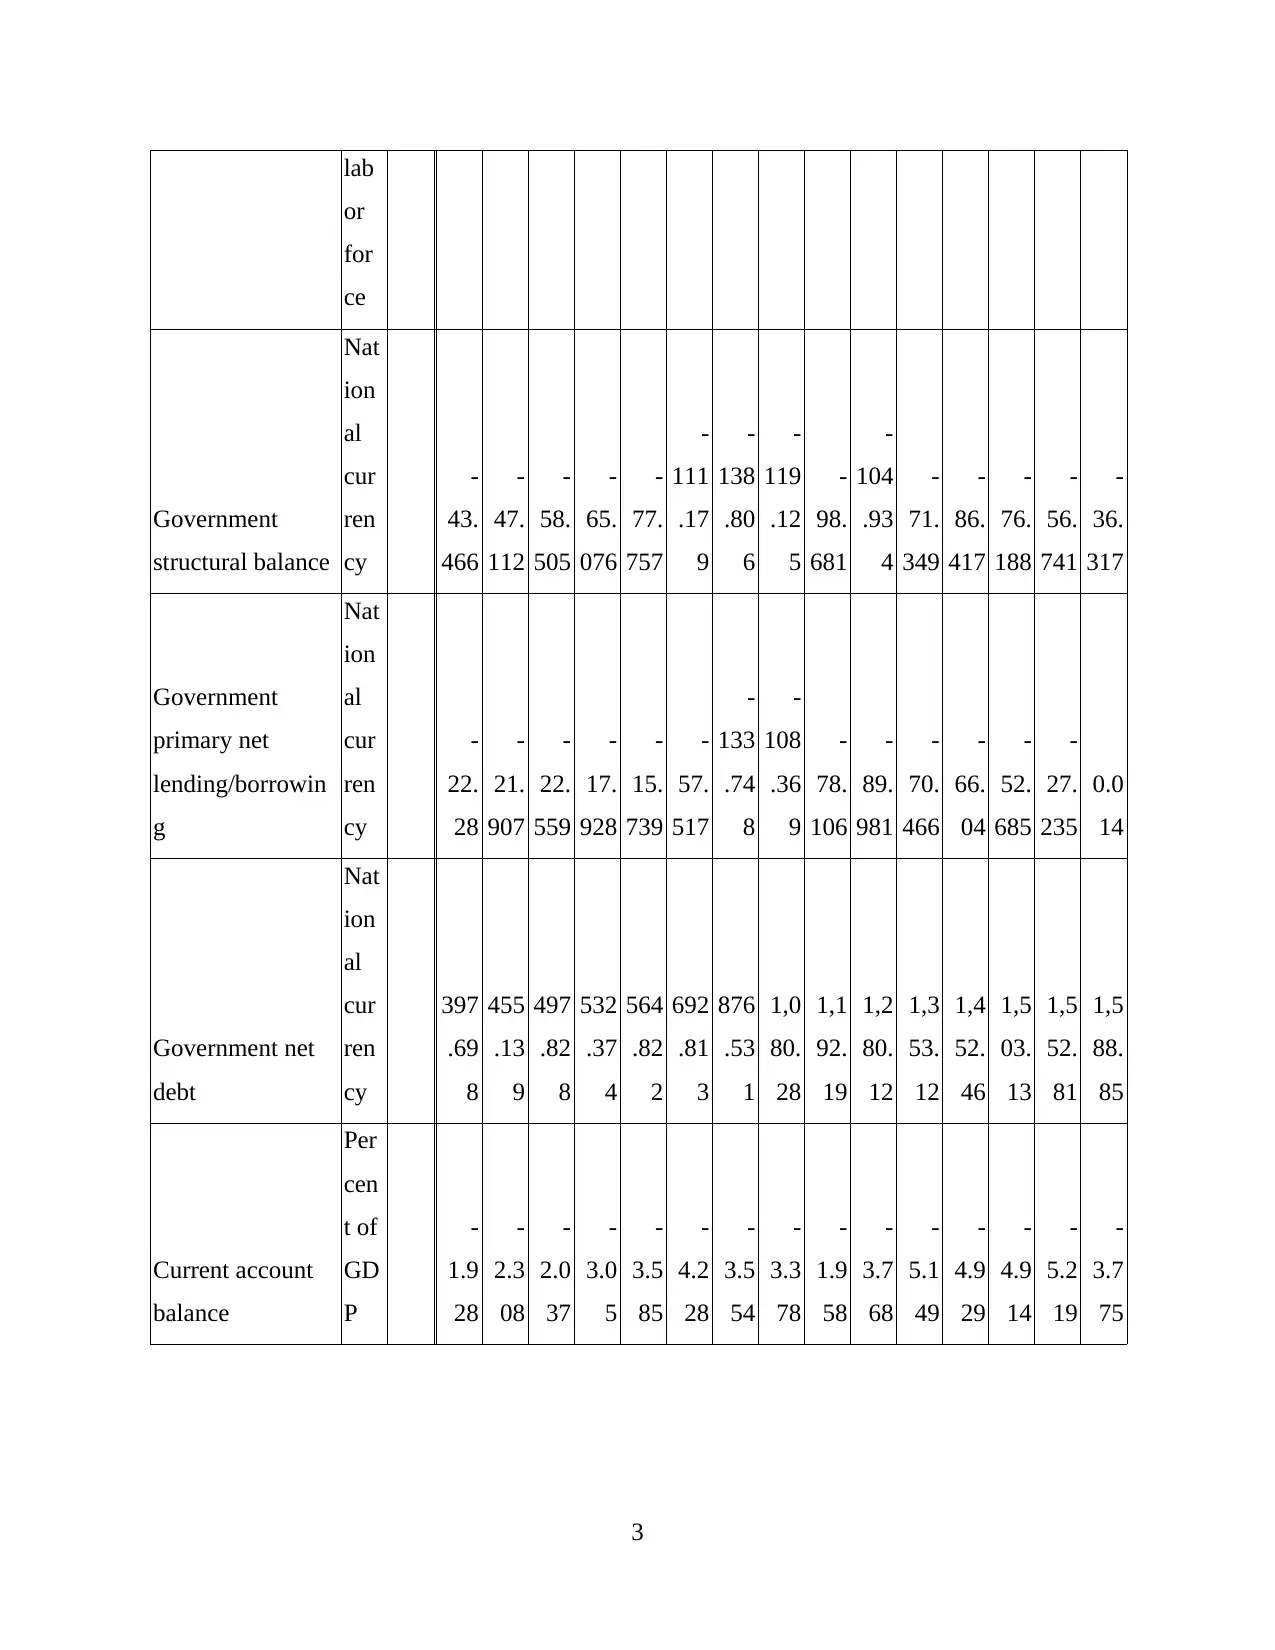
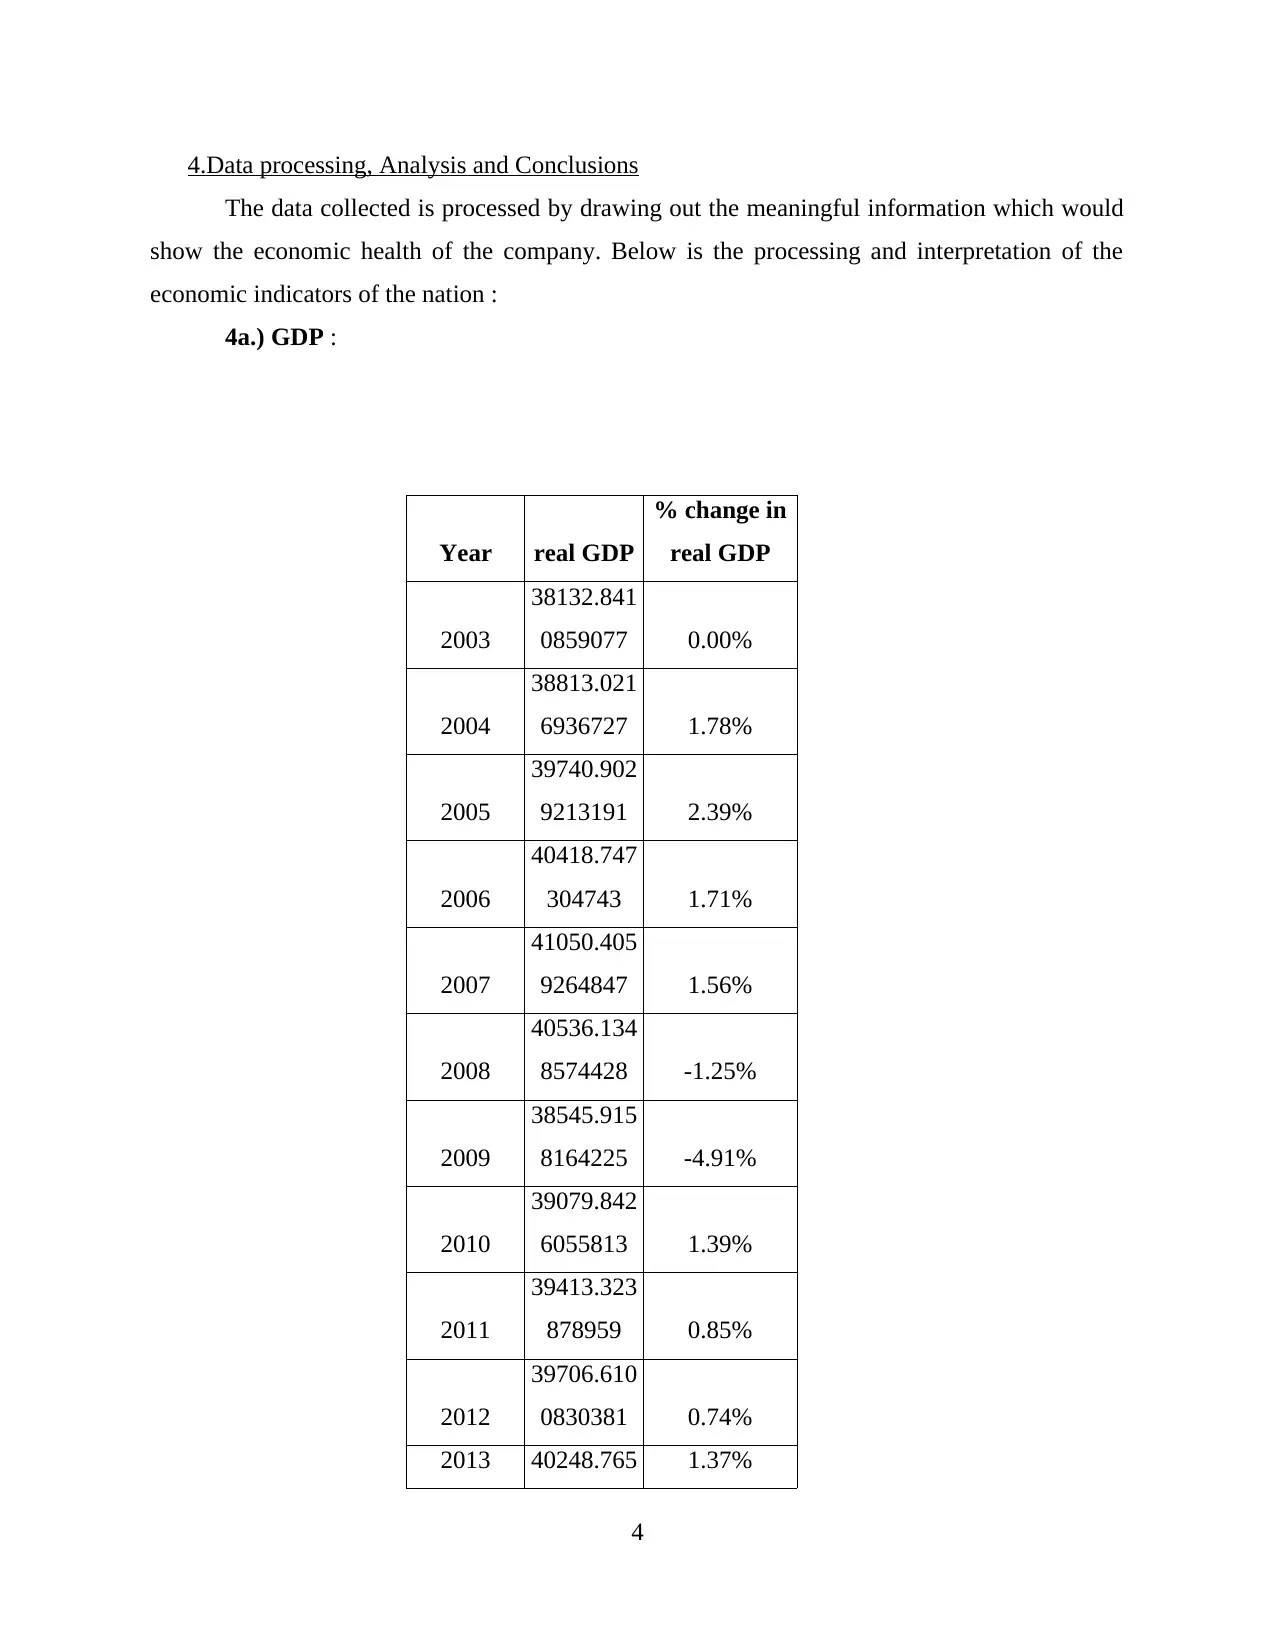
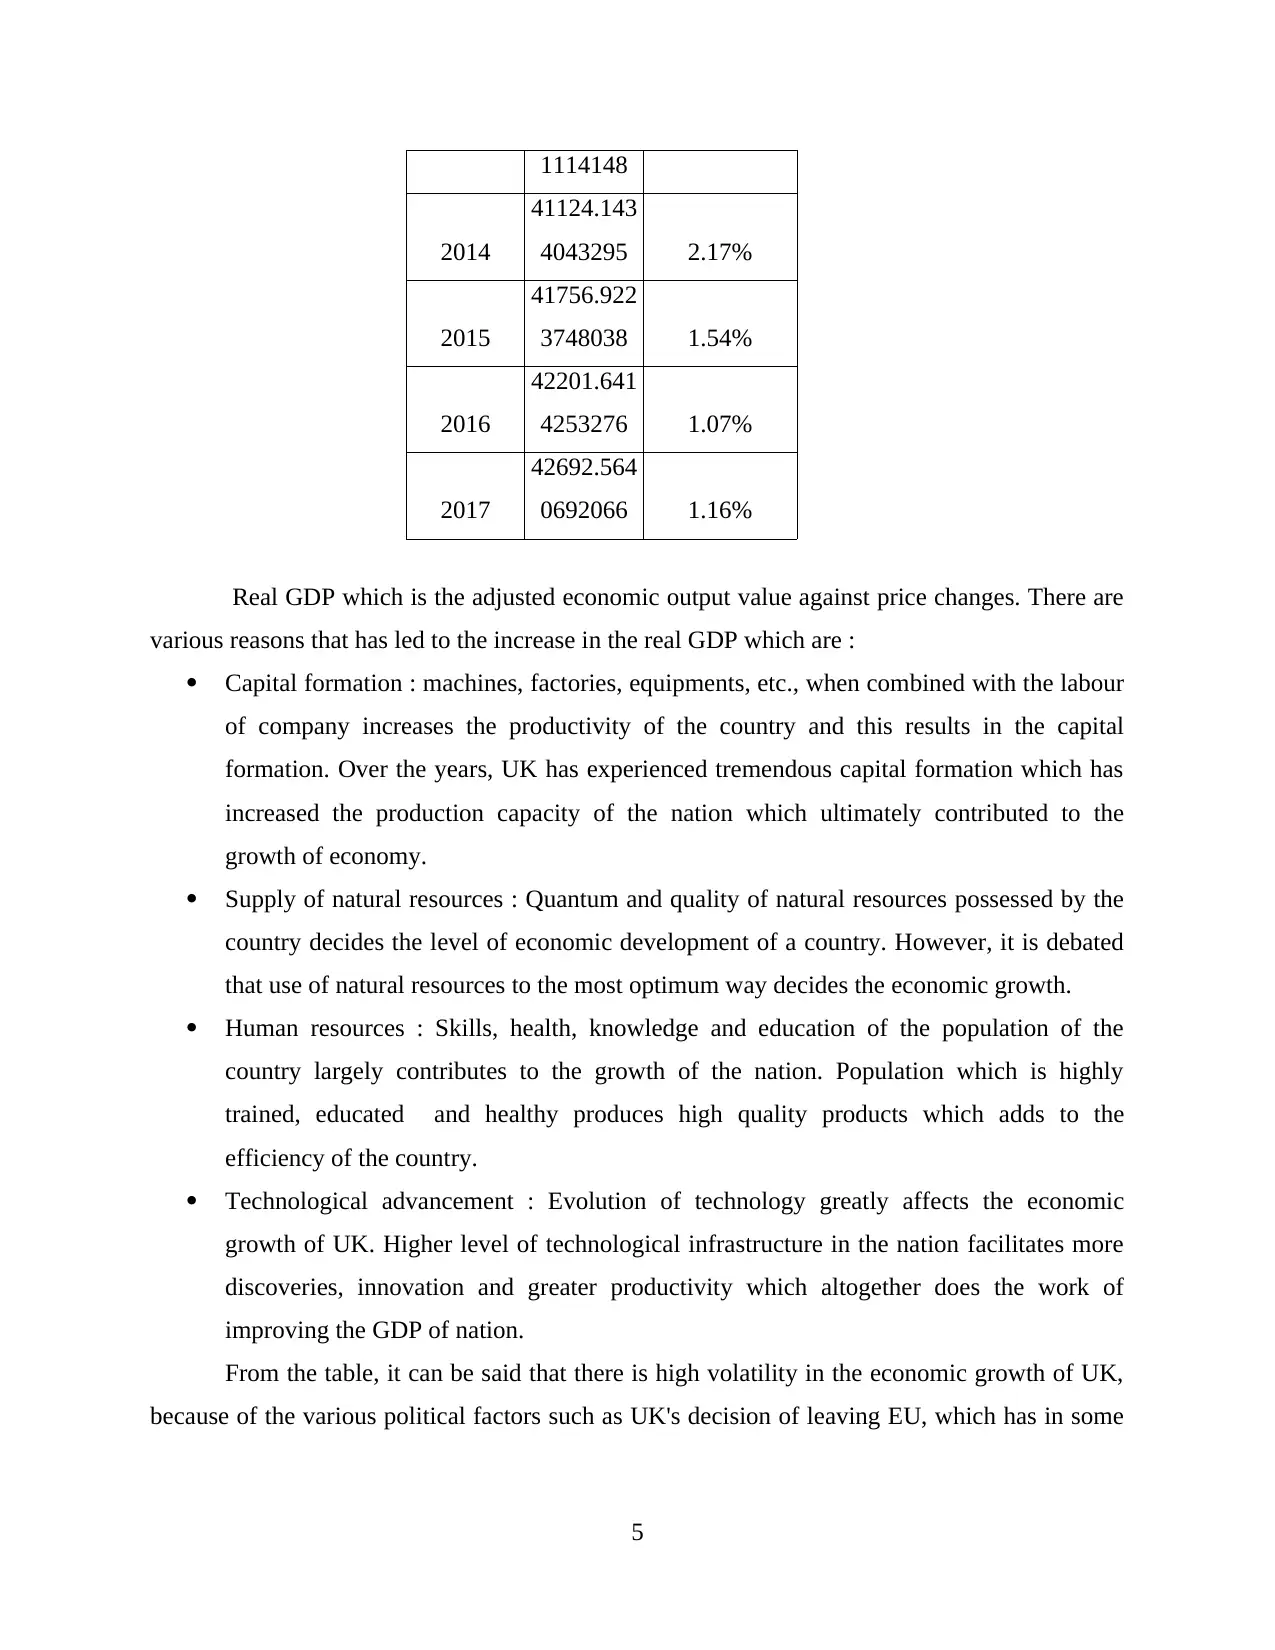
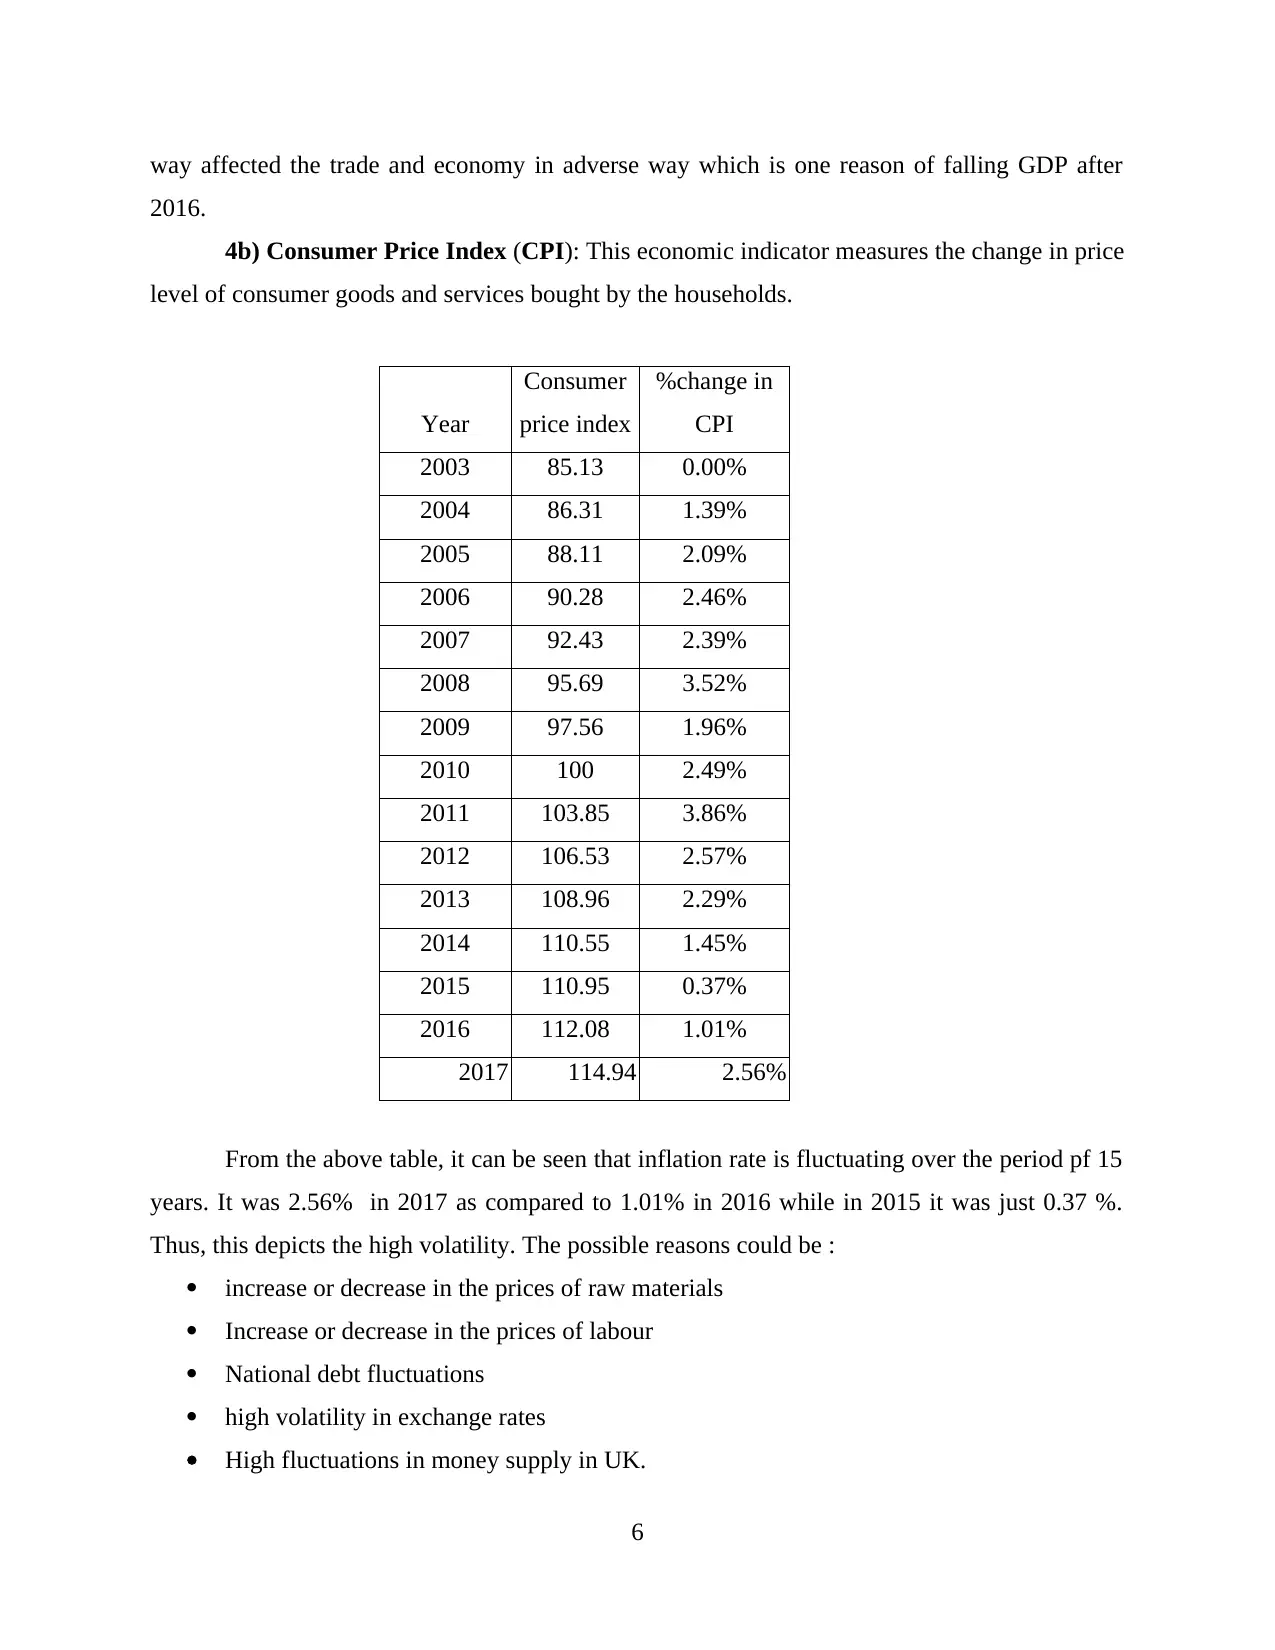
This research essay provides a comprehensive analysis of the macroeconomics of the United Kingdom, focusing on key indicators and trends from 2003 to 2017. The report begins with an introduction to macroeconomics, defining its scope and importance. The main body of the essay then delves into the sources of data, study period, and data collection methods, including GDP, CPI, unemployment rates, and trade balance. The analysis includes detailed tables and interpretations of the data, examining the relationship between various economic factors such as money supply, inflation, and unemployment. The essay also explores factors influencing GDP, such as capital formation, natural resources, human resources, and technological advancements. The study concludes with a commentary on the UK's economic performance, referencing the service sector's significant contribution and the impact of factors like Brexit. Finally, the essay includes a list of references and appendices supporting the analysis. This report offers a valuable insight into the UK's economic landscape during the specified period.
1 out of 19
Related Documents


Your All-in-One AI-Powered Toolkit for Academic Success.
+13062052269
info@desklib.com
Available 24*7 on WhatsApp / Email
![[object Object]](/_next/static/media/star-bottom.7253800d.svg)
Copyright © 2020–2026 A2Z Services. All Rights Reserved. Developed and managed by ZUCOL.