Detailed Analysis of the UK Music Market for Senior Citizens
VerifiedAdded on 2020/06/06
|14
|2666
|251
Report
AI Summary
This report provides a comprehensive analysis of the UK music market, with a specific focus on the senior citizen segment. It examines consumer behavior, listening preferences, and the effectiveness of different marketing strategies. The analysis includes both primary and secondary data, incorporating field observations from locations like Brington Mall and theaters, as well as questionnaire results. The report explores various distribution channels, such as retail and concert performances, and assesses their profitability. It also delves into the concept of nostalgia marketing and its potential for connecting products with older consumers. The findings highlight the importance of tailoring marketing approaches to different age groups and offer recommendations for optimizing sales and market penetration within the UK music industry, especially by targeting senior citizens. The report includes appendices with tables, charts, and graphs to support the analysis.
ANALYSING BUSINESS DATA INFORMATION
Paraphrase This Document
Need a fresh take? Get an instant paraphrase of this document with our AI Paraphraser
TABLE OF CONTENTS
INTRODUCTION...........................................................................................................................1
Analysis of Individual Tasks...........................................................................................................1
2.1 Analysis of Senior Citizen Music Market..............................................................................1
2.2 Analysis of Secondary Data...................................................................................................2
.....................................................................................................................................................2
2.3 Analysis of Primary Data (Field Observations).....................................................................3
(b) Biases and data collection......................................................................................................7
© Ways need to be adopted for data collection...........................................................................7
2.4 Analysis of Primary Data (Questionnaires)...........................................................................8
(a)Median age group....................................................................................................................8
(b) Cross tabulation......................................................................................................................8
(C) Survey of the research...........................................................................................................8
(d) Things need to be done differently.........................................................................................9
.....................................................................................................................................................9
(a)Output for analysis and assumption........................................................................................9
2. Conclusions..................................................................................................................................9
REFERENCES..............................................................................................................................10
APPENDIX....................................................................................................................................11
Appendix 1. Percentage of total CDs sold and same of profit...................................................11
Appendix: 2. Results of observation at Theatre and Mall.........................................................11
Appendix 3. Median ranking.....................................................................................................11
Appendix 4. Cross tabulation.....................................................................................................12
INTRODUCTION
Music industry is the one of the fastest growing domain in the UK as number of people
listening music is increasing rapidly in the nation. It can be observed that entertainment industry
is divided in to several parts and formation of albums as well as singing songs is increasing at
rapid pace in the nation. There are two sort of customers in the market namely old people and
youngsters. Listening behaviour and preferences are totally different in case of these groups and
due to this reason firms have to selectively target customers for their products. There are number
of reasons due to which preferences are different across these age group people. In the current
report detail analysis of the both groups will be done and data collected from the primary and
secondary sources will be analysed deeply. On this basis conclusion will be formed in the
specific direction. Thus, it can be said that there is wide scope of the current research report.
Analysis of Individual Tasks
2.1 Analysis of Senior Citizen Music Market
It is very important for the firms to analyse the market in systematic manner before
launching a product in to the new market. In current time period huge difference is observed in
consumer behaviour of the old and young people. It is very important to identify the degree of
difference that is between these old and young people. It can be observed that both age group
people like to listen different sort of music as it can be said that preference in terms of choice of
music is different for both age group people (Wikström, 2012). It can be observed that old people
often listen music when they go for morning walk or in leisure hours. Old people prefer peaceful
environment and due to this reason they like to hear music that are mild in nature or have soft
music. On other hand, youngsters, have less leisure hours and they prefer to listen rocking music.
Youngsters often prefer fun in their life and due to this reason they like to hear rocking music.
These are some of the basic reasons due to which people prefer to listen different sort of songs.
There is need to prepare marketing strategy in systematic way (Krause, North and Heritage,
2014). Same marketing strategy cannot be followed for young and old people. Hence, in this
regard deeply analysis of facts and figures must be done by using varied tools and on that basis
decisions must be taken by the managers. Nostalgia marketing is one of the marketing concept
and under this advantage of the old memories is taken and product is associated with it. Thus, by
using nostalgia marketing connection is established between product and customers and in this
1
⊘ This is a preview!⊘
Do you want full access?
Subscribe today to unlock all pages.
Trusted by 1+ million students worldwide
demand fo the product is increased in the market. Nostalgia marketing is used at wide level by
the business firms because it become very important to give some motivating factor to the
customers to purchase the product. This can be done only through nostalgia marketing (Ferreira
and Waldfogel, 2013). This is because through nostalgia marketing emotions of an individuals
are taken in to account and by considering same marketing of product is done. It can be said that
nostalgia marketing have due importance for the business firm.
2.2 Analysis of Secondary Data
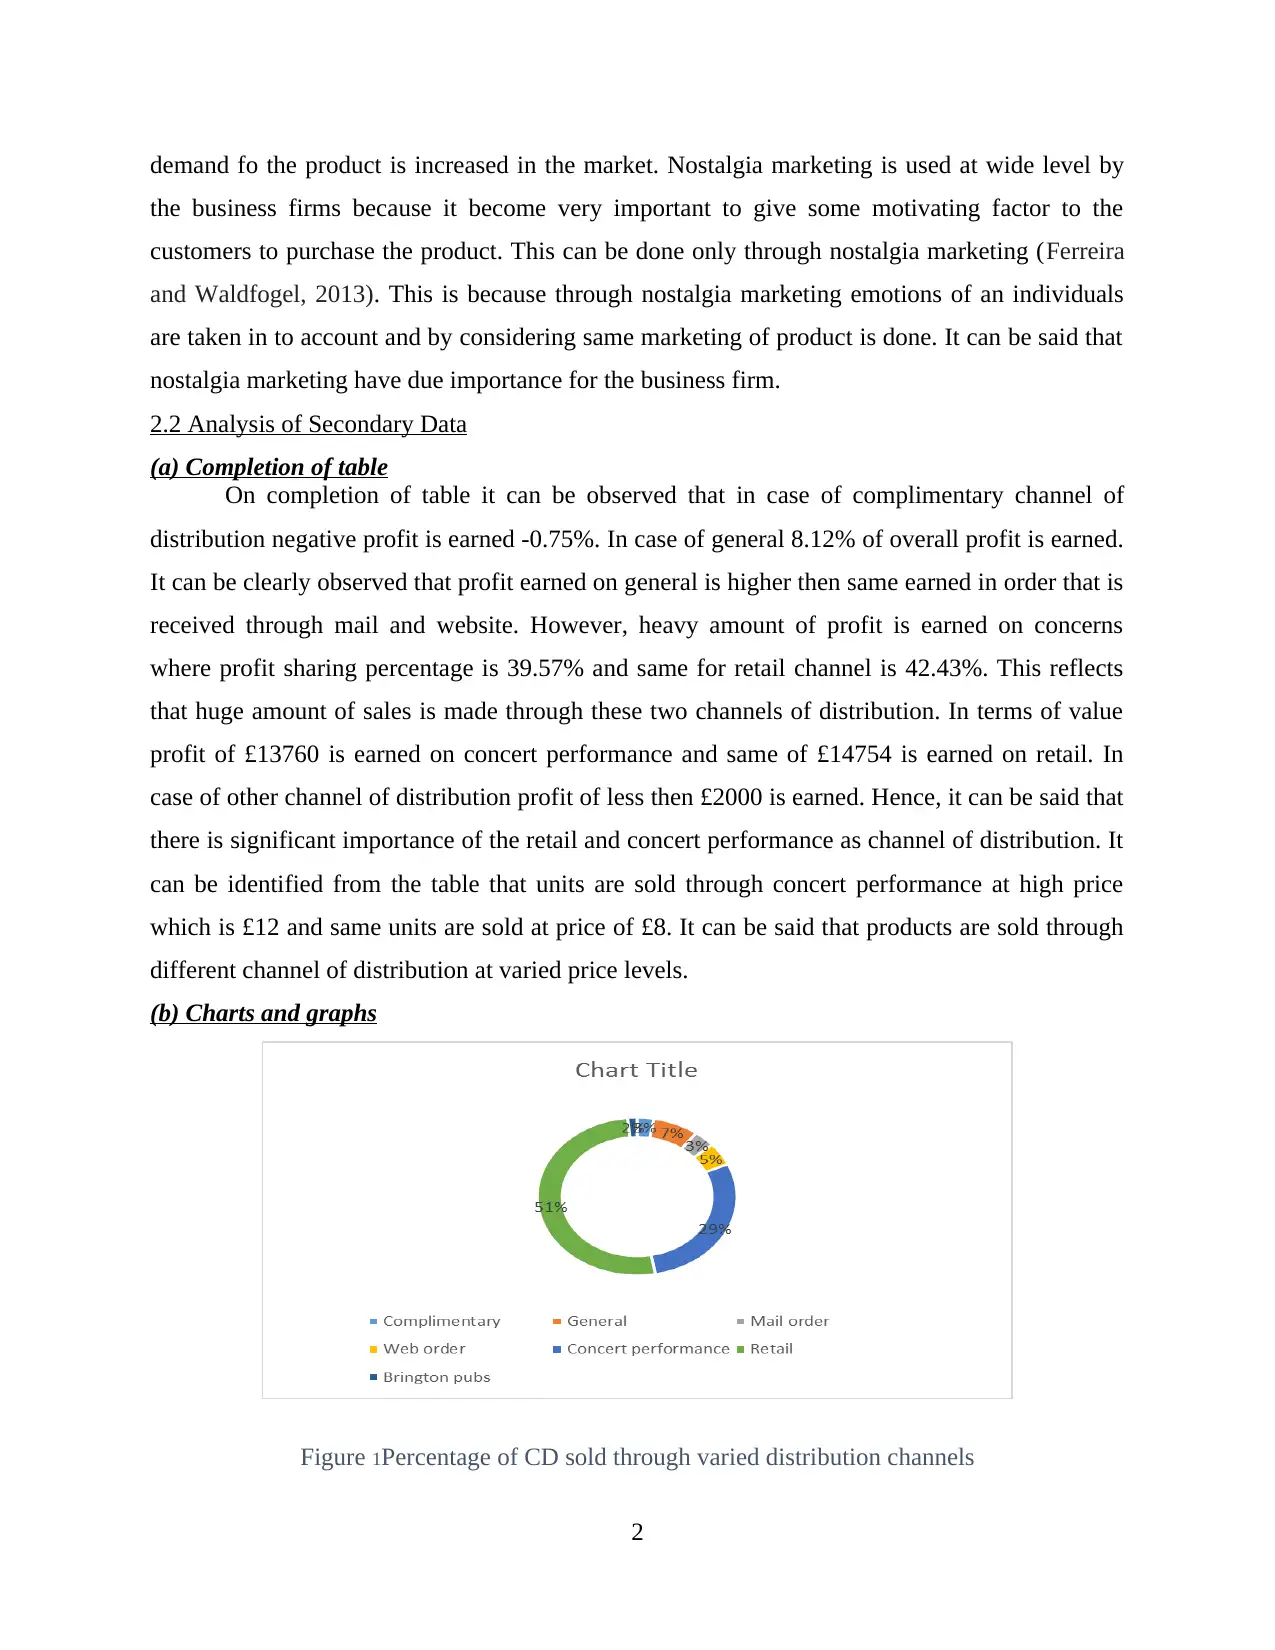
(a) Completion of table
On completion of table it can be observed that in case of complimentary channel of
distribution negative profit is earned -0.75%. In case of general 8.12% of overall profit is earned.
It can be clearly observed that profit earned on general is higher then same earned in order that is
received through mail and website. However, heavy amount of profit is earned on concerns
where profit sharing percentage is 39.57% and same for retail channel is 42.43%. This reflects
that huge amount of sales is made through these two channels of distribution. In terms of value
profit of £13760 is earned on concert performance and same of £14754 is earned on retail. In
case of other channel of distribution profit of less then £2000 is earned. Hence, it can be said that
there is significant importance of the retail and concert performance as channel of distribution. It
can be identified from the table that units are sold through concert performance at high price
which is £12 and same units are sold at price of £8. It can be said that products are sold through
different channel of distribution at varied price levels.
(b) Charts and graphs
Figure 1Percentage of CD sold through varied distribution channels
2
the business firms because it become very important to give some motivating factor to the
customers to purchase the product. This can be done only through nostalgia marketing (Ferreira
and Waldfogel, 2013). This is because through nostalgia marketing emotions of an individuals
are taken in to account and by considering same marketing of product is done. It can be said that
nostalgia marketing have due importance for the business firm.
2.2 Analysis of Secondary Data
(a) Completion of table
On completion of table it can be observed that in case of complimentary channel of
distribution negative profit is earned -0.75%. In case of general 8.12% of overall profit is earned.
It can be clearly observed that profit earned on general is higher then same earned in order that is
received through mail and website. However, heavy amount of profit is earned on concerns
where profit sharing percentage is 39.57% and same for retail channel is 42.43%. This reflects
that huge amount of sales is made through these two channels of distribution. In terms of value
profit of £13760 is earned on concert performance and same of £14754 is earned on retail. In
case of other channel of distribution profit of less then £2000 is earned. Hence, it can be said that
there is significant importance of the retail and concert performance as channel of distribution. It
can be identified from the table that units are sold through concert performance at high price
which is £12 and same units are sold at price of £8. It can be said that products are sold through
different channel of distribution at varied price levels.
(b) Charts and graphs
Figure 1Percentage of CD sold through varied distribution channels
2
Paraphrase This Document
Need a fresh take? Get an instant paraphrase of this document with our AI Paraphraser
Same results are reflected by charts and it can be observed that maximum sales is generated
through concert performance and retail chains. It can be observed that these are the only channels
of distribution through which more then 50% of sales is generated in the business. This reflects
that in case sales declined in these two channels of distribution then it will be matter of concern
for the business firm. It can be said that there are lots of thing on which firm needs to focus in
order to consistently increase sales of product in the business. Firm must formulate a strategy
under which it must try to attract more and more number of customers in retail stores and
concerts. It is the only way through which regularly plunge can be observed in sales in the
business.
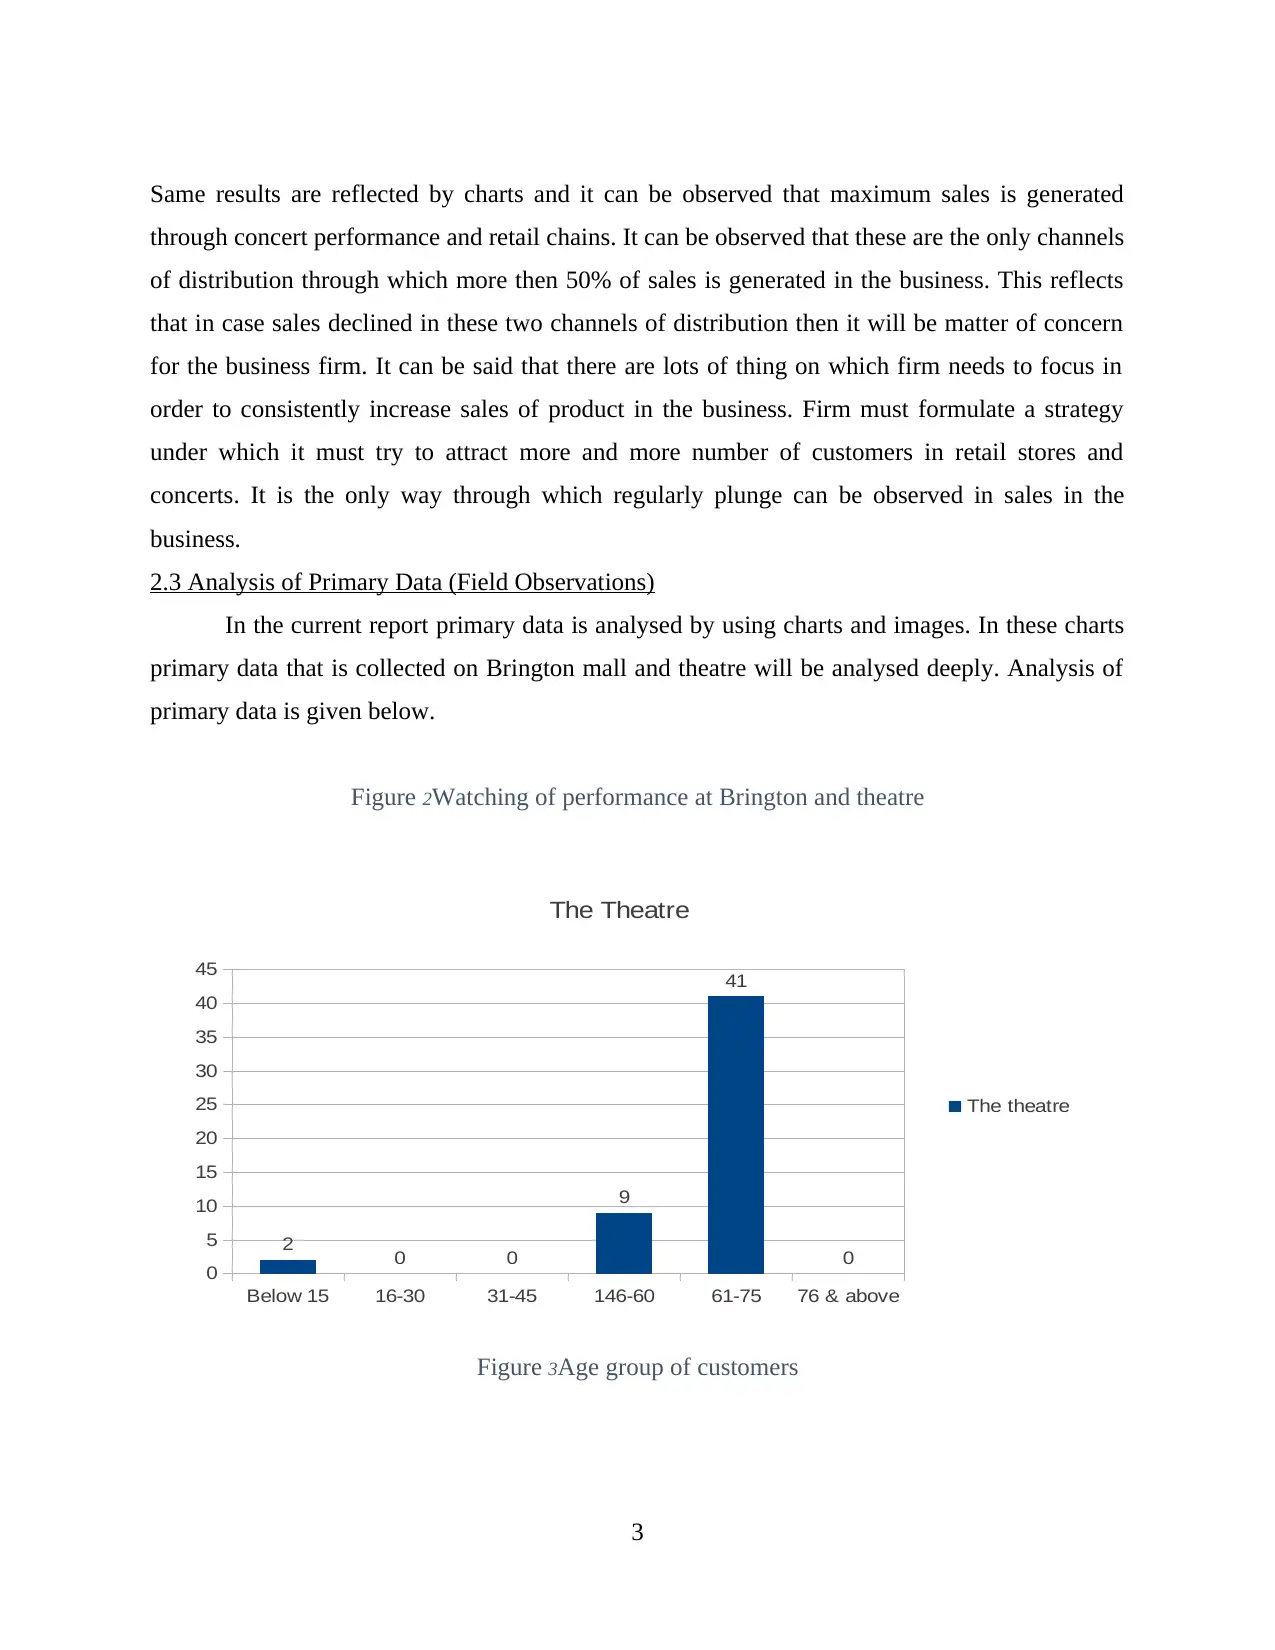
2.3 Analysis of Primary Data (Field Observations)
In the current report primary data is analysed by using charts and images. In these charts
primary data that is collected on Brington mall and theatre will be analysed deeply. Analysis of
primary data is given below.
Figure 2Watching of performance at Brington and theatre
Below 15 16-30 31-45 146-60 61-75 76 & above
0
5
10
15
20
25
30
35
40
45
2 0 0
9
41
0
The Theatre
The theatre
Figure 3Age group of customers
3
through concert performance and retail chains. It can be observed that these are the only channels
of distribution through which more then 50% of sales is generated in the business. This reflects
that in case sales declined in these two channels of distribution then it will be matter of concern
for the business firm. It can be said that there are lots of thing on which firm needs to focus in
order to consistently increase sales of product in the business. Firm must formulate a strategy
under which it must try to attract more and more number of customers in retail stores and
concerts. It is the only way through which regularly plunge can be observed in sales in the
business.
2.3 Analysis of Primary Data (Field Observations)
In the current report primary data is analysed by using charts and images. In these charts
primary data that is collected on Brington mall and theatre will be analysed deeply. Analysis of
primary data is given below.
Figure 2Watching of performance at Brington and theatre
Below 15 16-30 31-45 146-60 61-75 76 & above
0
5
10
15
20
25
30
35
40
45
2 0 0
9
41
0
The Theatre
The theatre
Figure 3Age group of customers
3
1 minute 2 minute 3 minute 4 or more
0
5
10
15
20
25
30
35
40
45
14
41
25 24
11
19
9
13
Brighton mall
The theatre
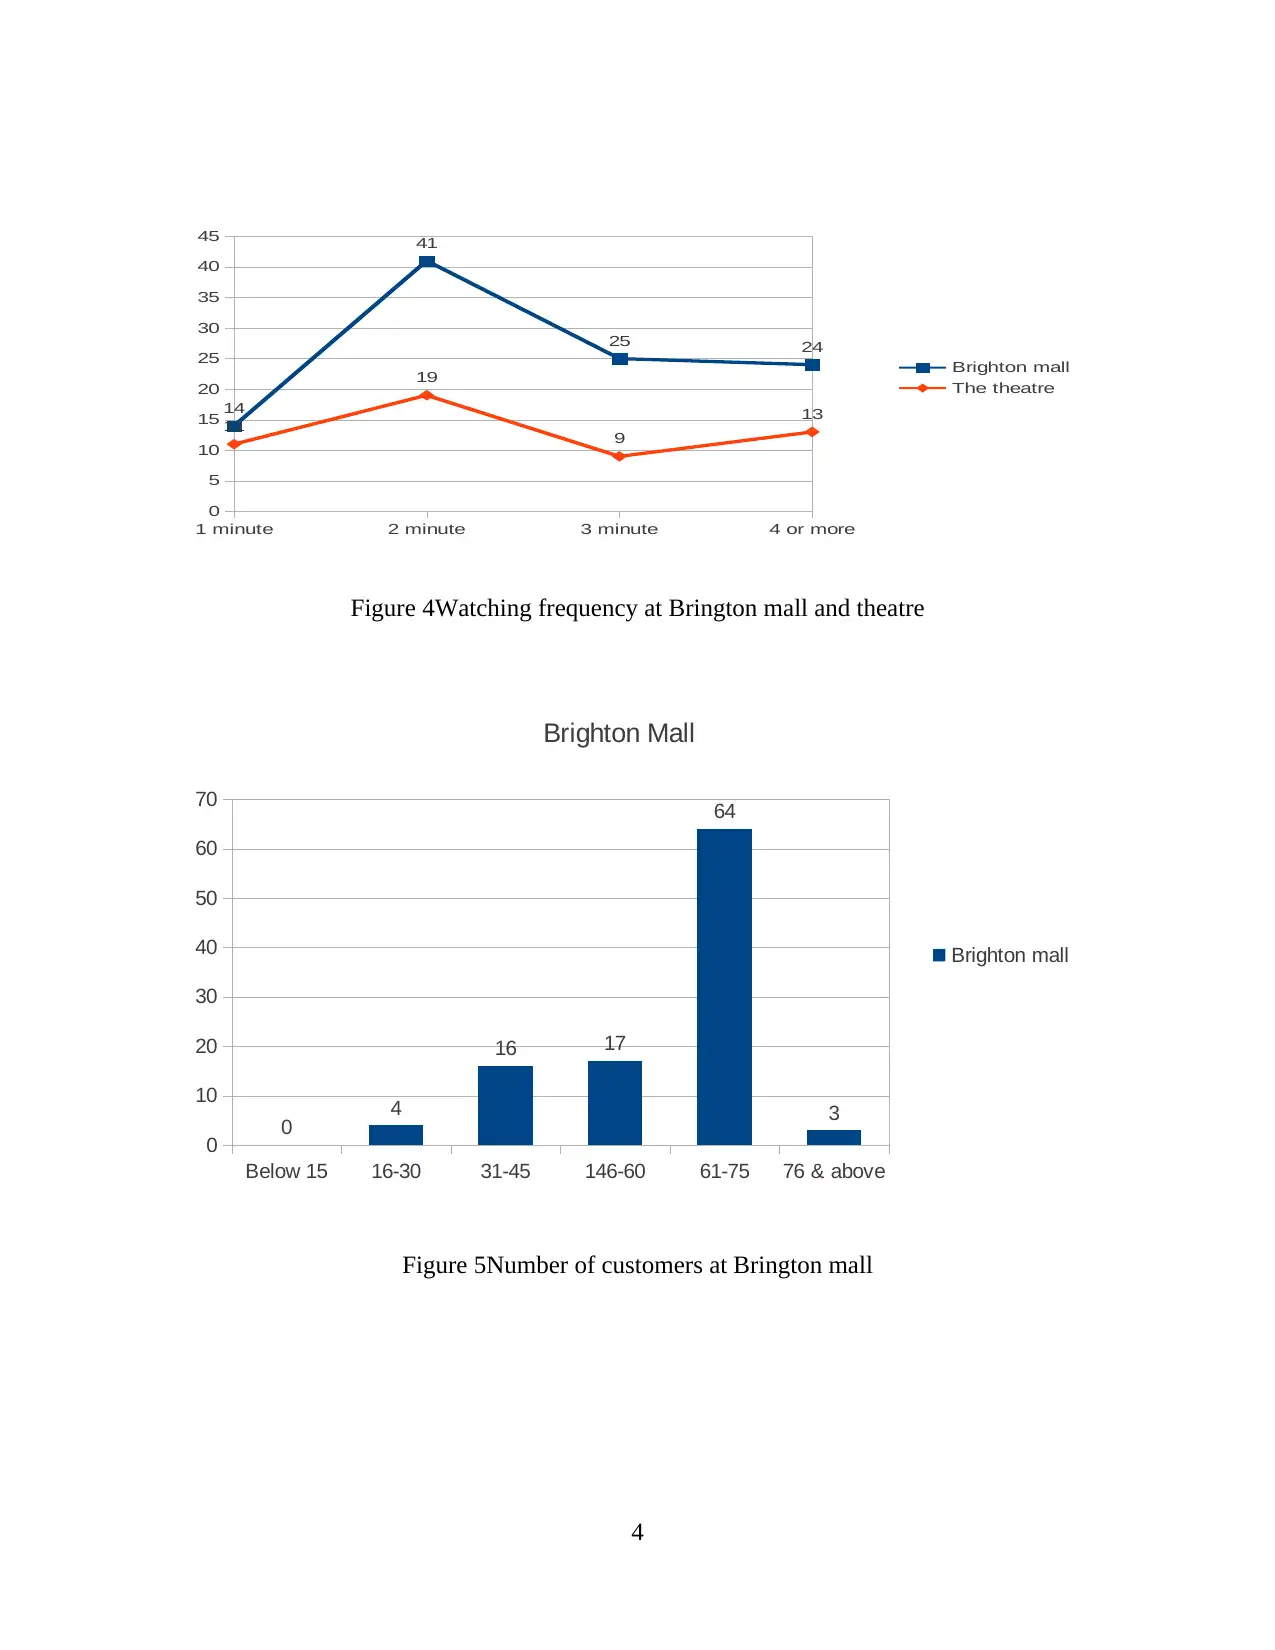
Figure 4Watching frequency at Brington mall and theatre
Below 15 16-30 31-45 146-60 61-75 76 & above
0
10
20
30
40
50
60
70
0 4
16 17
64
3
Brighton Mall
Brighton mall
Figure 5Number of customers at Brington mall
4
0
5
10
15
20
25
30
35
40
45
14
41
25 24
11
19
9
13
Brighton mall
The theatre
Figure 4Watching frequency at Brington mall and theatre
Below 15 16-30 31-45 146-60 61-75 76 & above
0
10
20
30
40
50
60
70
0 4
16 17
64
3
Brighton Mall
Brighton mall
Figure 5Number of customers at Brington mall
4
⊘ This is a preview!⊘
Do you want full access?
Subscribe today to unlock all pages.
Trusted by 1+ million students worldwide
Below 15 16-30 31-45 146-60 61-75 76 & above
0
5
10
15
20
25
30
35
40
45
2 0 0
9
41
0
The Theatre
The theatre
Figure 6Number of customers at theatre
Female
Male
0 0.1 0.2 0.3 0.4 0.5 0.6 0.7
63%
38%
Brighton Mall
Brighton mall
Figure 7Male and female segregation at Bringhton mall
5
0
5
10
15
20
25
30
35
40
45
2 0 0
9
41
0
The Theatre
The theatre
Figure 6Number of customers at theatre
Female
Male
0 0.1 0.2 0.3 0.4 0.5 0.6 0.7
63%
38%
Brighton Mall
Brighton mall
Figure 7Male and female segregation at Bringhton mall
5
Paraphrase This Document
Need a fresh take? Get an instant paraphrase of this document with our AI Paraphraser
Female
Male
0 0.1 0.2 0.3 0.4 0.5 0.6 0.7
58%
42%
The Theatre
The theatre
Figure 8Male and female visit at theatre
Female
Male
0 0.1 0.2 0.3 0.4 0.5 0.6 0.7
61%
39%
Combined results
Combined results
Figure 9Combined results
Interpretation
6
Male
0 0.1 0.2 0.3 0.4 0.5 0.6 0.7
58%
42%
The Theatre
The theatre
Figure 8Male and female visit at theatre
Female
Male
0 0.1 0.2 0.3 0.4 0.5 0.6 0.7
61%
39%
Combined results
Combined results
Figure 9Combined results
Interpretation
6
On analysis of images it is identified that there were people that view events for 1,2,3 and
4 minutes respectively in Brington mall. On analysis of facts and figures it can be stated that
most of respondents view concert for 3 to 4 minutes. If data that is collected from mall is
compared with theatre it can be observed that in latter one most of people listen music for 2 to 4
minute time period. It can be said that there are different trends in terms of listening of music
in mall and theatre. In the shopping centre old age people mostly come to listen music as data
revealed that majority of respondents were in age group of 60-74 in the mentioned location. At
second place people that listen music are in category of range of 31-45 and 46-60. It can be
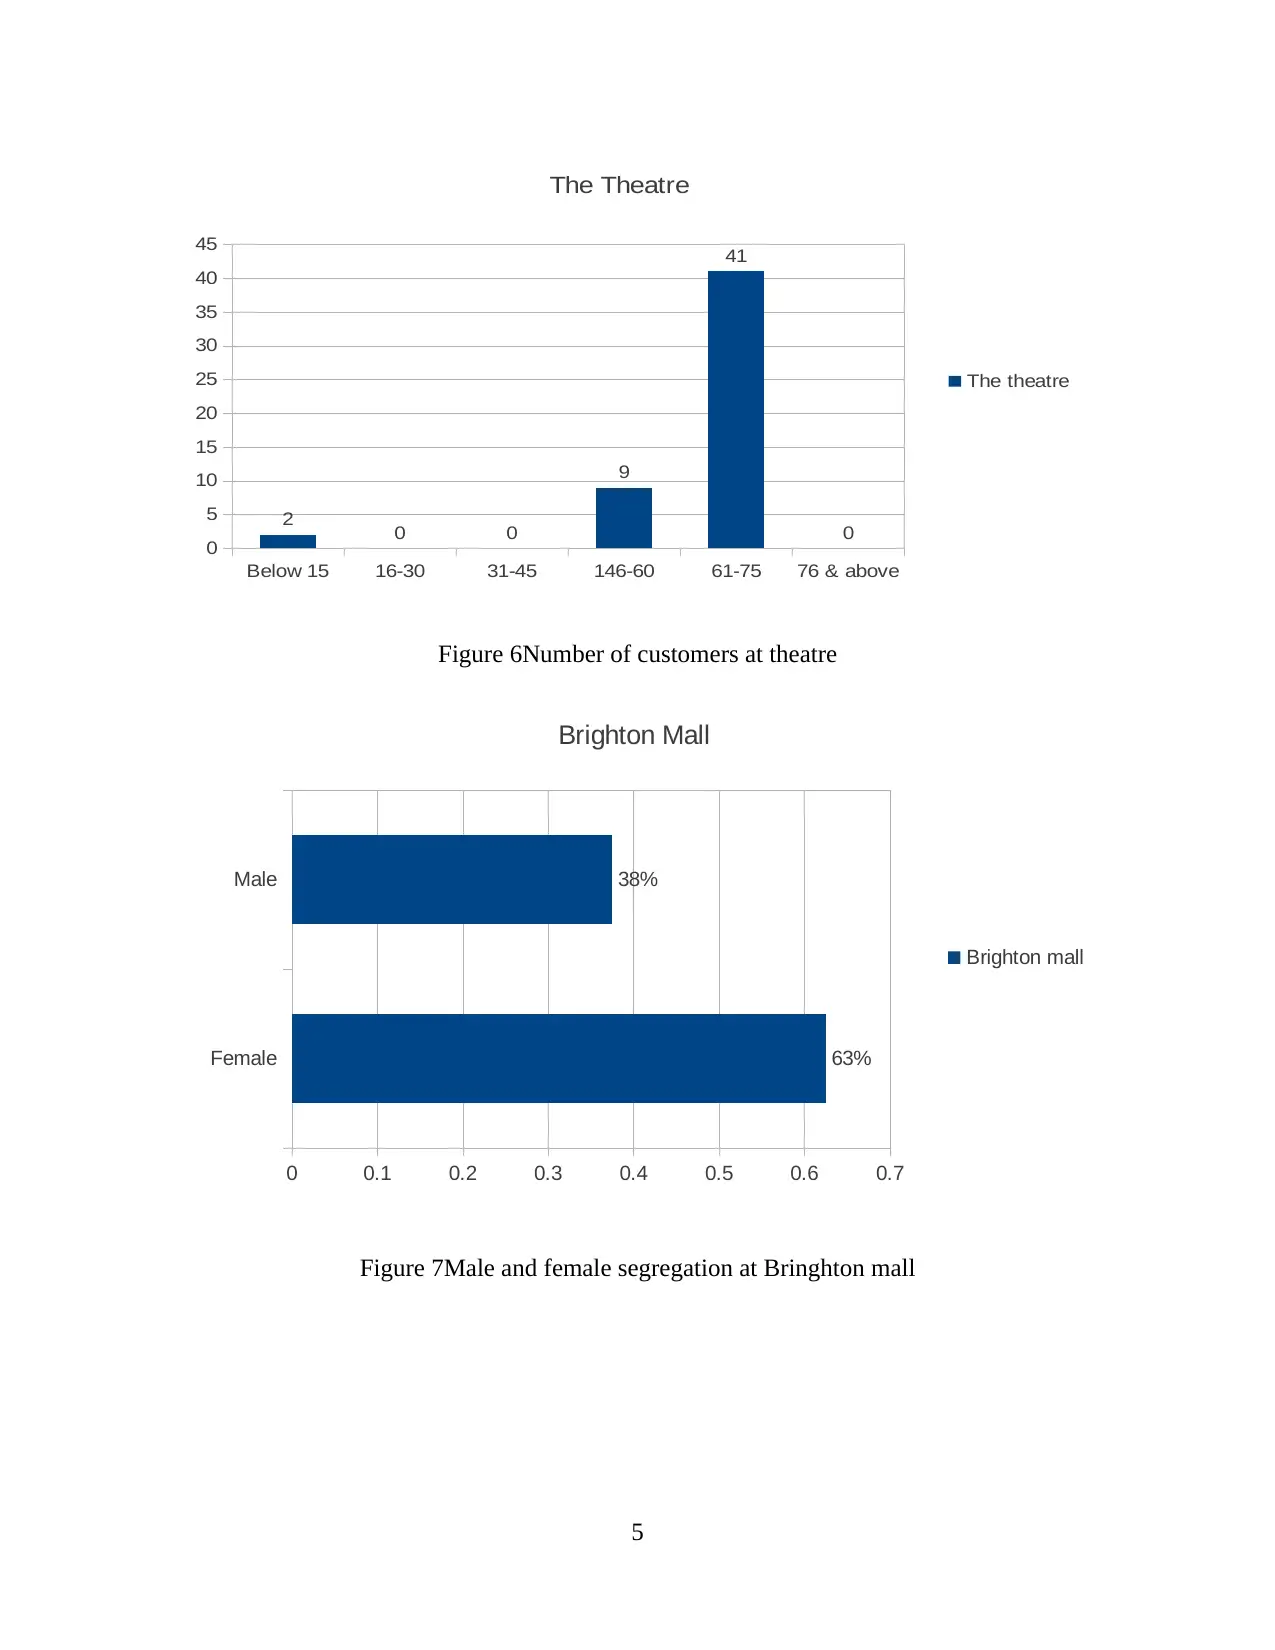
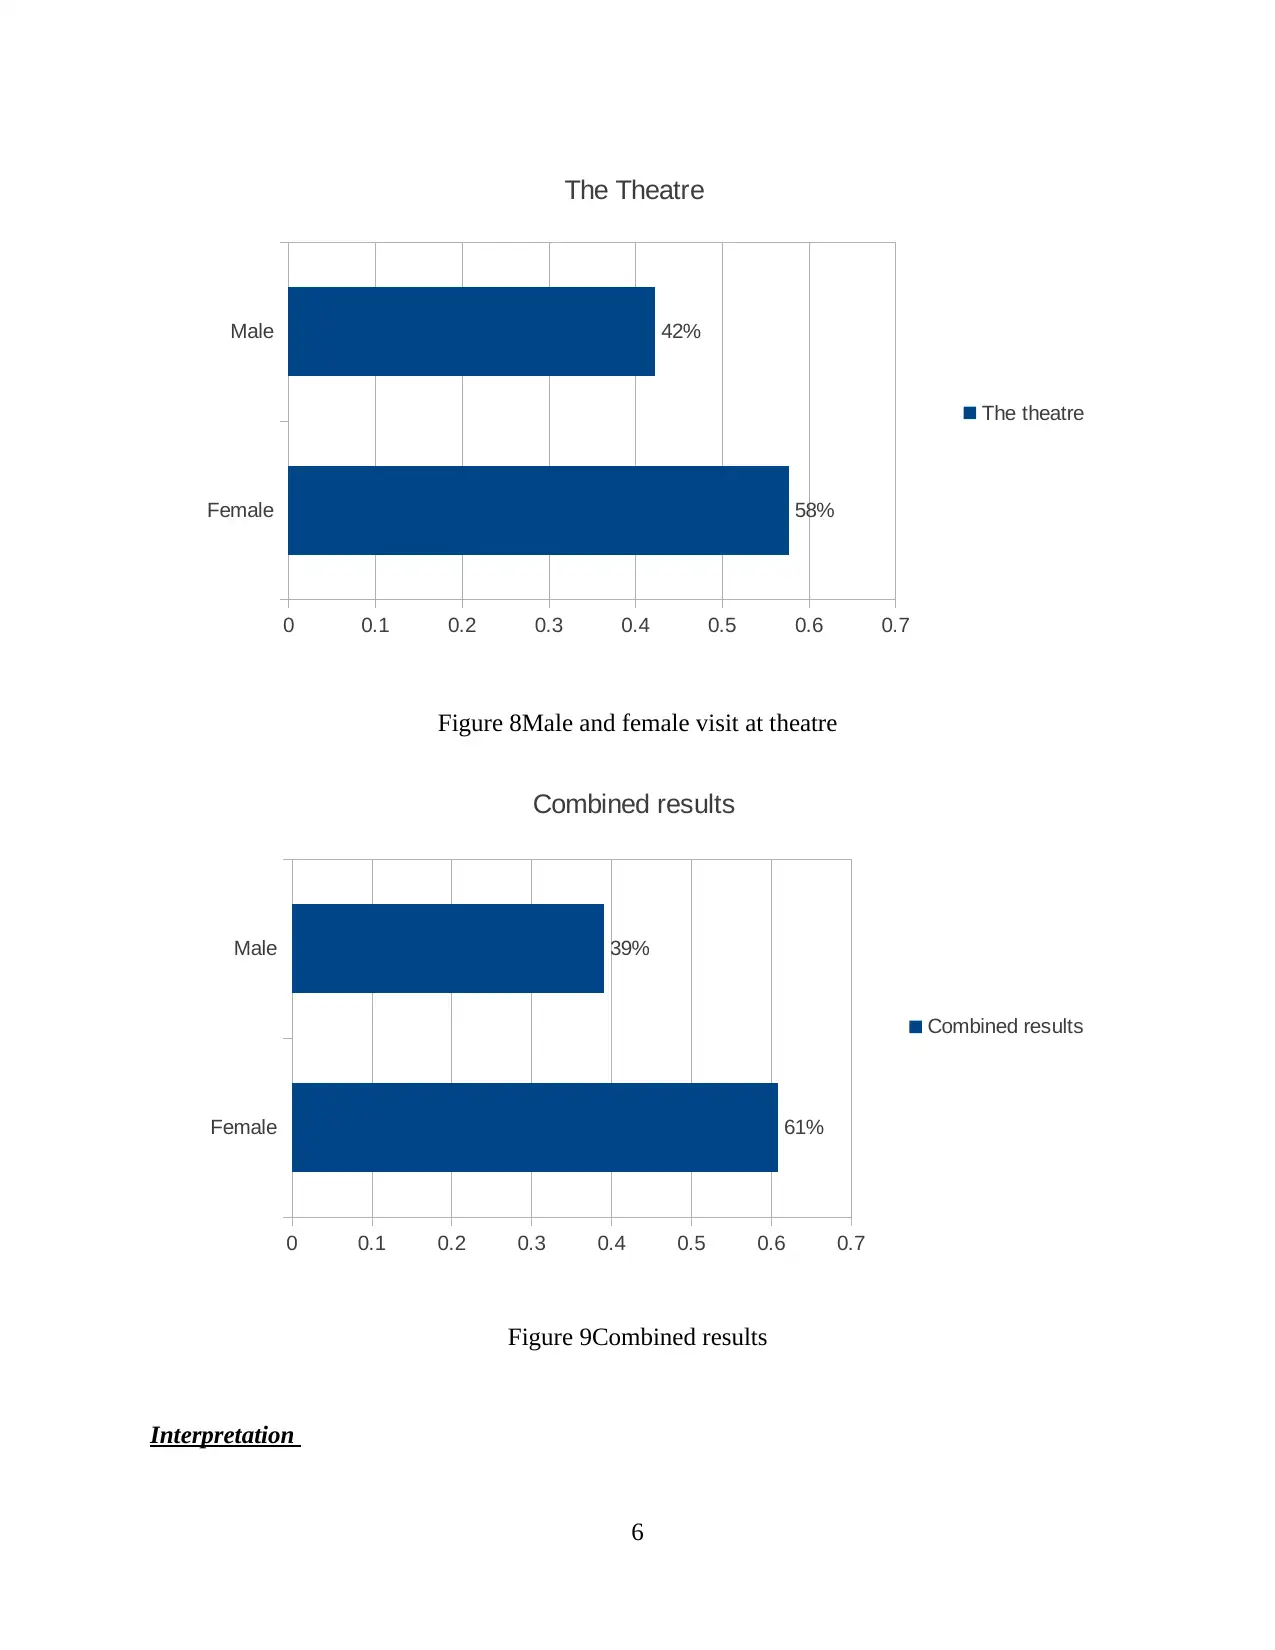
observed that female view music more than male in case of Brington mall and theatre. Results
are clearly reflecting that female music listening percentage is 63% and same is 58% in case of
theatre. Hence, it can be said that there is no big difference in percentage across both areas. In
case of male it can be identified that their percentage is 38% and 42% in case of mall and theatre.
Thus, it can be said that there is big gap in listening music in case of male then females.
(b) Biases and data collection
Biases refers to the situation under which one does not collect data from all sort of
sample units. One selectively select specific group of people as respondents and ignore other
relevant group of people. Hence, it can be said that data is not collected in proper manner and
research failed to produce relevant results. In respect to research data is not collected in proper
manner because manually it is determined that one exit from concert and relevant time was
recorded. It is possible that respondent may after exiting may again enter in to concert program
(Elberse, 2010). Thus, it can be said that data is not collected in proper manner.
© Ways need to be adopted for data collection
For data collection in proper manner questionnaire can be distributed among respondents
in systematic way and final exit time can be asked them to record in questionnaire. In this way
data can be gathered in proper manner and by analysing same decisions can be taken in
systematic manner (Sinha, Machado and Selman, 2010). It can be said that it is the perfect way
to adopt the data collection method. It can be said that there is need to follow appropriate
approach so that data can be collected in better way.
7
4 minutes respectively in Brington mall. On analysis of facts and figures it can be stated that
most of respondents view concert for 3 to 4 minutes. If data that is collected from mall is
compared with theatre it can be observed that in latter one most of people listen music for 2 to 4
minute time period. It can be said that there are different trends in terms of listening of music
in mall and theatre. In the shopping centre old age people mostly come to listen music as data
revealed that majority of respondents were in age group of 60-74 in the mentioned location. At
second place people that listen music are in category of range of 31-45 and 46-60. It can be
observed that female view music more than male in case of Brington mall and theatre. Results
are clearly reflecting that female music listening percentage is 63% and same is 58% in case of
theatre. Hence, it can be said that there is no big difference in percentage across both areas. In
case of male it can be identified that their percentage is 38% and 42% in case of mall and theatre.
Thus, it can be said that there is big gap in listening music in case of male then females.
(b) Biases and data collection
Biases refers to the situation under which one does not collect data from all sort of
sample units. One selectively select specific group of people as respondents and ignore other
relevant group of people. Hence, it can be said that data is not collected in proper manner and
research failed to produce relevant results. In respect to research data is not collected in proper
manner because manually it is determined that one exit from concert and relevant time was
recorded. It is possible that respondent may after exiting may again enter in to concert program
(Elberse, 2010). Thus, it can be said that data is not collected in proper manner.
© Ways need to be adopted for data collection
For data collection in proper manner questionnaire can be distributed among respondents
in systematic way and final exit time can be asked them to record in questionnaire. In this way
data can be gathered in proper manner and by analysing same decisions can be taken in
systematic manner (Sinha, Machado and Selman, 2010). It can be said that it is the perfect way
to adopt the data collection method. It can be said that there is need to follow appropriate
approach so that data can be collected in better way.
7
⊘ This is a preview!⊘
Do you want full access?
Subscribe today to unlock all pages.
Trusted by 1+ million students worldwide
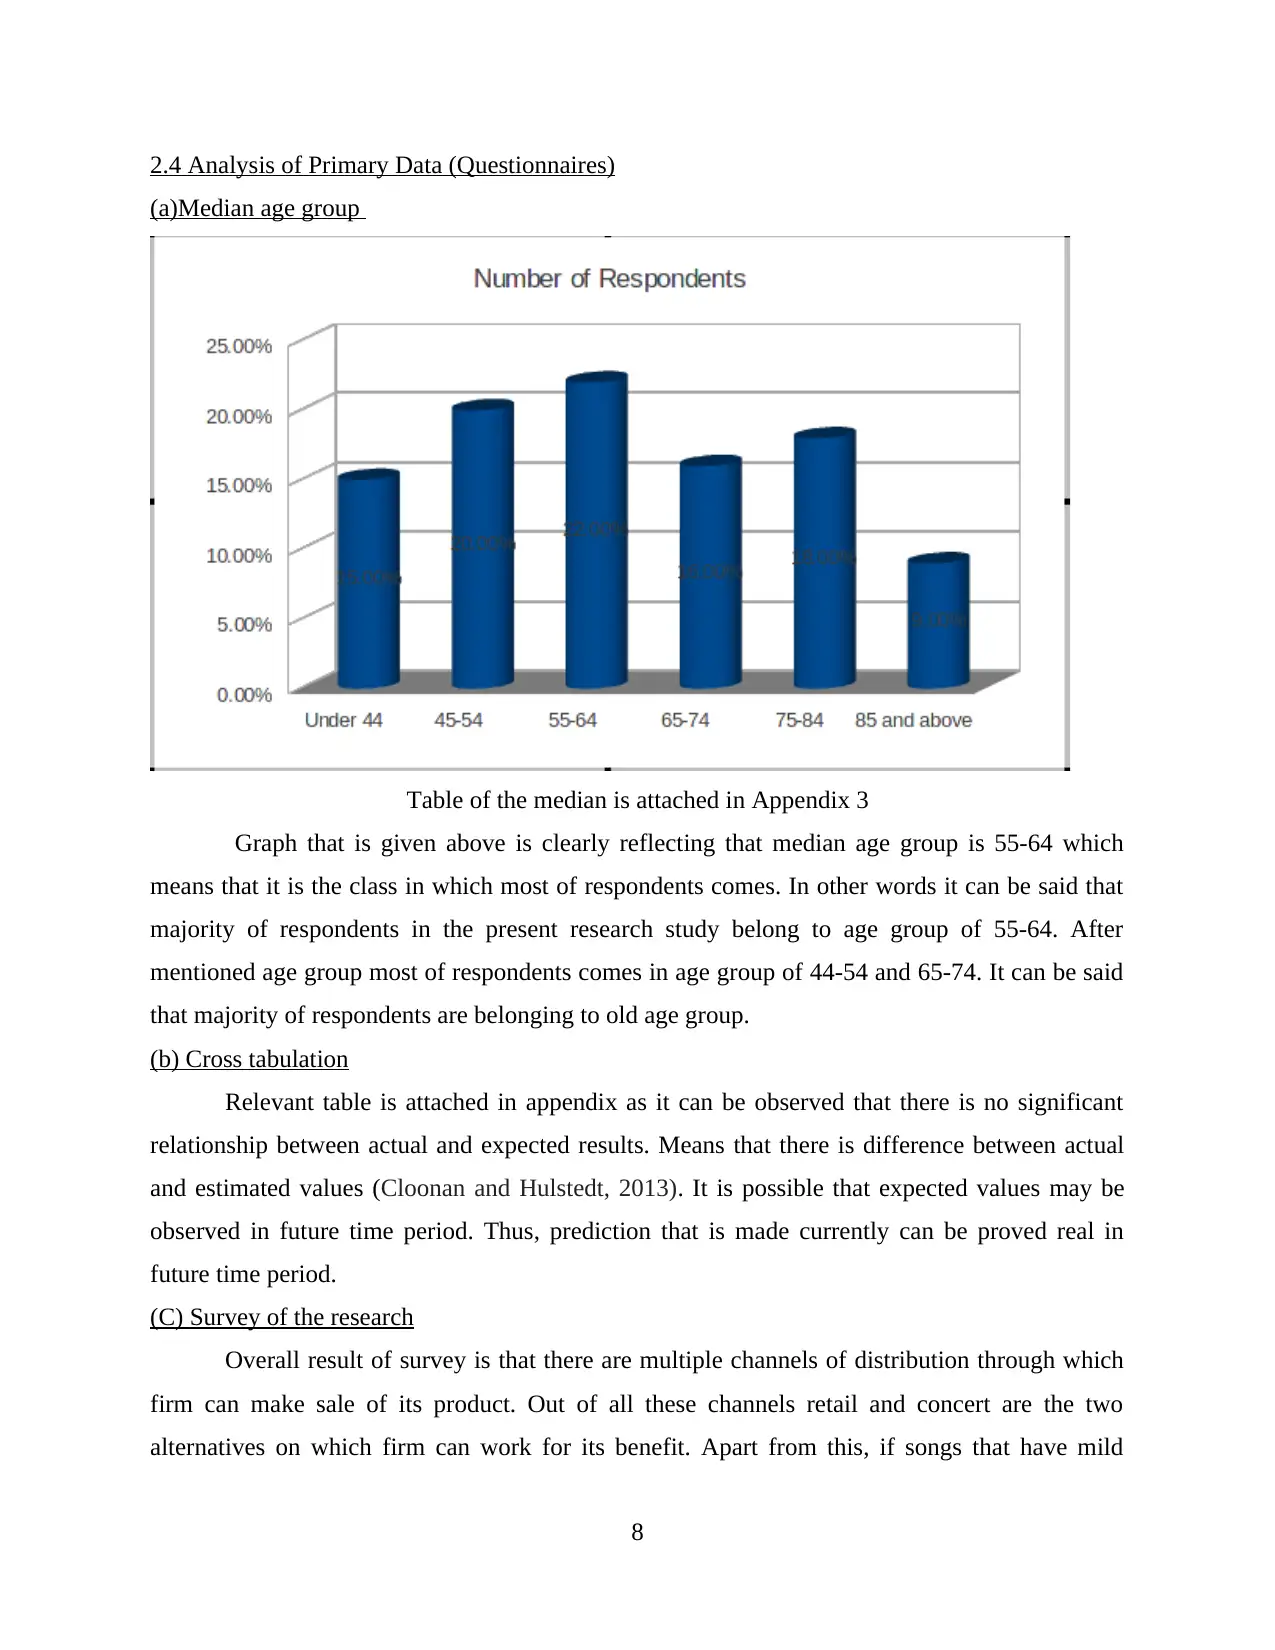
2.4 Analysis of Primary Data (Questionnaires)
(a)Median age group
Table of the median is attached in Appendix 3
Graph that is given above is clearly reflecting that median age group is 55-64 which
means that it is the class in which most of respondents comes. In other words it can be said that
majority of respondents in the present research study belong to age group of 55-64. After
mentioned age group most of respondents comes in age group of 44-54 and 65-74. It can be said
that majority of respondents are belonging to old age group.
(b) Cross tabulation
Relevant table is attached in appendix as it can be observed that there is no significant
relationship between actual and expected results. Means that there is difference between actual
and estimated values (Cloonan and Hulstedt, 2013). It is possible that expected values may be
observed in future time period. Thus, prediction that is made currently can be proved real in
future time period.
(C) Survey of the research
Overall result of survey is that there are multiple channels of distribution through which
firm can make sale of its product. Out of all these channels retail and concert are the two
alternatives on which firm can work for its benefit. Apart from this, if songs that have mild
8
Paraphrase This Document
Need a fresh take? Get an instant paraphrase of this document with our AI Paraphraser
music are launched in the market then in that case old people must be targeted. On other hand, if
firm is launching new music then it must target youngsters.
(d) Things need to be done differently
There are lots of things that need to be done differently and under this small sample must be
taken in the present research (Aguiar and Martens, 2016). It must be ensured that only reliable
candidates are taken as sample units in the present research. This will ensure that reliable results
are produced by the current research study.
(a)Output for analysis and assumption
There is need to follow appropriate strategy for marketing of products and in this regard
Johnnie music can follow specific tactic in order to enhance sale of its product. As part of
strategy main focus must be on the old people instead of new one because mentioned sort of
people listen music to great extent (UK music, 2017). As part of Nostalgia marketing with old
songs album can be associated and by doing so more and more aged people can be promoted to
listen the album. This will lead to increase in sale of the product in the market.
2. Conclusions
On the basis of above discussion it is concluded that music industry is growing at rapid
pace across the globe. There are different sort of customers in this segment of entrainment
industry and their purchasing behaviour as well as preferences are also different from each other.
Reason is that old people like peaceful environment and due to this reason they prefer to listen
old songs. On other hand, young people preferences are totally different as they like fun in life
and give preference to rocking music. It can be said that while launching new product in the
market firm must identify its target customers and accordingly must prepare marketing
strategies. Main focus must be on retail and concerts to increase sale of the product.
9
REFERENCES
Books and Journals
Aguiar, L. and Martens, B., 2016. Digital music consumption on the internet: evidence from
clickstream data. Information Economics and Policy. 34. pp.27-43.
Cloonan, M. and Hulstedt, L., 2013. Looking for something new: The provision of Popular
Music Studies Degrees in the UK. IASPM@ Journal: Journal of the International
Association for the Study of Popular Music. 3(2). pp.63-77.
Elberse, A., 2010. Bye-bye bundles: The unbundling of music in digital channels. Journal of
Marketing. 74(3). pp.107-123.
Ferreira, F. and Waldfogel, J., 2013. Pop internationalism: has half a century of world music
trade displaced local culture?. The Economic Journal. 123(569). pp.634-664.
Krause, A.E., North, A.C. and Heritage, B., 2014. The uses and gratifications of using Facebook
music listening applications. Computers in Human Behavior. 39. pp.71-77.
Sinha, R.K., Machado, F.S. and Sellman, C., 2010. Don't think twice, it's all right: Music piracy
and pricing in a DRM-free environment. Journal of Marketing. 74(2). pp.40-54.
Wikström, P., 2012. A typology of music distribution models. International Journal of Music
Business Research. 1(1). pp.7-20.
Online
UK music, 2017. [Online]. Available through:< http://www.ukmusic.org/>. [Accessed on 30th
June 2017].
10
⊘ This is a preview!⊘
Do you want full access?
Subscribe today to unlock all pages.
Trusted by 1+ million students worldwide
1 out of 14
Related Documents


Your All-in-One AI-Powered Toolkit for Academic Success.
+13062052269
info@desklib.com
Available 24*7 on WhatsApp / Email
![[object Object]](/_next/static/media/star-bottom.7253800d.svg)
Unlock your academic potential
Copyright © 2020–2026 A2Z Services. All Rights Reserved. Developed and managed by ZUCOL.