Evaluating Trends & Development in UK Oil & Gas Industries Market
VerifiedAdded on 2023/04/21
|15
|2957
|216
Report
AI Summary
This report provides an overview of the UK retail petroleum market, focusing on the changes and trends impacting its supply chain. It examines the shift from vertically integrated supply chains to more decomposed and outsourced networks. The report highlights the changes in ownership structures, including the growth of hypermarkets and the exit of fuel suppliers. It also discusses the impact of changing demand for petrol and diesel, and the strategies companies have adopted to adapt. The report also touches upon the upstream supply chain and the reasons behind major oil companies divesting from downstream operations. The study uses data and statistics to illustrate the changes in the UK petroleum market.
Development in
oil and gas
industries
1
oil and gas
industries
1
Paraphrase This Document
Need a fresh take? Get an instant paraphrase of this document with our AI Paraphraser
TABLE OF CONTENTS
Introduction .....................................................................................................................................3
Downstream supply chain of petroleum market .........................................................................4
Change in ownership structures...................................................................................................5
Growth in hypermarkets..............................................................................................................7
Exit of fuel suppliers....................................................................................................................7
Upstream supply chain of petroleum market ..............................................................................9
Conclusion ......................................................................................................................................9
References......................................................................................................................................11
2
ILLUSTRATION INDEX
Illustration 1: UK petrol stations, number of cars registered and average number of cars per
petrol station ....................................................................................................................................4
Illustration 2: Number of PFS and their percentage breakdown over the years..............................7
Illustration 3: Fuel sales, number of petrol stations and average volume of fuel sold per petrol
station ............................................................................................................................................10
3
⊘ This is a preview!⊘
Do you want full access?
Subscribe today to unlock all pages.
Trusted by 1+ million students worldwide

INDEX OF TABLES
Table 1: Number of PFS by considering its ownership structure....................................................7
4
Table 1: Number of PFS by considering its ownership structure....................................................7
4
Paraphrase This Document
Need a fresh take? Get an instant paraphrase of this document with our AI Paraphraser

INTRODUCTION
UK retail petroleum market can be defined as industry that works according to sales of
transportation and fuel used in transportation sector (i.e. diesel and petrol) to the business entities
and consumers through petrol filling stations network of the country (Brookes, Altinay and
Ringham, 2014). This sector is continuously expanding and facing severe changes in various
significant aspects such as demand drivers, retailers, PFS proximity and their functional
activities. Present study focuses on evaluation of various trends that impacts the working of UK
petroleum sector and its supply chain. For this aspect, supply chain in retail petroleum market
will be discussed by considering changes occurred in this industry. Further, implications will be
evaluated on the basis of UK statistics.
Application of diverse trends and changes that impacts the working of UK petroleum retail
market
The road transport fuels markets had attained substantial growth in the last decade while
there is significant reduction in the petrol filling stations. This sector had faced continuous
change due to structural change driven by the market forces and variation in consumer behavior
and their purchase decisions.
5

In accordance with the retail market survey, in late 1960 various petrol stations has been
demolished that has impacted overall working. It is because, organizations were required to pay
high fixed cost and there was low business margins. As a consequence, high volume was
required to attain the break even point (Santos and Svensson, 2013). Various independent
forecourts were not able to attain the desired volumes mainly at the remote locations. In addition
to this, organizations have to compete with the large entities due to which they were not able to
maintain competitive price in market and sell of fuel has also reduced. These factors had created
various barriers for the survival of small firm and henceforth they have to exit from the market.
As per the study of Energy Institute’s Retail Marketing Survey 2007 and 2012, the fueling
position in the UK has been increased due to reduction in PFS.
In present era, various firms are offering self services at the petrol station so they can
make huge saving in labor costs (Shuen, Feiler and Teece, 2014). By this strategy there were
able to attain cost advantage in comparison to the small petrol stations. Closure of PFS had made
reduction in the storage capacity of these stations. Due to this aspect, there is detrimental impact
6
Illustration 1: Ratio of cars registered and visit of cars at petrol stations
(Source: Study of UK petroleum market, 2012)
⊘ This is a preview!⊘
Do you want full access?
Subscribe today to unlock all pages.
Trusted by 1+ million students worldwide
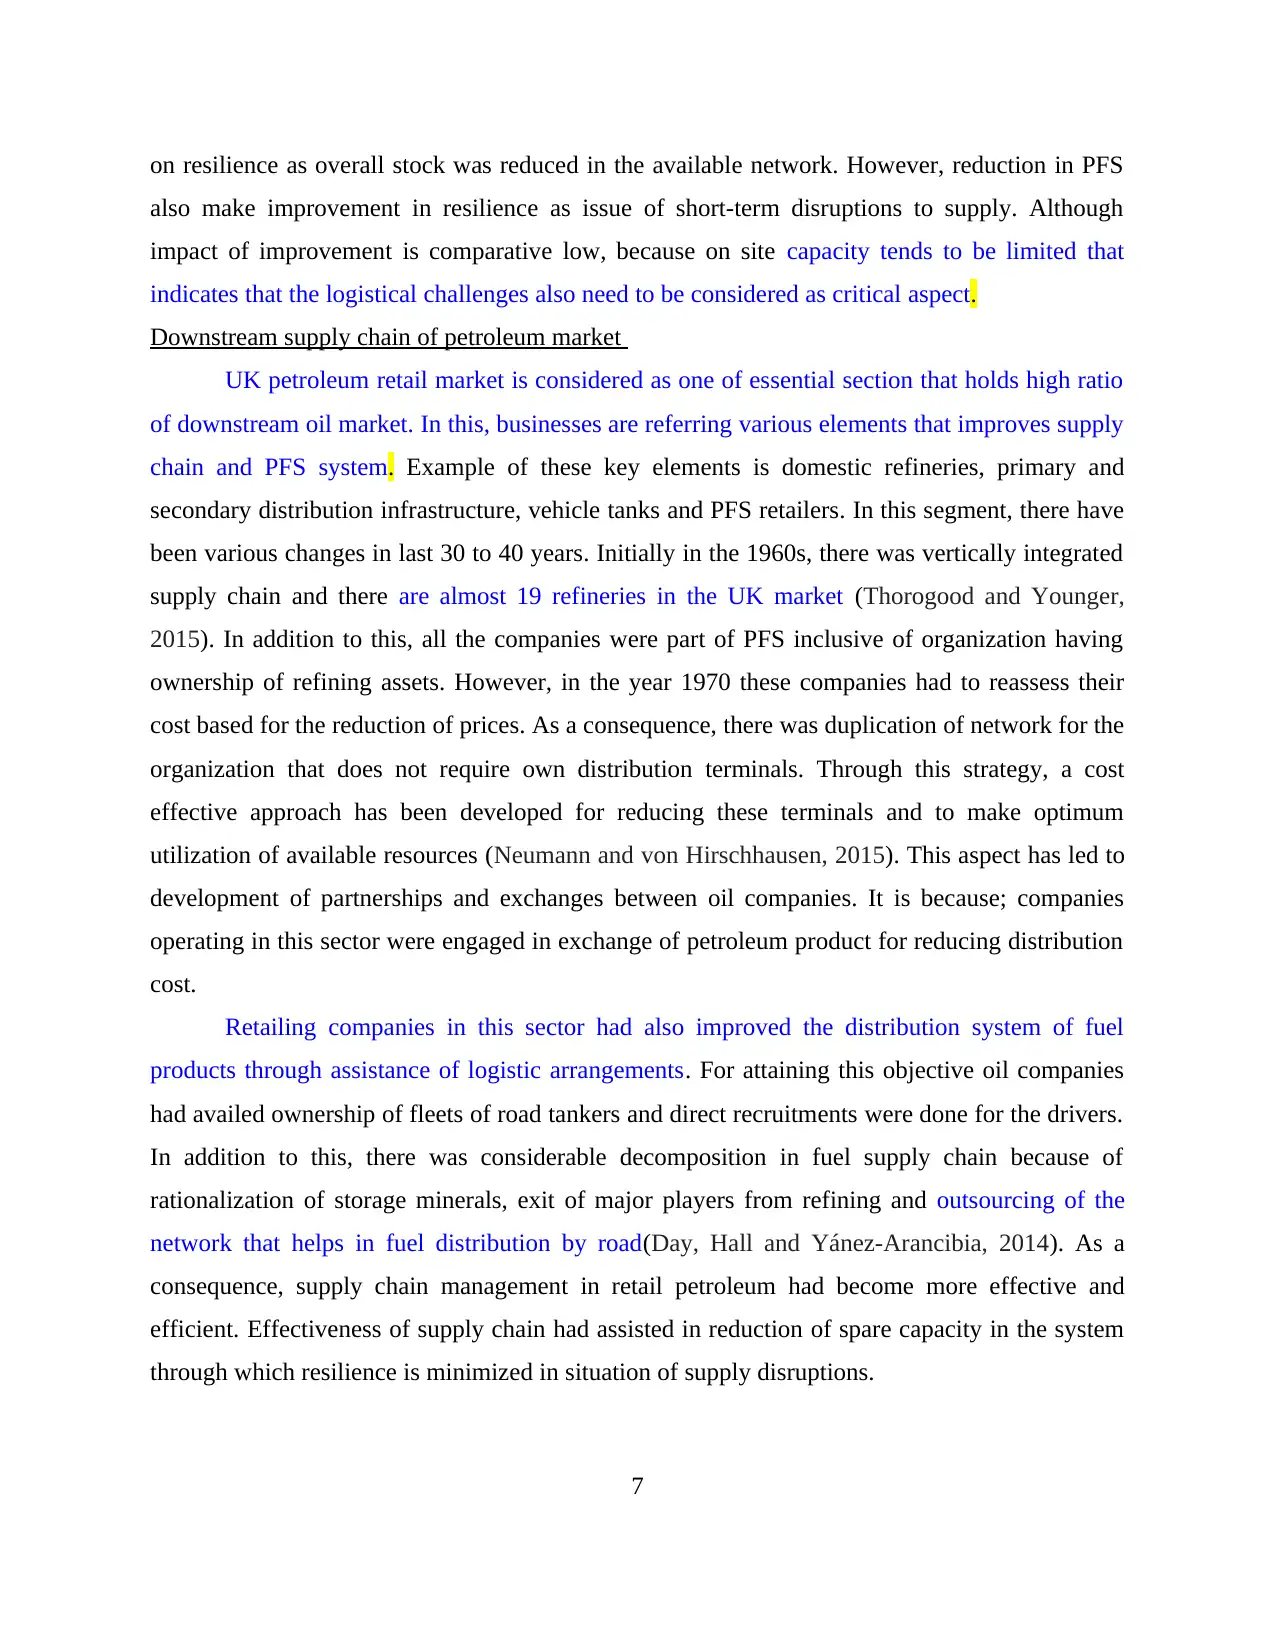
on resilience as overall stock was reduced in the available network. However, reduction in PFS
also make improvement in resilience as issue of short-term disruptions to supply. Although
impact of improvement is comparative low, because on site capacity tends to be limited that
indicates that the logistical challenges also need to be considered as critical aspect.
Downstream supply chain of petroleum market
UK petroleum retail market is considered as one of essential section that holds high ratio
of downstream oil market. In this, businesses are referring various elements that improves supply
chain and PFS system. Example of these key elements is domestic refineries, primary and
secondary distribution infrastructure, vehicle tanks and PFS retailers. In this segment, there have
been various changes in last 30 to 40 years. Initially in the 1960s, there was vertically integrated
supply chain and there are almost 19 refineries in the UK market (Thorogood and Younger,
2015). In addition to this, all the companies were part of PFS inclusive of organization having
ownership of refining assets. However, in the year 1970 these companies had to reassess their
cost based for the reduction of prices. As a consequence, there was duplication of network for the
organization that does not require own distribution terminals. Through this strategy, a cost
effective approach has been developed for reducing these terminals and to make optimum
utilization of available resources (Neumann and von Hirschhausen, 2015). This aspect has led to
development of partnerships and exchanges between oil companies. It is because; companies
operating in this sector were engaged in exchange of petroleum product for reducing distribution
cost.
Retailing companies in this sector had also improved the distribution system of fuel
products through assistance of logistic arrangements. For attaining this objective oil companies
had availed ownership of fleets of road tankers and direct recruitments were done for the drivers.
In addition to this, there was considerable decomposition in fuel supply chain because of
rationalization of storage minerals, exit of major players from refining and outsourcing of the
network that helps in fuel distribution by road(Day, Hall and Yánez-Arancibia, 2014). As a
consequence, supply chain management in retail petroleum had become more effective and
efficient. Effectiveness of supply chain had assisted in reduction of spare capacity in the system
through which resilience is minimized in situation of supply disruptions.
7
Paraphrase This Document
Need a fresh take? Get an instant paraphrase of this document with our AI Paraphraser
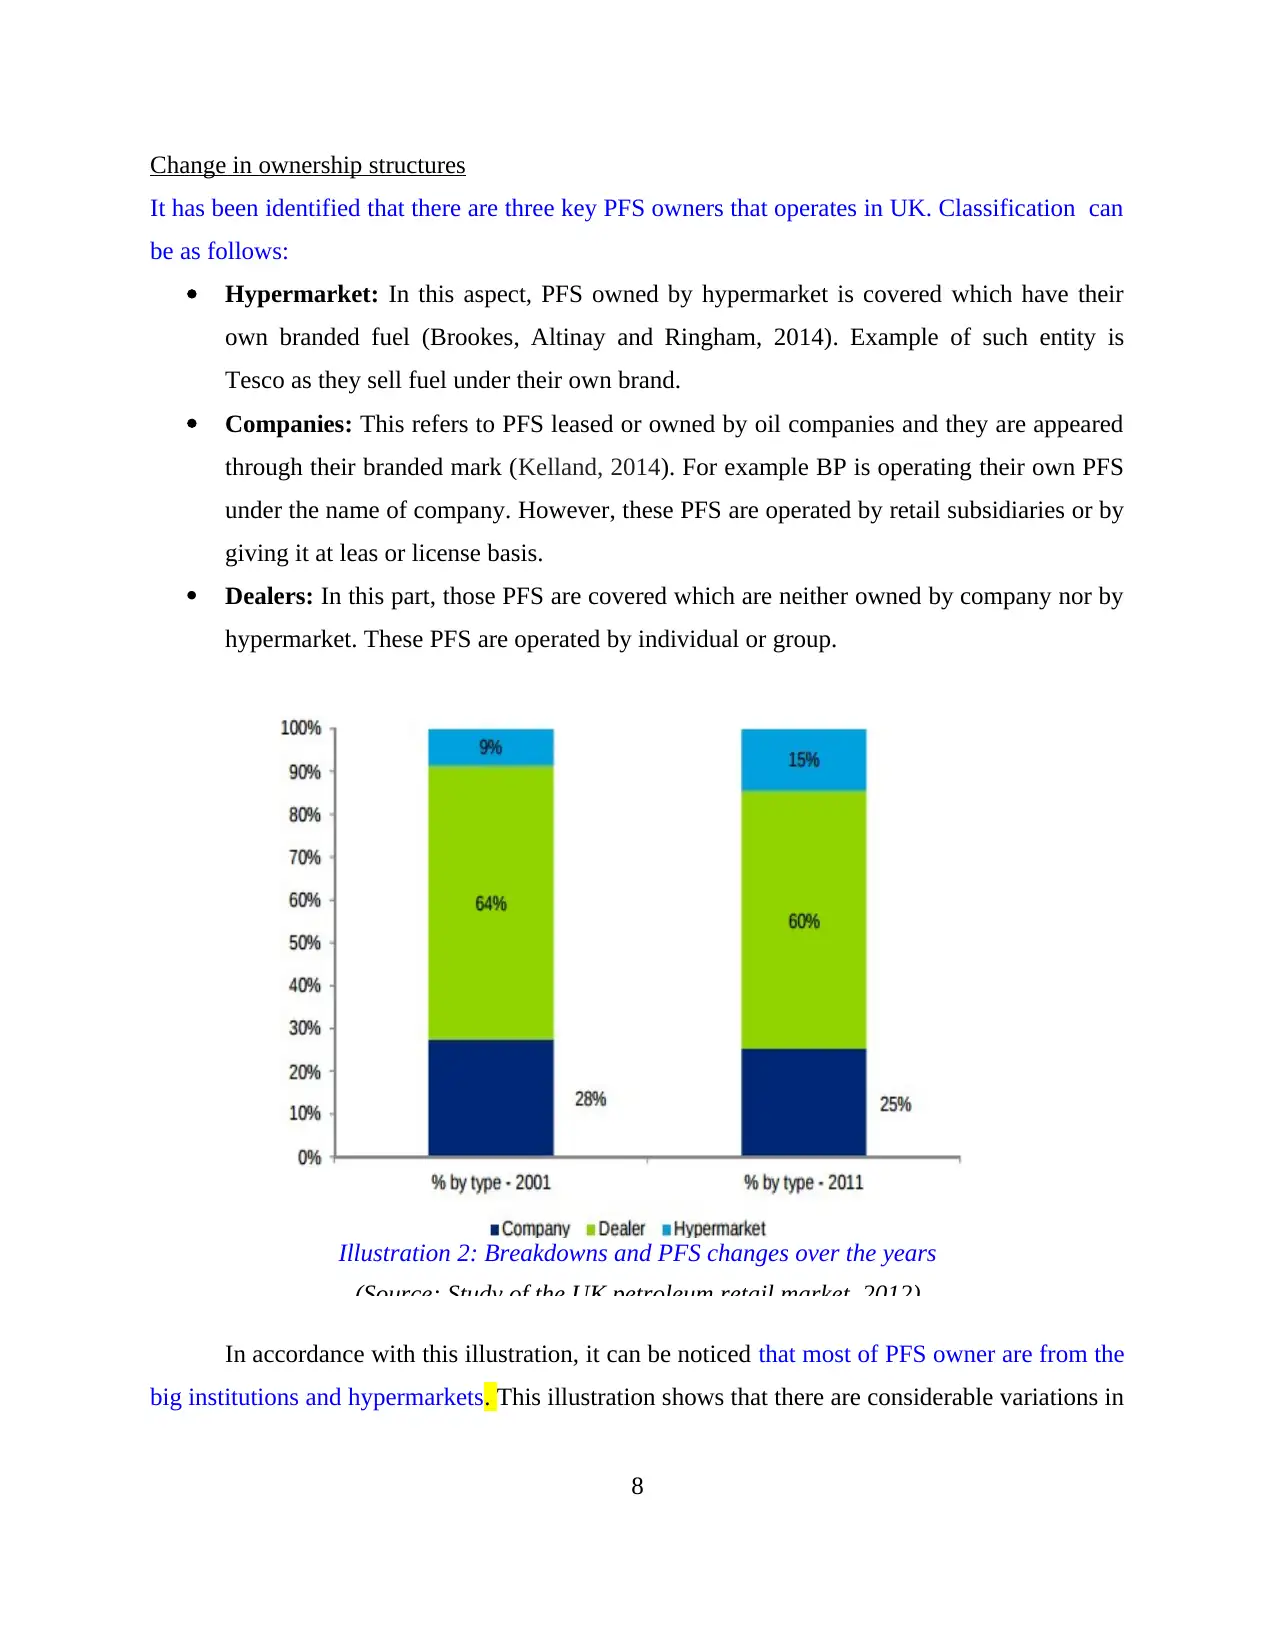
Change in ownership structures
It has been identified that there are three key PFS owners that operates in UK. Classification can
be as follows:
Hypermarket: In this aspect, PFS owned by hypermarket is covered which have their
own branded fuel (Brookes, Altinay and Ringham, 2014). Example of such entity is
Tesco as they sell fuel under their own brand.
Companies: This refers to PFS leased or owned by oil companies and they are appeared
through their branded mark (Kelland, 2014). For example BP is operating their own PFS
under the name of company. However, these PFS are operated by retail subsidiaries or by
giving it at leas or license basis.
Dealers: In this part, those PFS are covered which are neither owned by company nor by
hypermarket. These PFS are operated by individual or group.
In accordance with this illustration, it can be noticed that most of PFS owner are from the
big institutions and hypermarkets. This illustration shows that there are considerable variations in
8
Illustration 2: Breakdowns and PFS changes over the years
(Source: Study of the UK petroleum retail market, 2012)
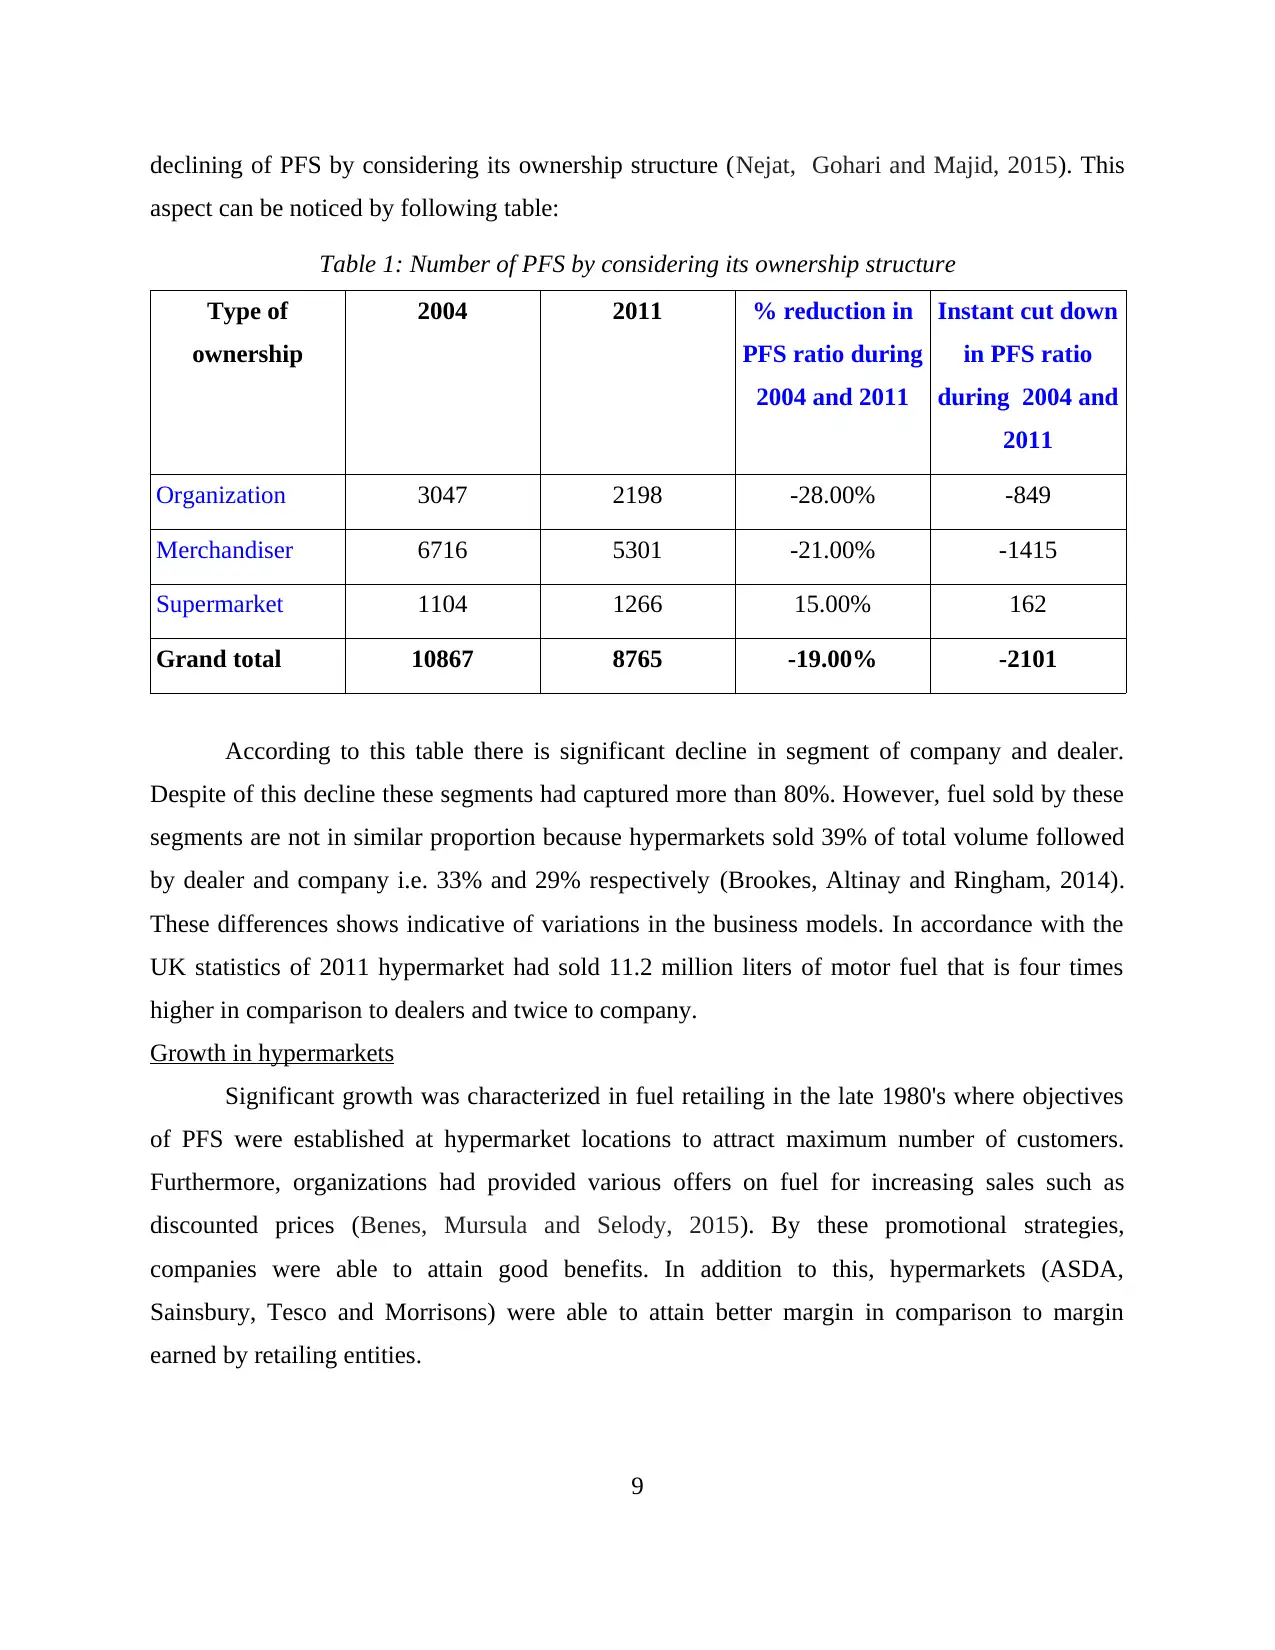
declining of PFS by considering its ownership structure (Nejat, Gohari and Majid, 2015). This
aspect can be noticed by following table:
Table 1: Number of PFS by considering its ownership structure
Type of
ownership
2004 2011 % reduction in
PFS ratio during
2004 and 2011
Instant cut down
in PFS ratio
during 2004 and
2011
Organization 3047 2198 -28.00% -849
Merchandiser 6716 5301 -21.00% -1415
Supermarket 1104 1266 15.00% 162
Grand total 10867 8765 -19.00% -2101
According to this table there is significant decline in segment of company and dealer.
Despite of this decline these segments had captured more than 80%. However, fuel sold by these
segments are not in similar proportion because hypermarkets sold 39% of total volume followed
by dealer and company i.e. 33% and 29% respectively (Brookes, Altinay and Ringham, 2014).
These differences shows indicative of variations in the business models. In accordance with the
UK statistics of 2011 hypermarket had sold 11.2 million liters of motor fuel that is four times
higher in comparison to dealers and twice to company.
Growth in hypermarkets
Significant growth was characterized in fuel retailing in the late 1980's where objectives
of PFS were established at hypermarket locations to attract maximum number of customers.
Furthermore, organizations had provided various offers on fuel for increasing sales such as
discounted prices (Benes, Mursula and Selody, 2015). By these promotional strategies,
companies were able to attain good benefits. In addition to this, hypermarkets (ASDA,
Sainsbury, Tesco and Morrisons) were able to attain better margin in comparison to margin
earned by retailing entities.
9
⊘ This is a preview!⊘
Do you want full access?
Subscribe today to unlock all pages.
Trusted by 1+ million students worldwide
In early 1990, there was also change in demand factors as demand of petrol was
continuously decreasing whereas demand of diesel was continuously increasing. Due to this
aspect, suppliers had modified their business strategies to meet the changing demand in market
(Skea, 2014). For this aspect, UK refineries were mainly established for refining of petrol that is
used in vehicles. Moreover, the oil used in heating and power generation has also been refined.
Transformation in demand mix leads to oversupply and enhance export of the UK and fuel
importers got the opportunity for developing product pricing and positioning.
With the changing trends in supply chain organization operating in this industry had
modified their operational tactics for better survival. In this manner, they are able to make
effective utilization of available resources in order to attain their aims and objectives in an
effective manner (Day, Hall and Yánez-Arancibia, 2014). In addition to this, retail players in
hypermarket are able to cope up with the market changes.
Exit of fuel suppliers
Fuel suppliers has been removed from the physical deliveries of fuel as it was undertaken
by road hauliers as they were mainly focused on the labour disputes in the industry. Road
hauliers had pressurized existing firms to cut down the pricing of the goods at supply chain
stages which may lead to various critical dispute situations (Nejat, Gohari and Majid, 2015). Exit
of major organization had motivated organizations for rationalization of networks in order to
satisfy demand in an effective manner. Further, import had provided an additional assistance to
the UK supply system through which developments in supply can be increase as it requires
diversified resources for accomplishment.
10
Paraphrase This Document
Need a fresh take? Get an instant paraphrase of this document with our AI Paraphraser
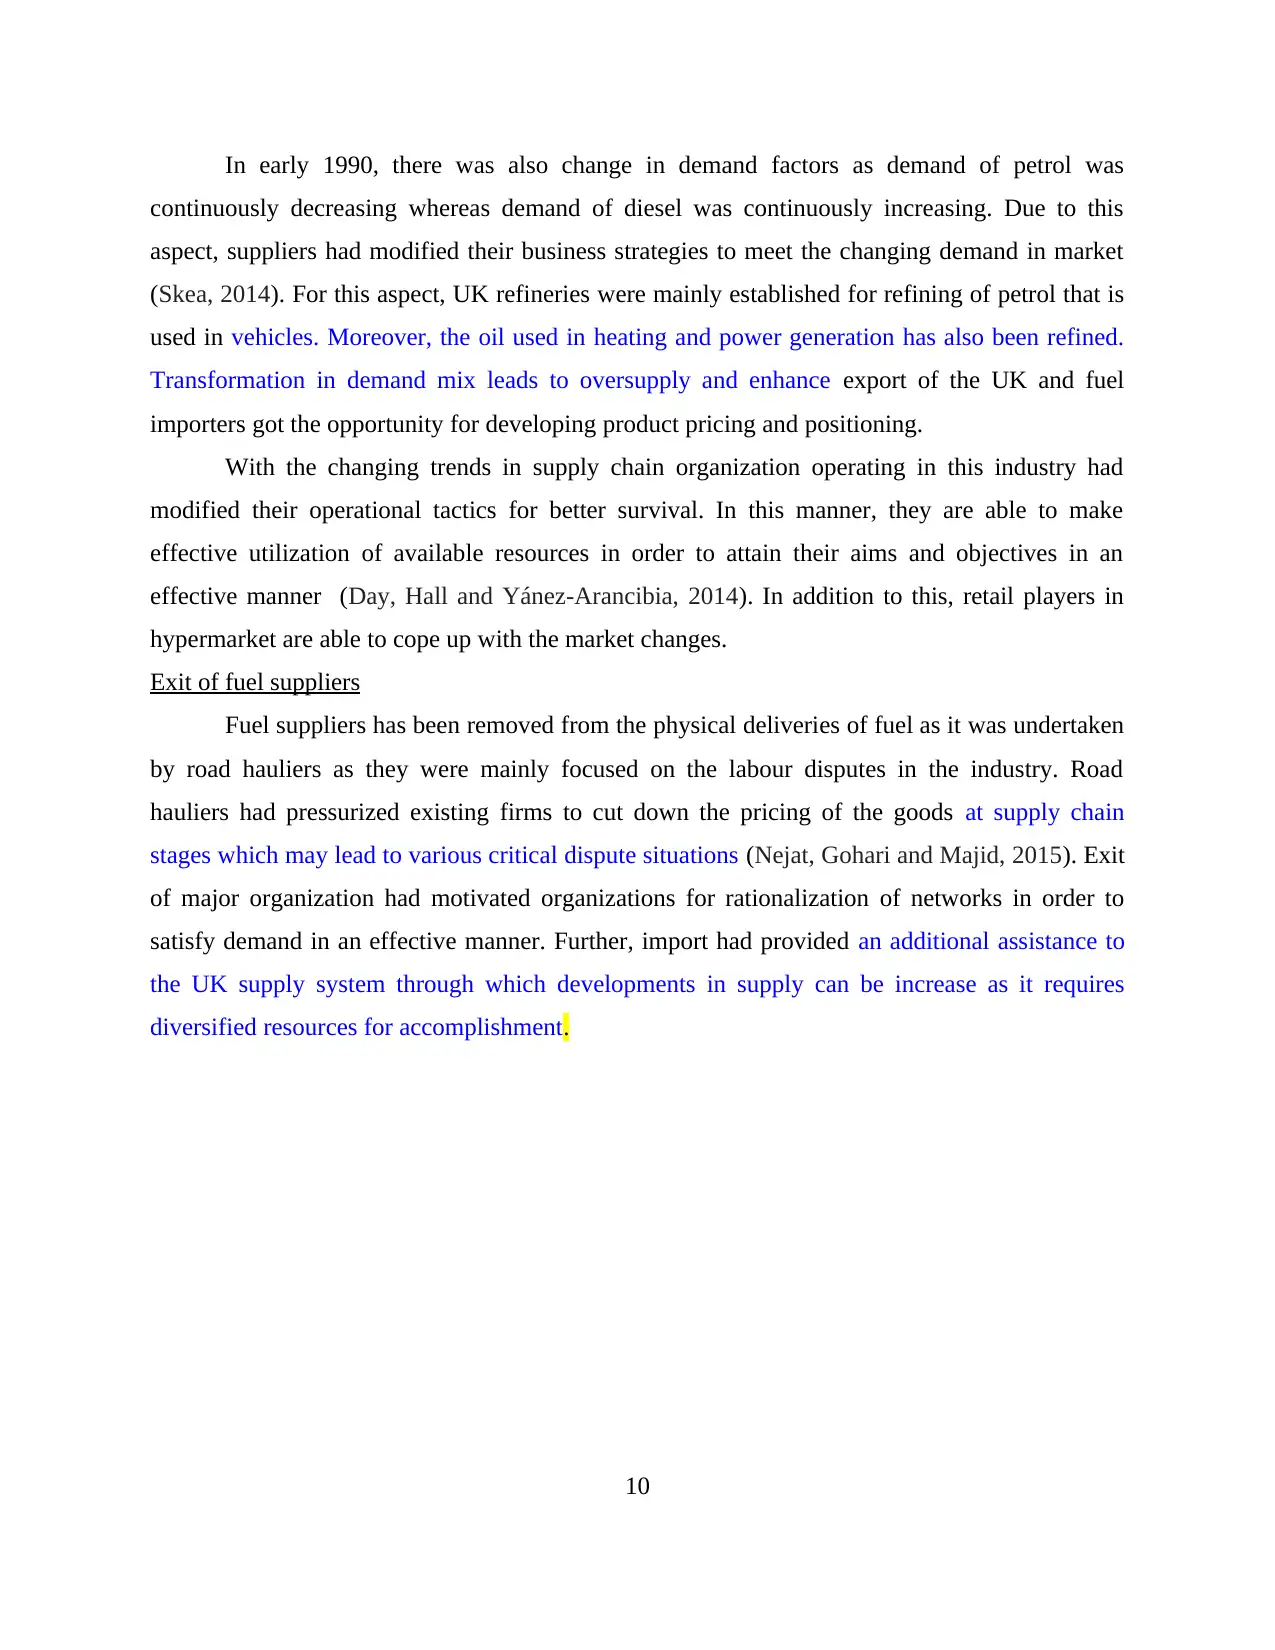
In accordance with the illustration 1 it can be noticed that there is continuous change in
the demand mix due to which modifications had taken place in supply chain. Further, due to
increase in economic crisis there was reduction in the total volume of fuel sold (Skea, 2014).
However, aspect of declining sales had been modified with the increasing efficiency in supply
chain. In addition to this, there was also modification in fuel mix as proportion of diesel had
significantly increased in comparison to petrol. Due to this aspect, organization operating in this
industry had to make changes in their operational strategies. Companies had exported petrol to
the other countries as there was oversupply of fuel in comparison to demand. With this approach,
they were to attain good profit margins and availed opportunity for market pricing and
positioning for further development.
11
Illustration 3: Volume of Petrol sales by different petrol stations
(Source: Retail market survey, 2012)
By the implementation of above described strategies, hypermarkets were able to make
reduction in their prices and they had replaced traditional PFS owned by independent dealers and
oil companies. Consequently, there was increase in their market share as hypermarkets were
continuously increasing and PFS had declined (Mitchell, 2012). In accordance with this
approach, retail companies started to focus on non-fuel retail options for increasing their
convenience expense and covering cost of operational functions. Several companies had
integrated their operational functions to operate in more effective manner. For this aspect,
example of Esso and Tesco express can be considered.
Upstream supply chain of petroleum market
Upstream supply chain of UK retail petroleum market was also modified along with the
changes in downstream supply chain. Major giants such as Shell and Chervon in this industry
had sold their shares to the retail network. As a consequence, there was change in ownership
structure. These changes were driven mainly by the organizations through seeking higher returns
in the upstream activities in comparison to relative downstream oil activities. Higher returns
from the upstream supply chain had influenced major oil companies to divest to make exit from
the market of downstream oil operations (UKCS Oil and Gas Production Projections, 2015). In
this aspect, number of expansion activities has been performed at different strategic locations
even refineries are not working properly. It is because; these locations are considered as a
potential driver to make investment in import terminals to enhance the volume of fuel imports.
Number of modifications has been made in the ownership structure due to sales aspects
of refining sector. It is because; changes in UK pipelines were limited in comparison to changes
in oil downstream supply chain. Organization such as BP oil UK, Wincanton, Turners had made
increase in efficiencies in deliveries by making use of logistical expertise.
CONCLUSION
In accordance with the present study, it can be concluded that retail petroleum market in
UK had undergone severe changes in last few decades. It is because, there is decrease in PFS due
to which there is change in fragmentation of fuel supply chain from the downstream and
upstream petroleum market. In addition to this, flexibility in supply chain has been increased in
case of domestic refinery supply distributions because of penetration of imported petroleum
products. By this approach, there is also improvement in security and energy resilience.
12
⊘ This is a preview!⊘
Do you want full access?
Subscribe today to unlock all pages.
Trusted by 1+ million students worldwide
1 out of 15
Related Documents


Your All-in-One AI-Powered Toolkit for Academic Success.
+13062052269
info@desklib.com
Available 24*7 on WhatsApp / Email
![[object Object]](/_next/static/media/star-bottom.7253800d.svg)
Unlock your academic potential
Copyright © 2020–2026 A2Z Services. All Rights Reserved. Developed and managed by ZUCOL.