UK Online Sales: Analyzing Trends, Correlation, and Regression

Verified

Added on  2023/01/05

|12
|617
|84
Report
AI Summary
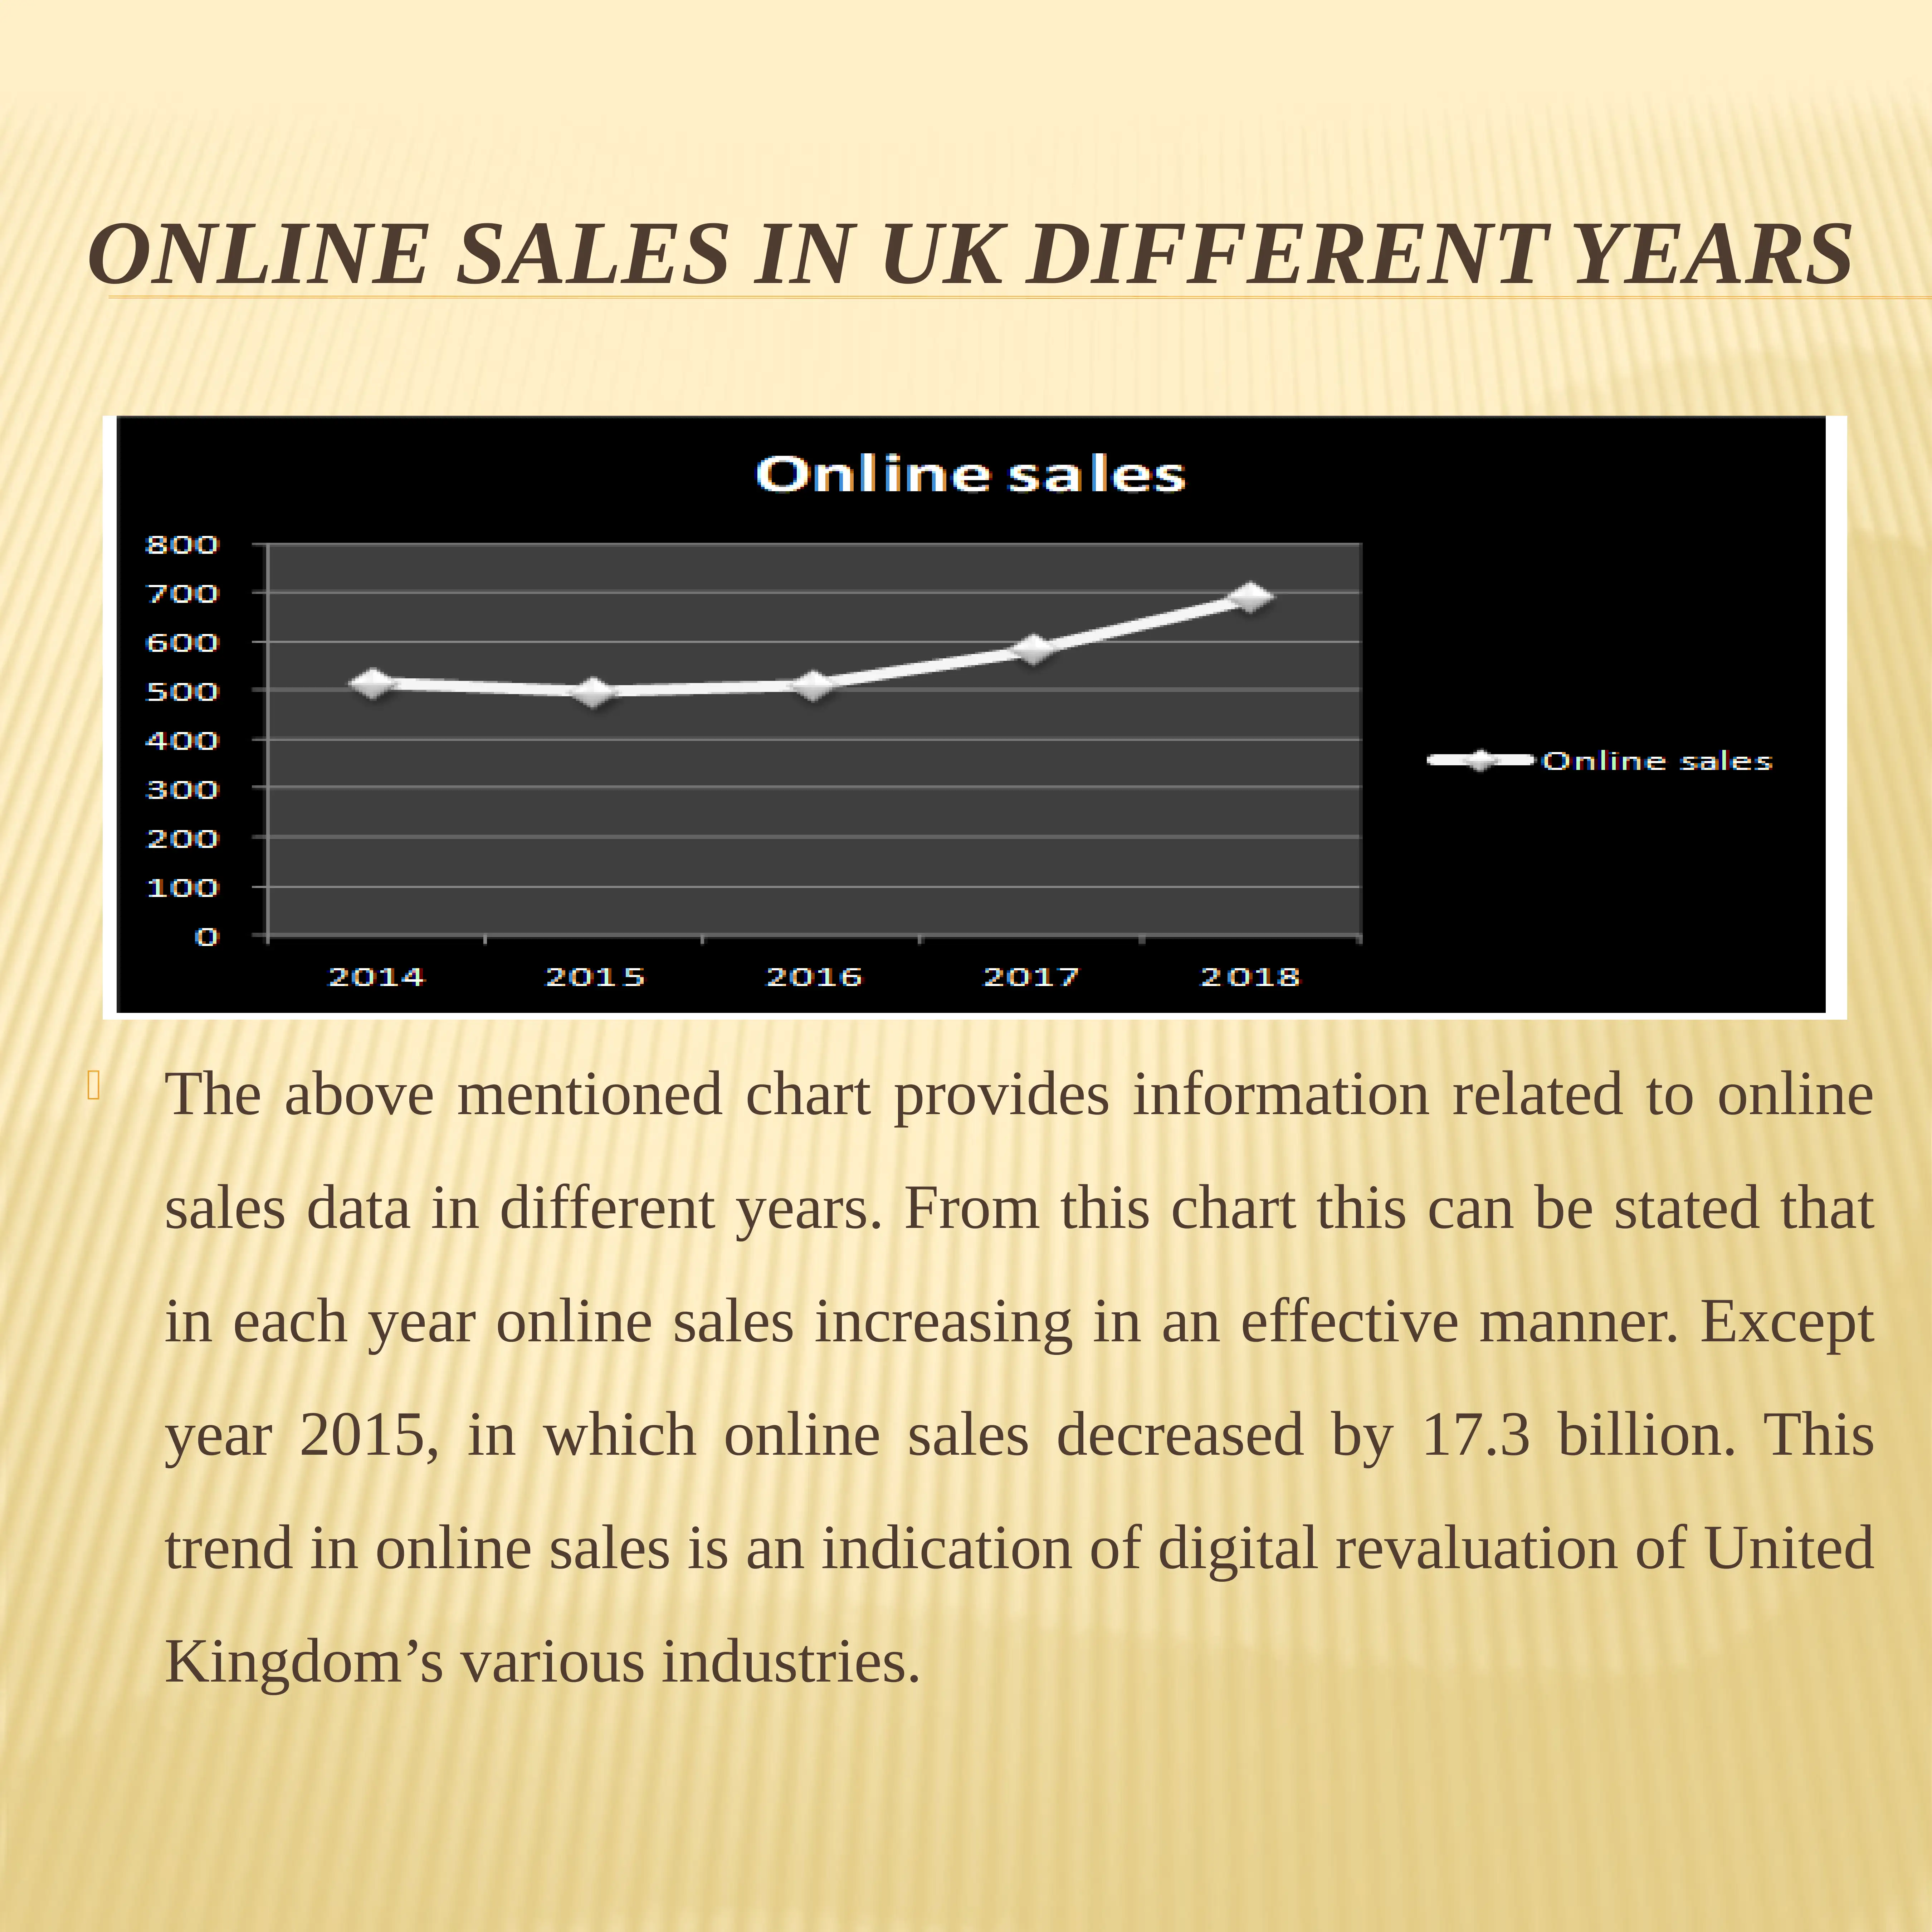
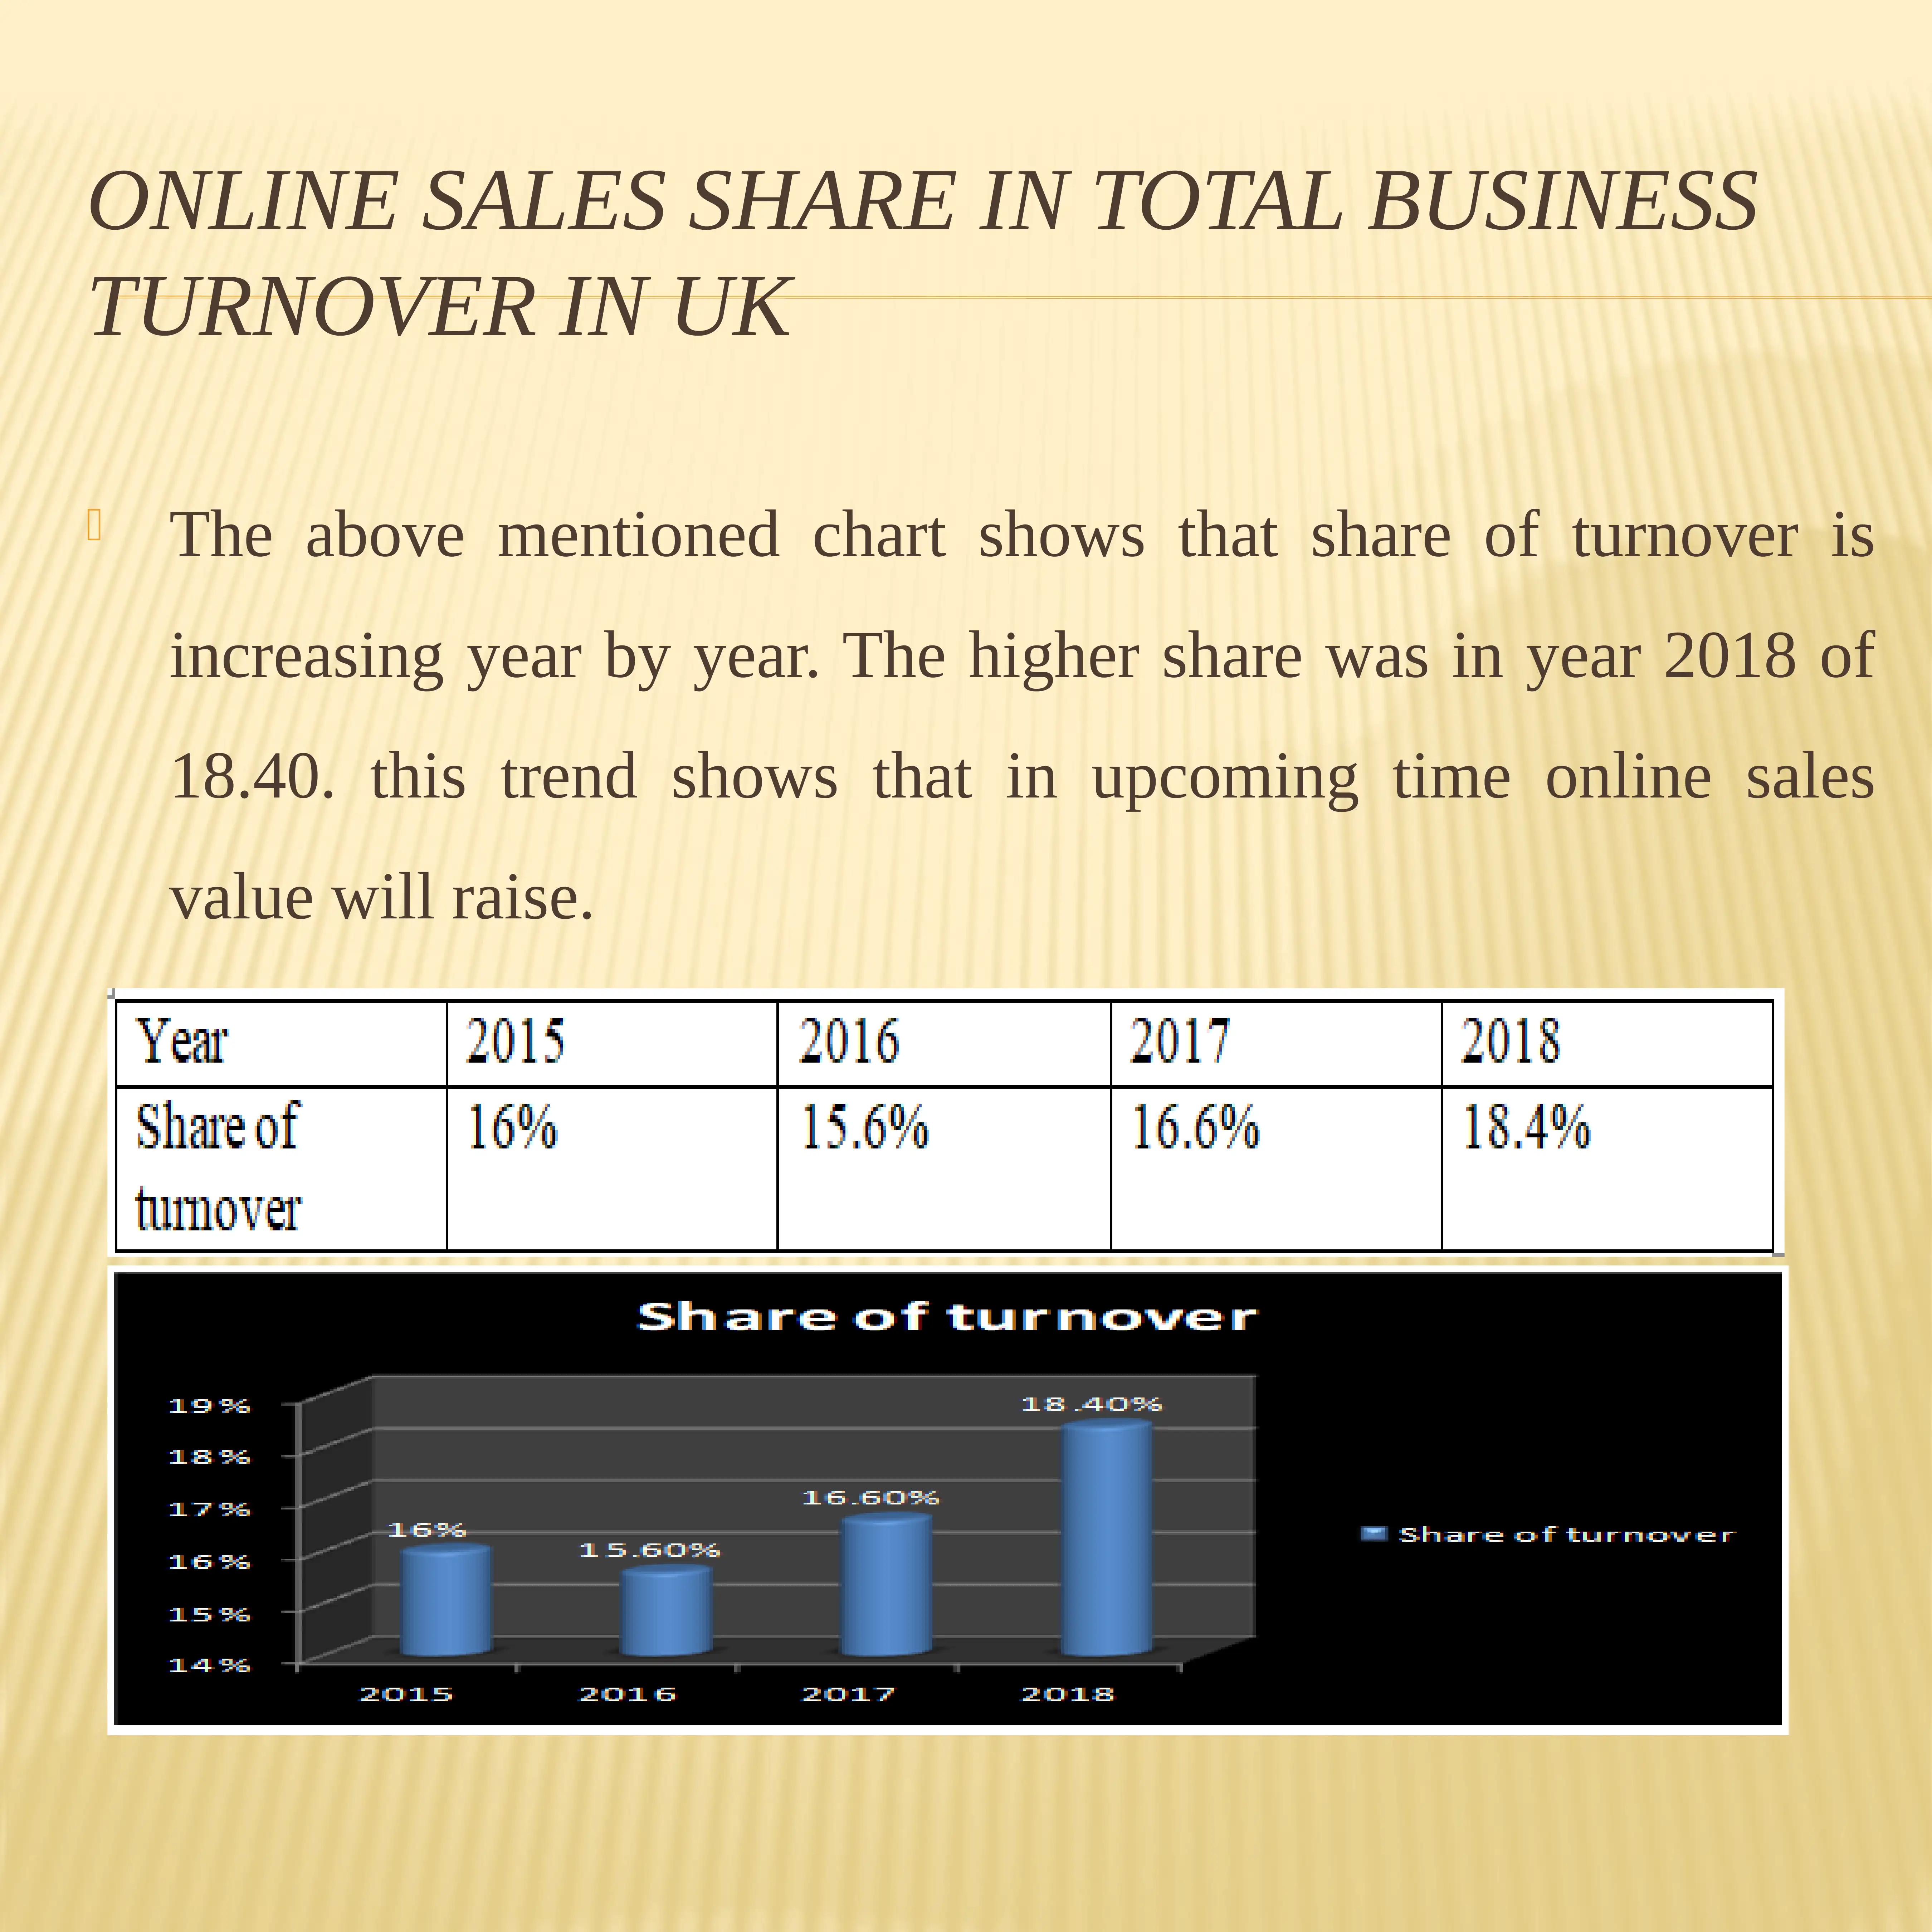
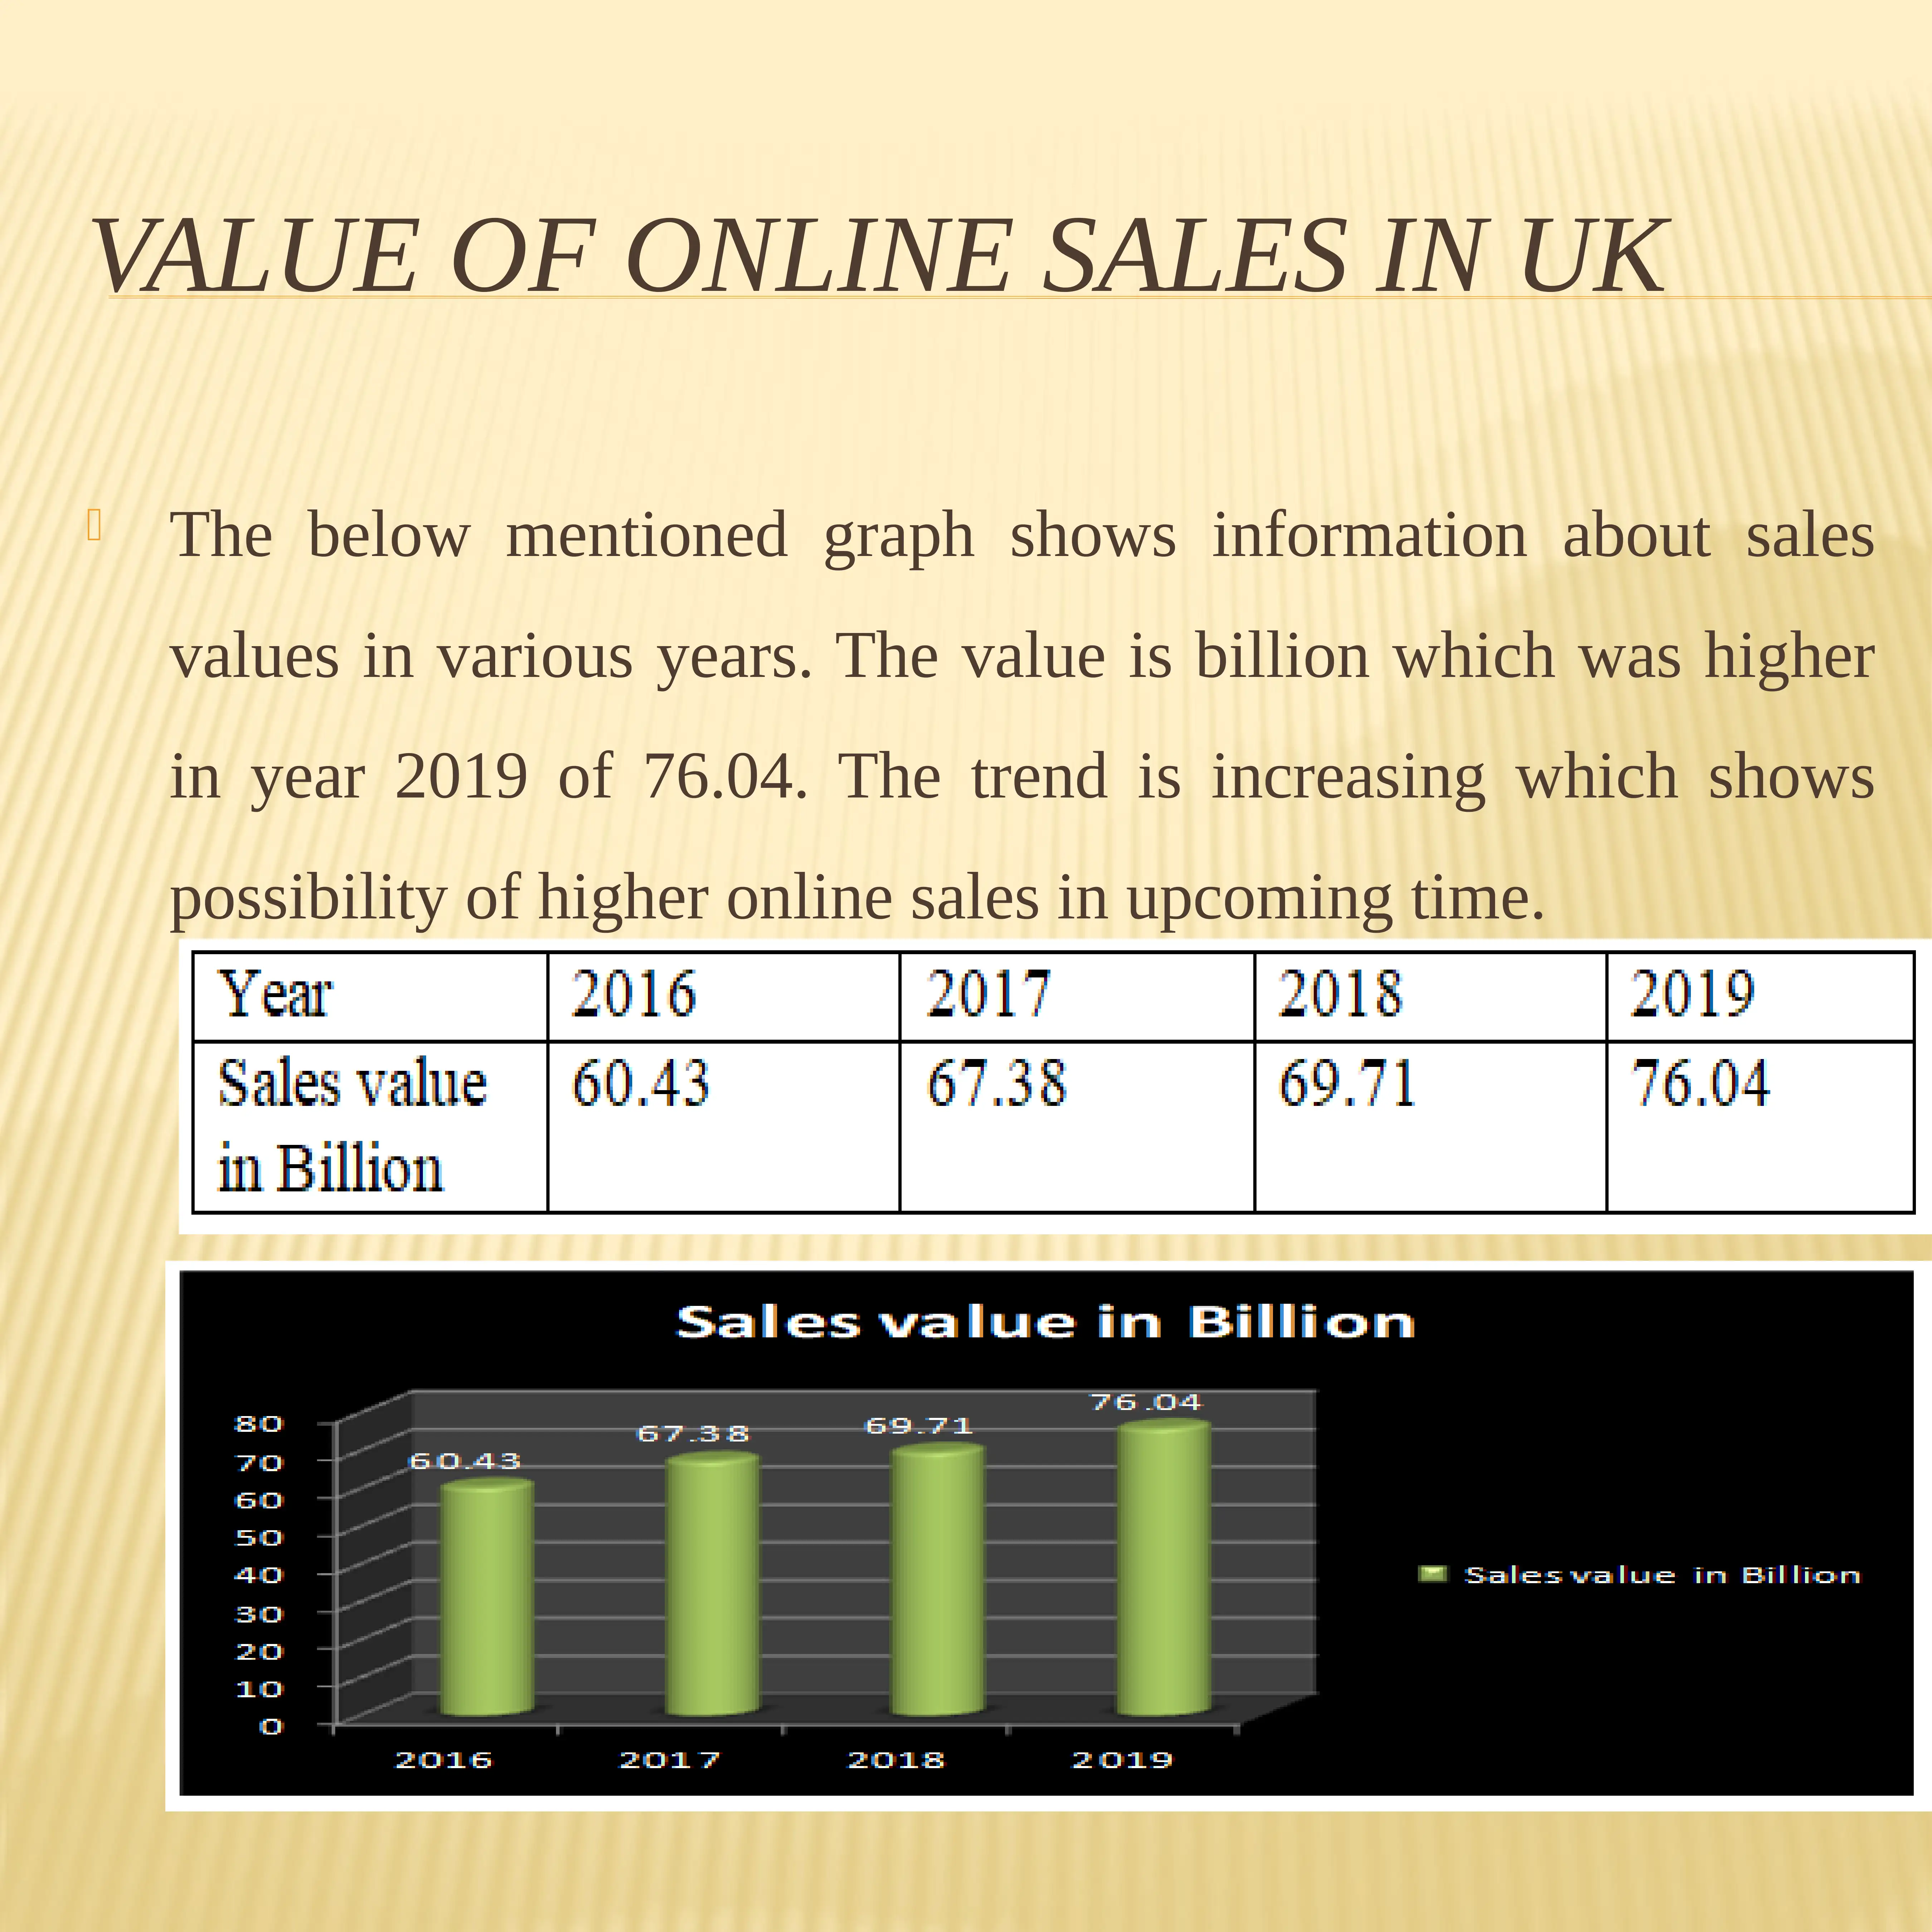
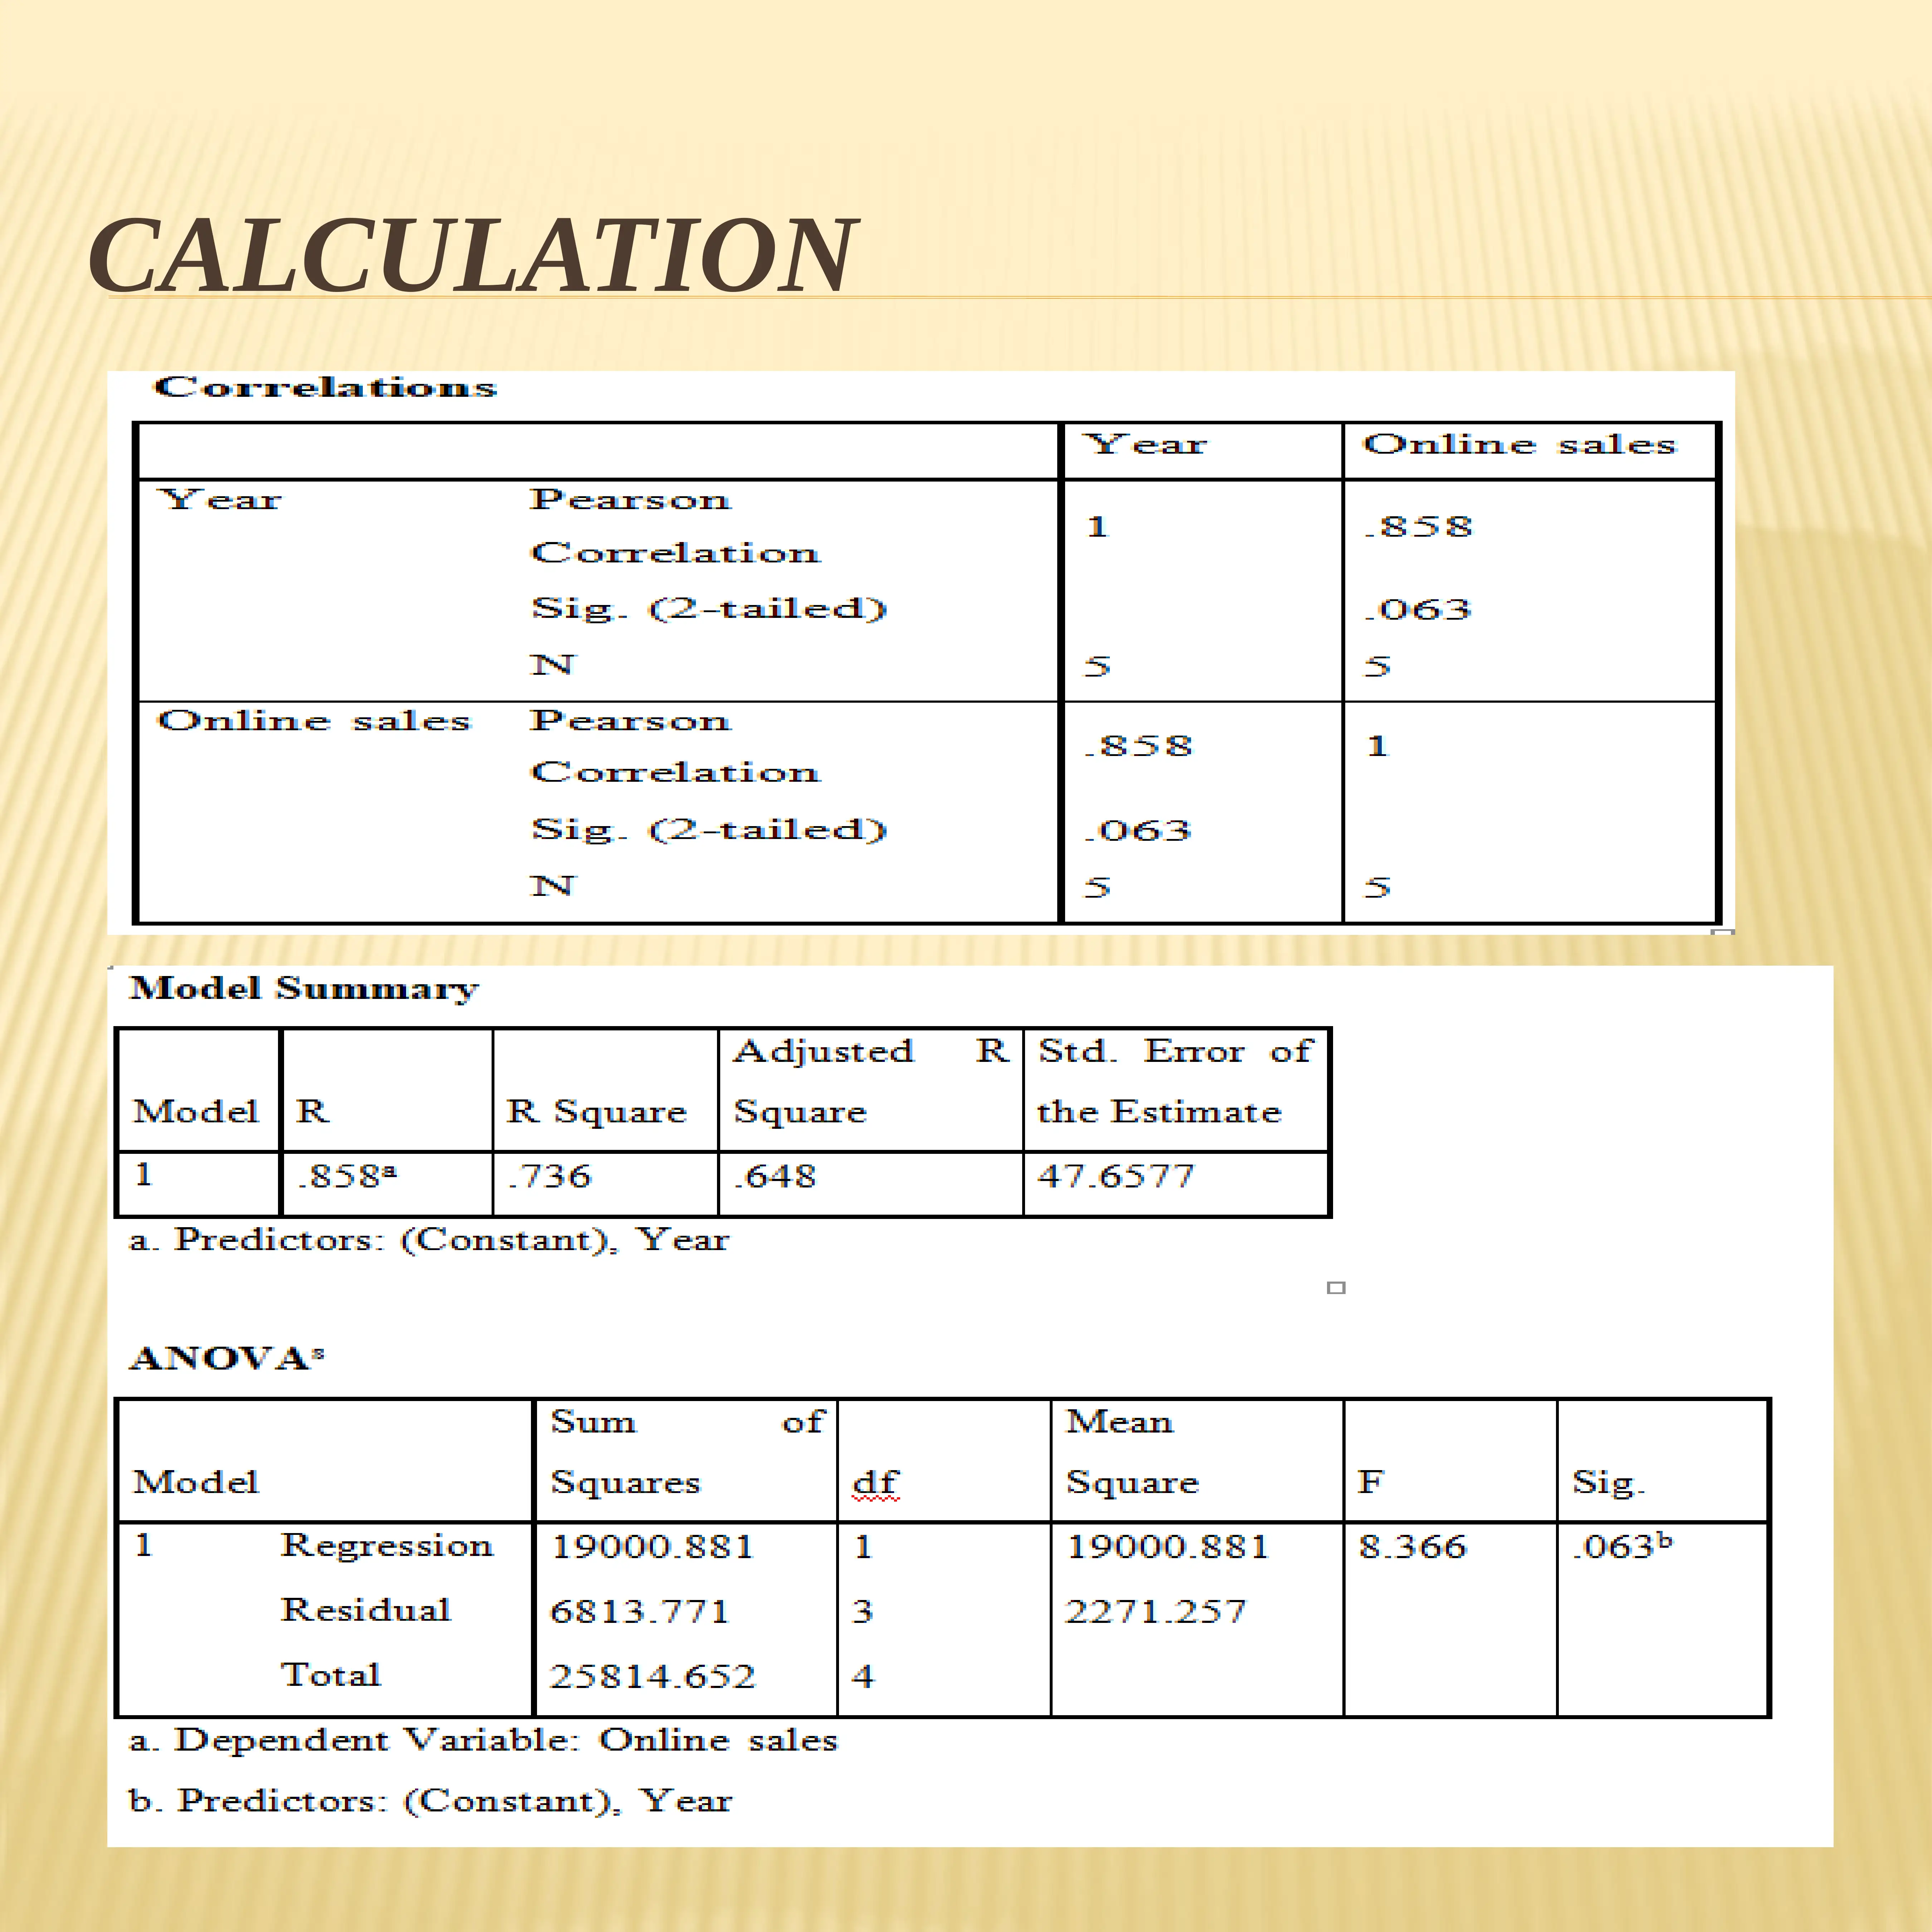
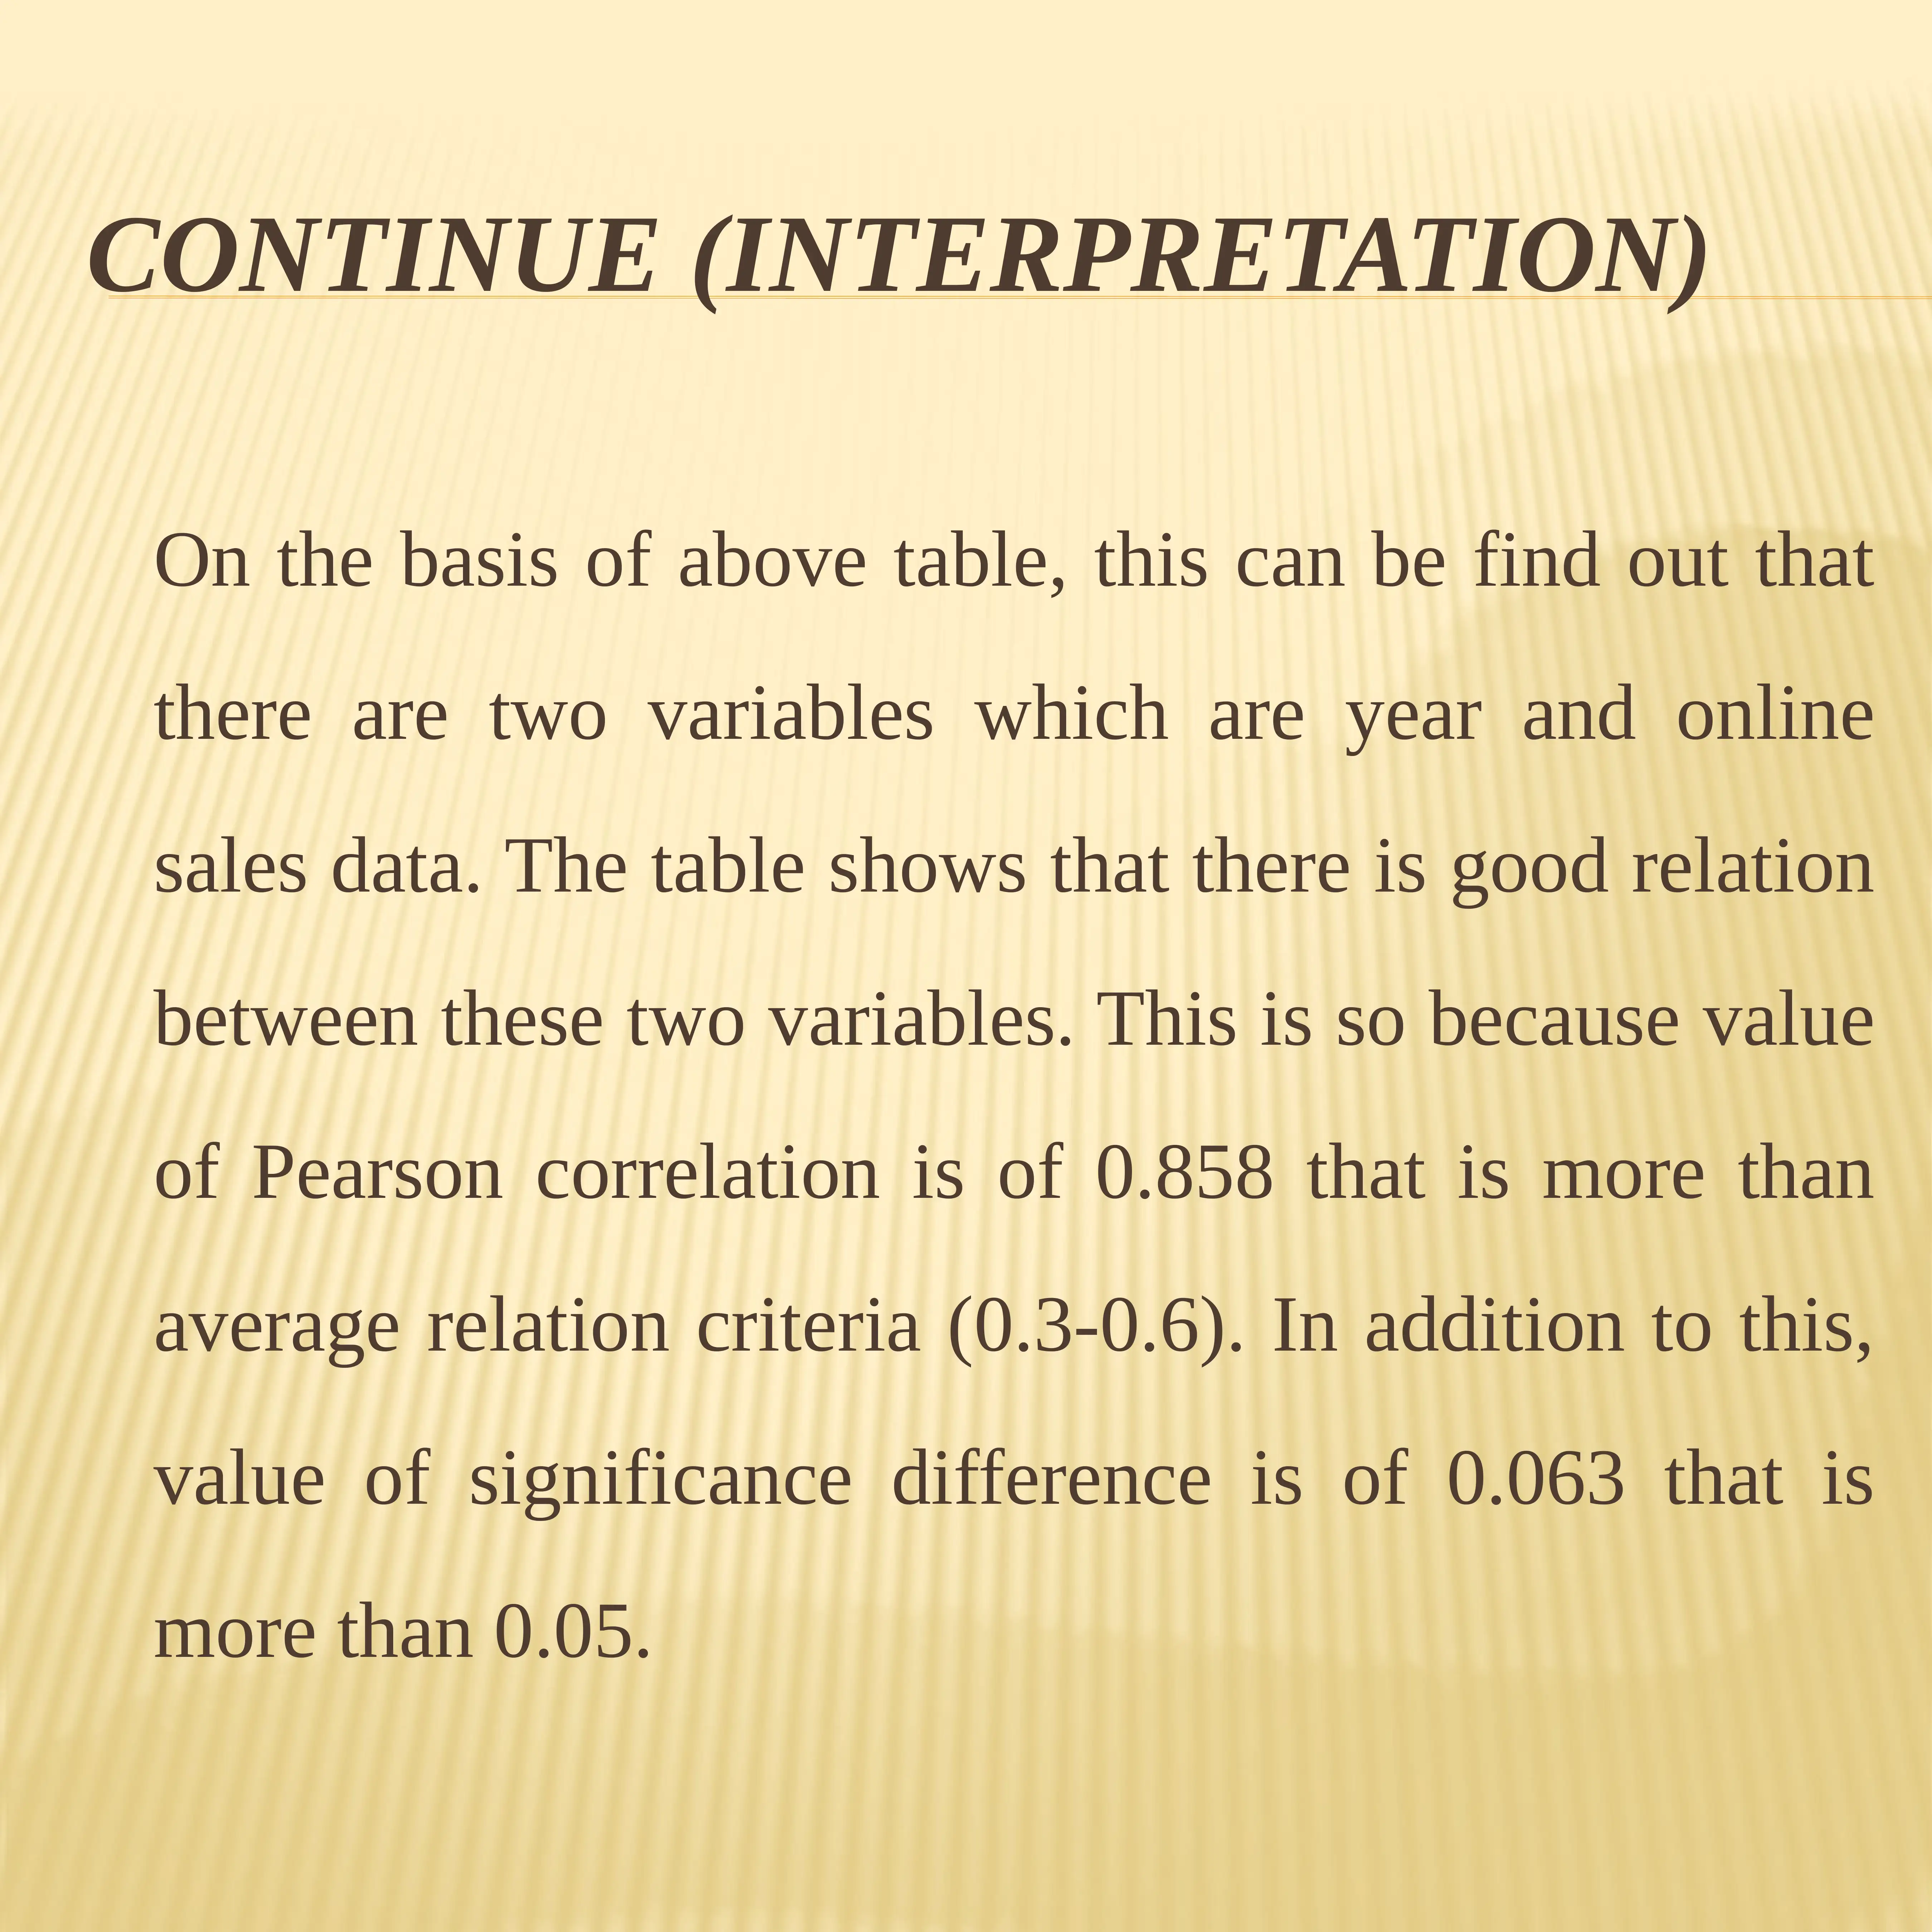
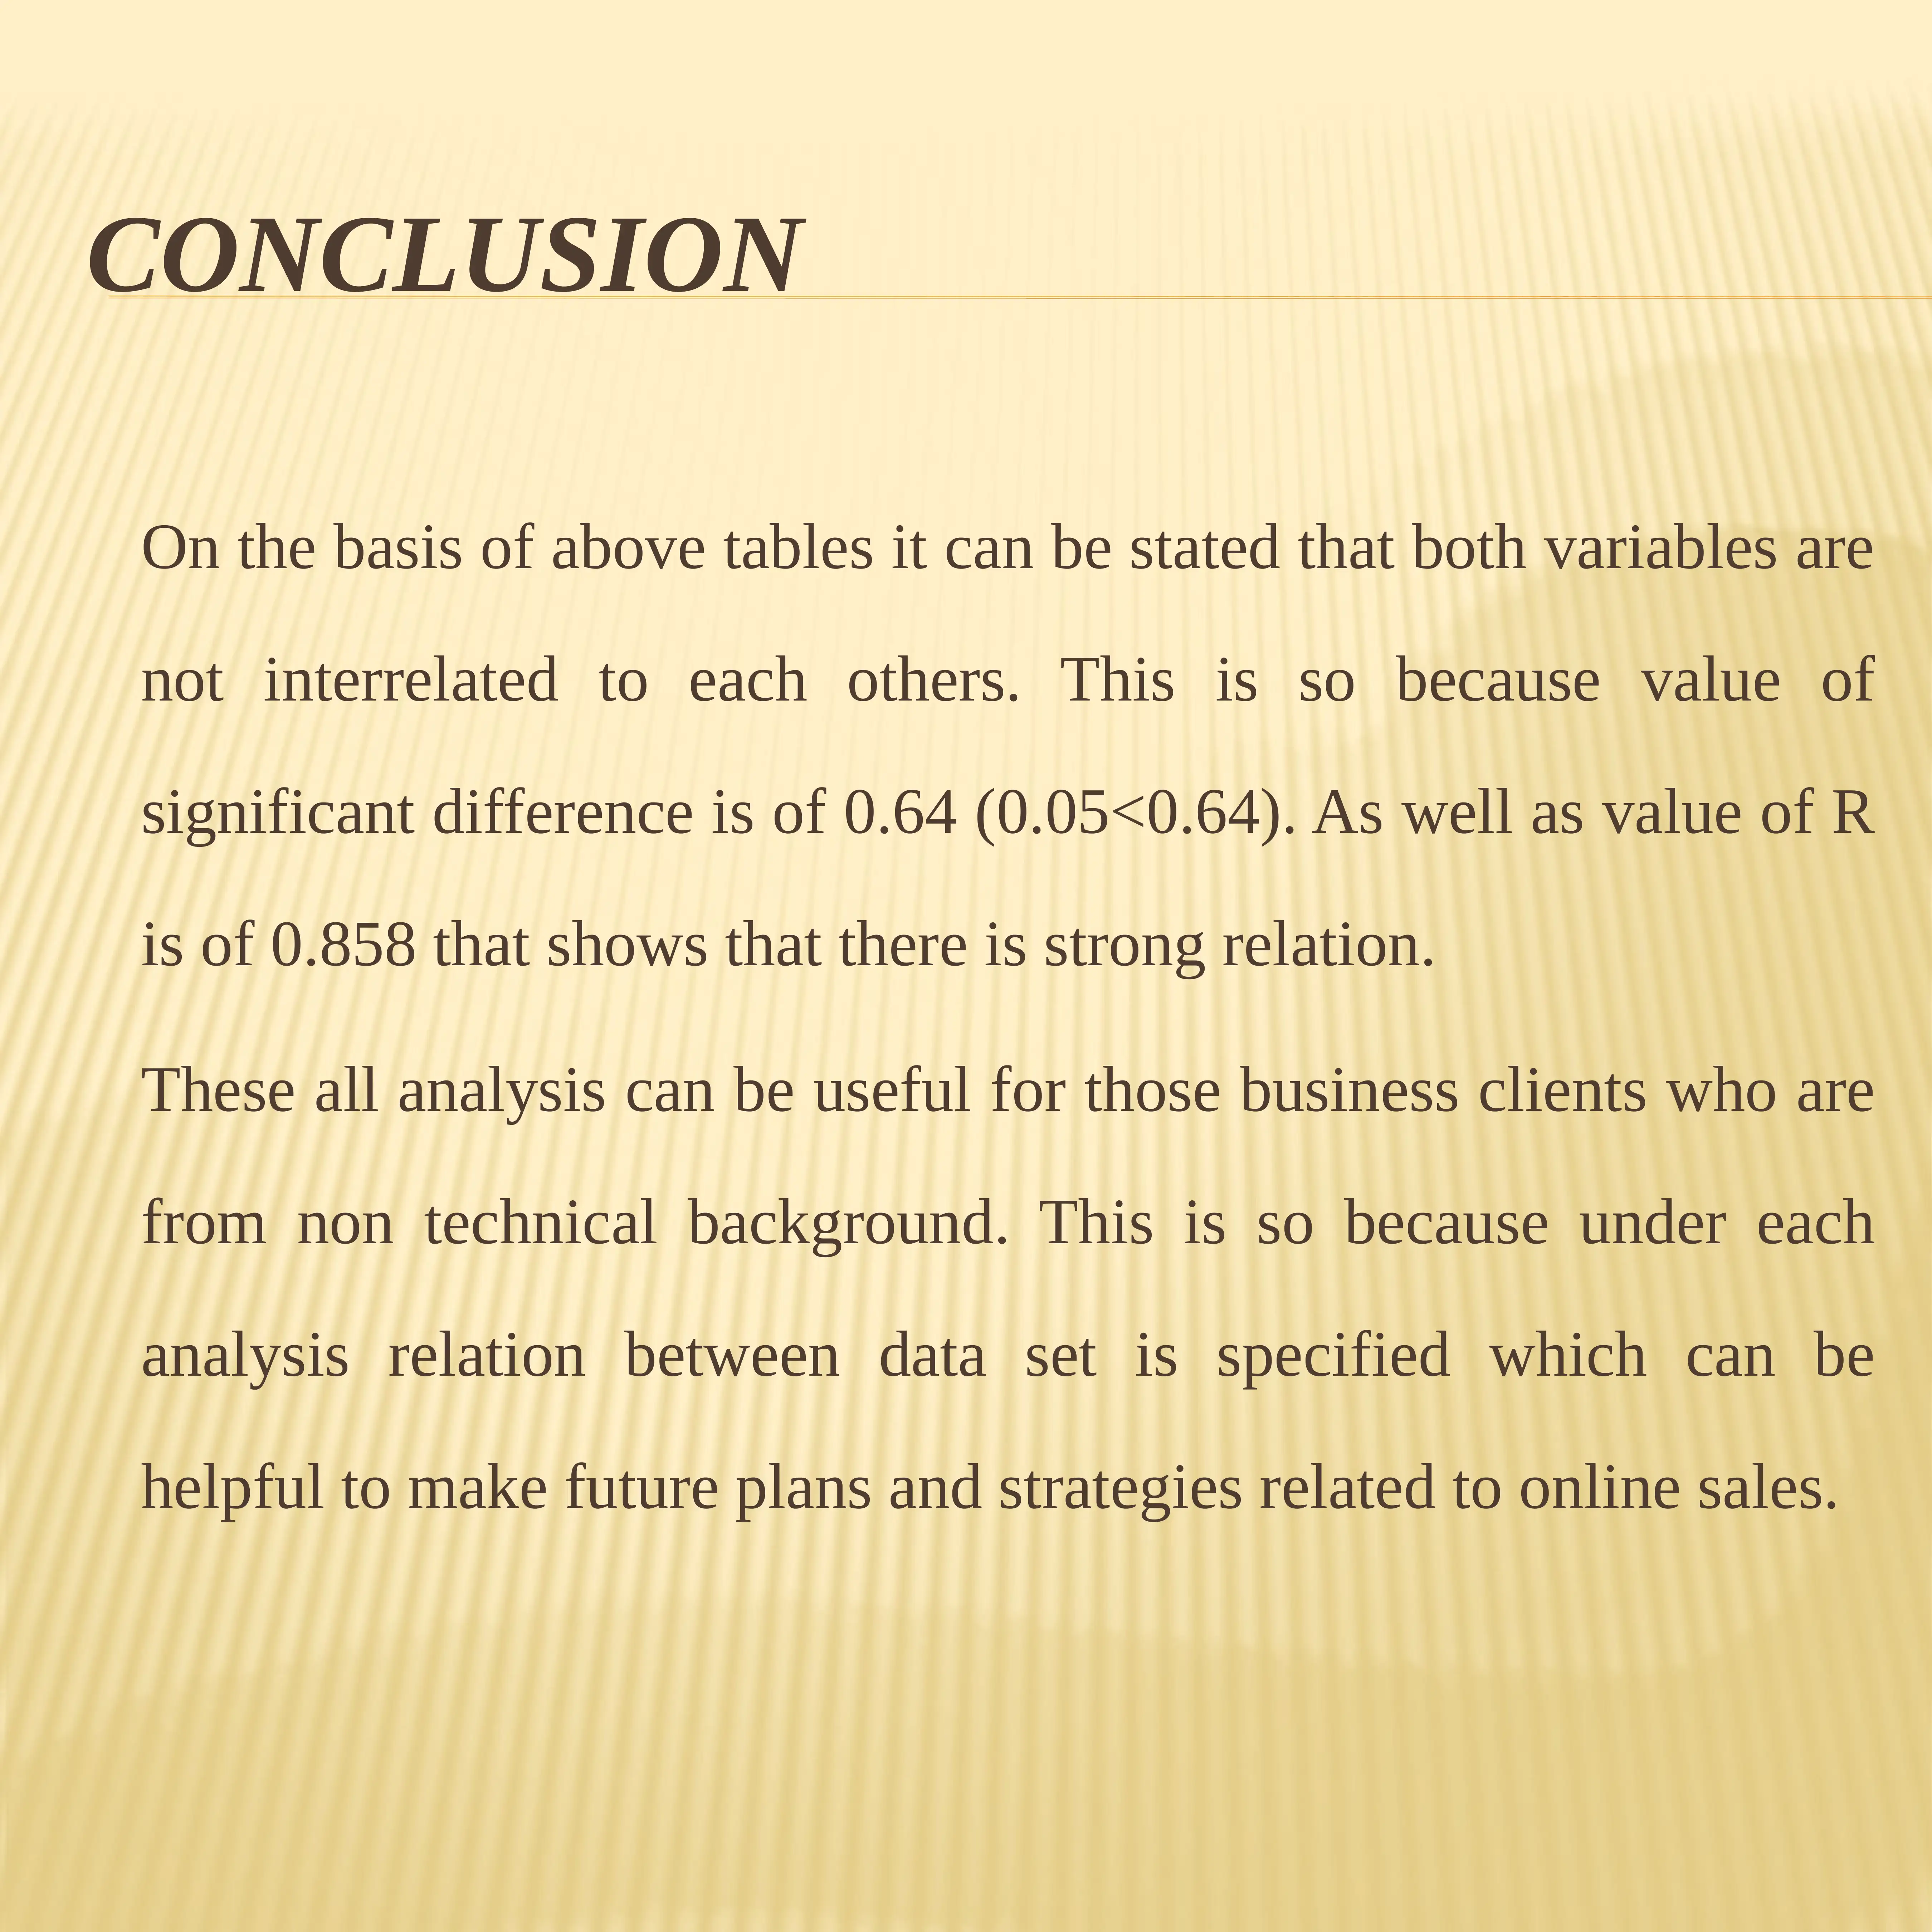
This report provides an analysis of the rise of online shopping in the United Kingdom, focusing on sales trends over recent years. It interprets data related to online sales in the UK, including the types of products with increased sales, using graphical presentations and analytical techniques like correlation and regression. The analysis reveals a general increasing trend in online sales and turnover share, with a notable dip in 2015. Correlation analysis indicates a strong relationship between the year and online sales data, suggesting the potential for continued growth in the online sales sector. The report concludes by highlighting the practical implications of these analyses for businesses, particularly those without a strong technical background, to inform their future plans and strategies related to online sales.
Document Page
Rise of online shopping in
the UK
tabler-icon-diamond-filled.svg

Secure Best Marks with AI Grader

Need help grading? Try our AI Grader for instant feedback on your assignments.
Document Page
SUBJECT KNOWLEDGE
The topic is related to way in which online
sales in UK has been raised. This analysis
has been done in accordance of data
available for online shopping.
Document Page
INTRODUCTION
The poster is based on selected topic that is about
online sales trend in United Kingdom. In last few years,
online selling in UK has been increased in an effective
manner. The rationale behind this is evolution of digital
era. The report contains detailed information about
analysis of different data by help of various techniques
such as regression, correlation etc. These techniques
provide an easy way to understand complex data set.
Document Page
DATA INTERPRETATION AND
INFORMATION ANALYSIS
The data about online sales in UK and
types of product whose sales has been
raised is interpreted in this part. It has been
done in accordance of graphical
presentation of data as well as correlation
and regressions are also find out.
tabler-icon-diamond-filled.svg

Secure Best Marks with AI Grader

Need help grading? Try our AI Grader for instant feedback on your assignments.
Document Page
ONLINE SALES IN UK DIFFERENT YEARS
The above mentioned chart provides information related to online
sales data in different years. From this chart this can be stated that
in each year online sales increasing in an effective manner. Except
year 2015, in which online sales decreased by 17.3 billion. This
trend in online sales is an indication of digital revaluation of United
Kingdom’s various industries.
Document Page
ONLINE SALES SHARE IN TOTAL BUSINESS
TURNOVER IN UK
The above mentioned chart shows that share of turnover is
increasing year by year. The higher share was in year 2018 of
18.40. this trend shows that in upcoming time online sales
value will raise.
Document Page
VALUE OF ONLINE SALES IN UK
The below mentioned graph shows information about sales
values in various years. The value is billion which was higher
in year 2019 of 76.04. The trend is increasing which shows
possibility of higher online sales in upcoming time.
tabler-icon-diamond-filled.svg

Paraphrase This Document

Need a fresh take? Get an instant paraphrase of this document with our AI Paraphraser
Document Page
CORRELATION AND REGRESSION
In order to determine association in different kinds of
data set, there are a range of methods and correlation is
one of them. Correlation is a mathematical measure
representing the degree to which two parameters are
sequentially connected (indicating that at a consistent
speed they shift around each other). It's a standard tool
without making a point about action and reaction for
explaining basic relationships.
Document Page
CALCULATION
Document Page
CONTINUE (INTERPRETATION)
On the basis of above table, this can be find out that
there are two variables which are year and online
sales data. The table shows that there is good relation
between these two variables. This is so because value
of Pearson correlation is of 0.858 that is more than
average relation criteria (0.3-0.6). In addition to this,
value of significance difference is of 0.063 that is
more than 0.05.
tabler-icon-diamond-filled.svg

Secure Best Marks with AI Grader

Need help grading? Try our AI Grader for instant feedback on your assignments.
Document Page
CONCLUSION
On the basis of above tables it can be stated that both variables are
not interrelated to each others. This is so because value of
significant difference is of 0.64 (0.05<0.64). As well as value of R
is of 0.858 that shows that there is strong relation.
These all analysis can be useful for those business clients who are
from non technical background. This is so because under each
analysis relation between data set is specified which can be
helpful to make future plans and strategies related to online sales.
Document Page
REFERENCE
About online sales data, 2019 [online]
available
through:<https://www.statista.com/statistic
s/282162/e-commerce-annual-sales-in-the-
united-kingdom-uk/https://
www.statista.com/statistics/282162/e-
commerce-annual-sales-in-the-united-
kingdom-uk/>
chevron_up_icon
1 out of 12
circle_padding
hide_on_mobile
zoom_out_icon
logo.png

Your All-in-One AI-Powered Toolkit for Academic Success.

Available 24*7 on WhatsApp / Email

[object Object]