Data Analysis of Marketing Campaign Impact on UK Sales Performance
VerifiedAdded on 2023/06/18
|11
|3375
|455
Report
AI Summary
This report investigates the impact of marketing campaigns on sales performance in the UK, employing Excel as the primary analytical tool. It highlights key trends and changes in data analysis, including augmented analytics, artificial intelligence, and augmented data management. The analysis involves cleaning and filtering data to focus specifically on UK sales in 2020, using graphs and tables to visualize the impact of marketing on various product categories like bracelets, rings, and necklaces. The findings indicate that while certain products like bracelets showed strong sales, others like accessories and hair bands underperformed. The report concludes with recommendations for Bangles, suggesting a focus on advanced technology and improved marketing strategies to boost the sales of underperforming products and capitalize on successful product lines, supported by comparative sales data from the UK, USA, and Japan. Desklib provides access to similar reports and solved assignments for students.

Data Driven Decision for Business
Paraphrase This Document
Need a fresh take? Get an instant paraphrase of this document with our AI Paraphraser
TABLE OF CONTENTS
a) Presenting the key changes and trend that reflect the importance of data analysis.................2
b) Describing the analytical approach to answer the business question......................................3
c) Analysis...................................................................................................................................3
i) describing the steps to clean the data.......................................................................................3
ii) Presenting relevant tables and graphs to highlight the key points..........................................4
d) Conclusion and next steps.......................................................................................................5
i) Conclusion and recommendations...........................................................................................5
ii) Presenting the effectiveness of using econometric analysis...................................................7
REFERENCES................................................................................................................................9
a) Presenting the key changes and trend that reflect the importance of data analysis
The role of data and analytics in a digital transformation is now become more strategic
and due to increasing volume and complexity of a data, most of organizations are looking for the
changes that helps improve the sales as well as productivity. There are different key changes and
trends identified within Bangles which are as mentioned below:
Augmented Analytics: It is defined as machine learning and AI assisted data preparation
which reflected that how a business user and analyst can explore as well as analyses data. It has
been explained that due to increase in data collection volume and complexity, decision makers
can easily access to an abundance of data (Danielson and Lasorsa, 2020). That is why, it has
been analyzed that due to larger and more-varied dataset also lead to bring challenges, and also
difficult to manage using manual approaches.
Artificial intelligence: With the help of effective AI, company can analyze its strength
and weaknesses by predicting its behavior and determine the errors as well. It is a new trend that
always helps businesses like Bangles to determine the exact answer and ways to enhance its
sales. Further, it also helps to build corporate trust, compliance with different global regulatory
bodies in order to manage brand reputation. Therefore, explainable AI always enables a better
adoption of AI by raise transparency as well as trustworthiness. That is why, it can be stated that
with the help of this trend in data analysis, company may easily improve the results.
Augmented Data Management: The secondary research shows that in each day around
2.3 trillion gigabytes of a data creates along with many trusted as well as untrusted data sources.
As there are many applications who possesses strong analytics capabilities that assists a business
to generate the best outcome (Huang and et.al., 2020). These processes are automating manual
task that helps to collect the information and then apply the same into premises that assist to
derive best outcomes.
Overall, it has been identified that there are many changes and trends identified regarding
data analysis and this further adds values to the companies like Bangles. However, it has been
further evaluated that with the help of big data, organizations may easily enhance the overall
performance of a company easily.
⊘ This is a preview!⊘
Do you want full access?
Subscribe today to unlock all pages.
Trusted by 1+ million students worldwide
b) Describing the analytical approach to answer the business question
The defined business question of a study i.e. Did the marketing campaign have a positive
impact on sales performance in the UK? With regard to the same, company uses only excel as an
analytical approach in order to generate the best outcomes. It is tool which is not only used to
solve complex data but it helps to explore the data for better insights. That is why, in the present
data, it can be stated that with the help of chosen excel approach, scholar can have examined the
data and conclude the answers as well (Alkhouli and et.al., 2020). Along with this, the main
rationale behind choosing the analytical approach is such that it will organize the raw data into a
readable format that assists to makes it easier to extract actionable insights. As the given data is
complex and large, that is why, there is a need to use such analytical approach that allow to
customize fields and functions in order to solve the issues.
In addition to this, it has been further evaluated that with the help of excel as an analytical
approach, investigator may filter the data which is relevant for the study. As the data contain
information of three countries whereas the research question belongs to UK only. Thus, to select
relevant data, different functions from excel has been used in order to derive best outcomes.
Apart from this, this analytical approach also assists to transform and clean the data. Moreover, it
is also considering that excel helps to easily visualize the data in the form of charts and graphs.
This helps the reader to interpret the things in more effective manner and derive the results as
well (Dudel and et.al., 2020). Overall, it can be stated that through chosen analytical approach,
scholar can identify the trend and also brings valid conclusion that helps companies like Bangles
to make effective decision for its future growth. Hence, opting excel as an analytical approach
over the other methods will be more beneficial in order to generate the best outcomes and
collapse the relevant data from large one.
c) Analysis
i) describing the steps to clean the data
In order to clean the data, excel as an analytical approach has been used where different
functions can be used in order to generate the best outcomes and highlight key points that are
beneficial for the business. The steps are as mentioned below:
Select the data which investigator going to be analyzed.
Paraphrase This Document
Need a fresh take? Get an instant paraphrase of this document with our AI Paraphraser
As per the selected data, apply the option filter where only UK has been selected under
country and 2020 year with 5th month. It is so because the business questions also want
to analyze the data of UK only.
After applying the filter, extract the data into new sheet in order to draw relevant charts
and graphs for visualizing the data.
After extracting, select the data and click on insert button, then select the type of graph
which helps to present the data in accurate manner. Here, bargraph has been selected in
order to compared the sales value and volume within a specific month.
After designing the relevant graph, label the data in order to clearly determine the shaded
part belongs to which data and then proceed towards an interpretation.
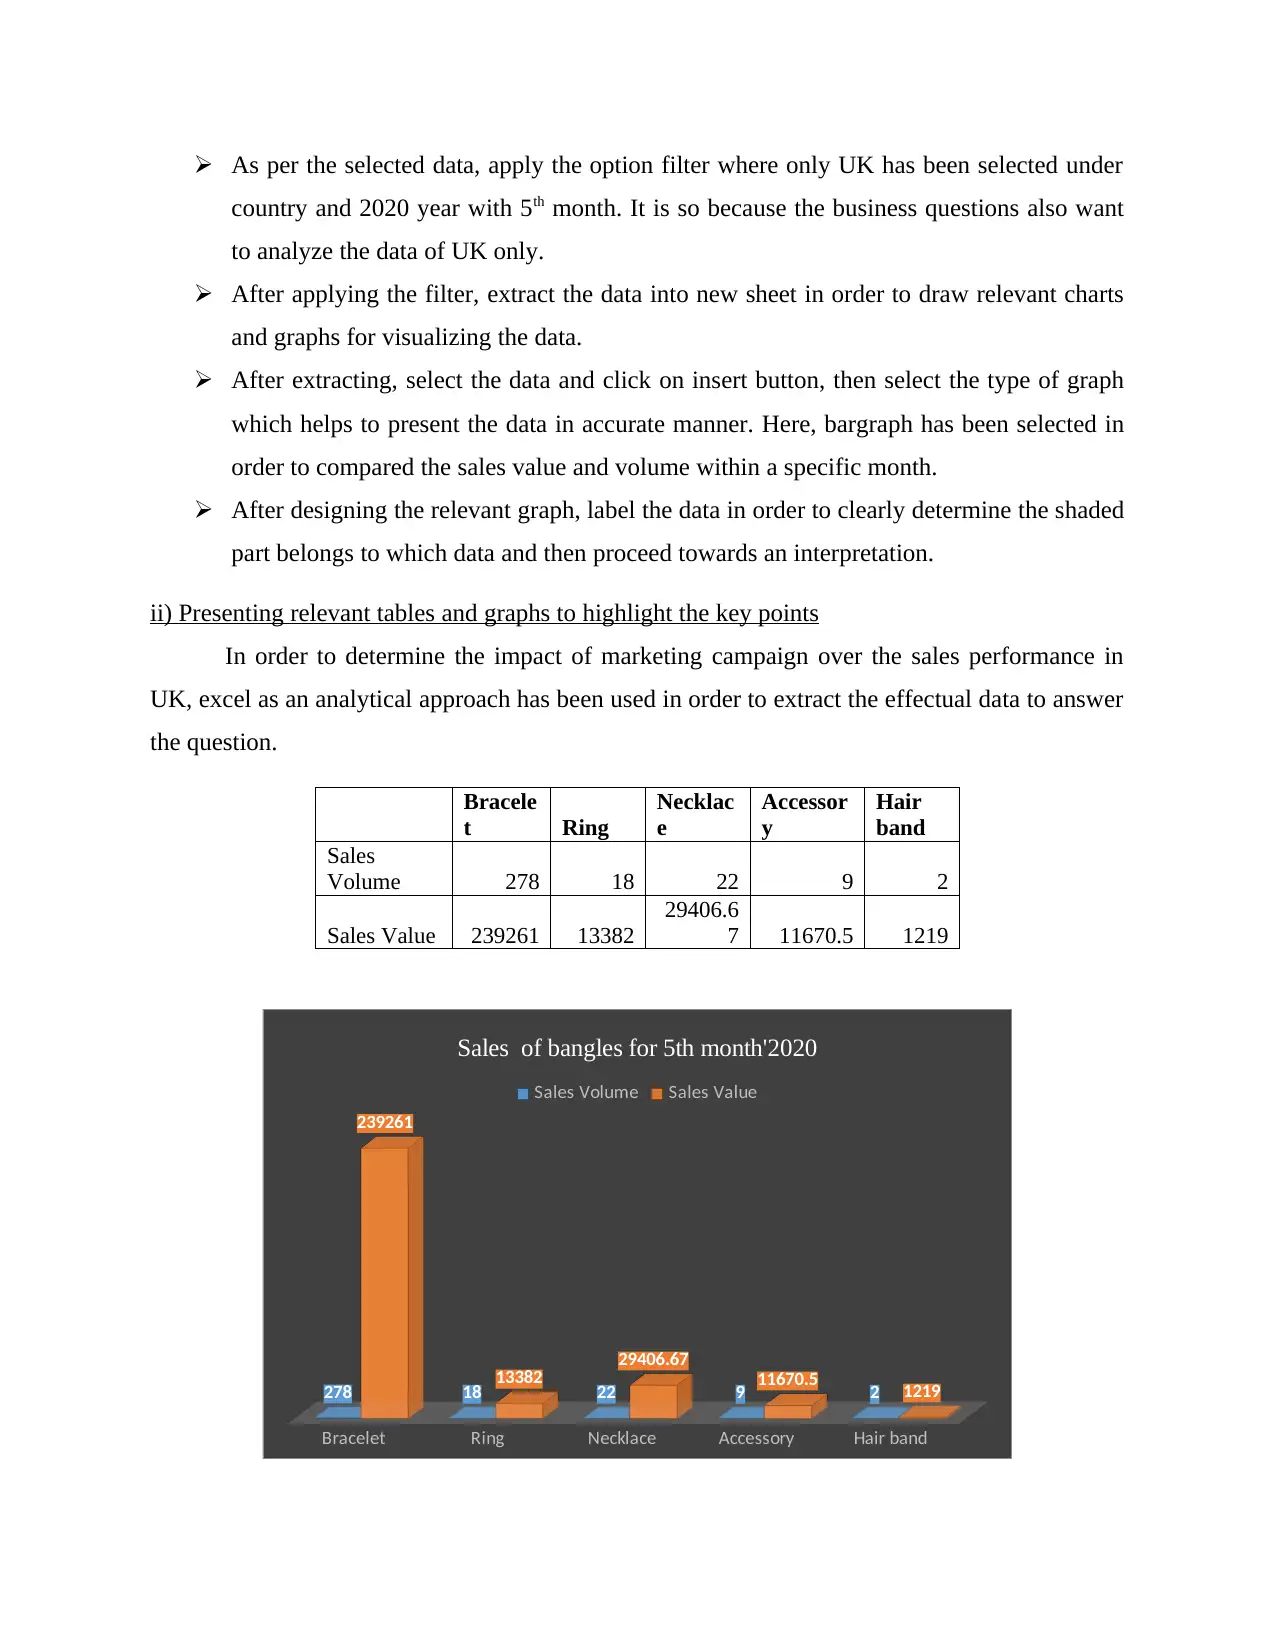
ii) Presenting relevant tables and graphs to highlight the key points
In order to determine the impact of marketing campaign over the sales performance in
UK, excel as an analytical approach has been used in order to extract the effectual data to answer
the question.
Bracele
t Ring
Necklac
e
Accessor
y
Hair
band
Sales
Volume 278 18 22 9 2
Sales Value 239261 13382
29406.6
7 11670.5 1219
Bracelet Ring Necklace Accessory Hair band
278 18 22 9 2
239261
13382 29406.67
11670.5 1219
Sales of bangles for 5th month'2020
Sales Volume Sales Value
country and 2020 year with 5th month. It is so because the business questions also want
to analyze the data of UK only.
After applying the filter, extract the data into new sheet in order to draw relevant charts
and graphs for visualizing the data.
After extracting, select the data and click on insert button, then select the type of graph
which helps to present the data in accurate manner. Here, bargraph has been selected in
order to compared the sales value and volume within a specific month.
After designing the relevant graph, label the data in order to clearly determine the shaded
part belongs to which data and then proceed towards an interpretation.
ii) Presenting relevant tables and graphs to highlight the key points
In order to determine the impact of marketing campaign over the sales performance in
UK, excel as an analytical approach has been used in order to extract the effectual data to answer
the question.
Bracele
t Ring
Necklac
e
Accessor
y
Hair
band
Sales
Volume 278 18 22 9 2
Sales Value 239261 13382
29406.6
7 11670.5 1219
Bracelet Ring Necklace Accessory Hair band
278 18 22 9 2
239261
13382 29406.67
11670.5 1219
Sales of bangles for 5th month'2020
Sales Volume Sales Value
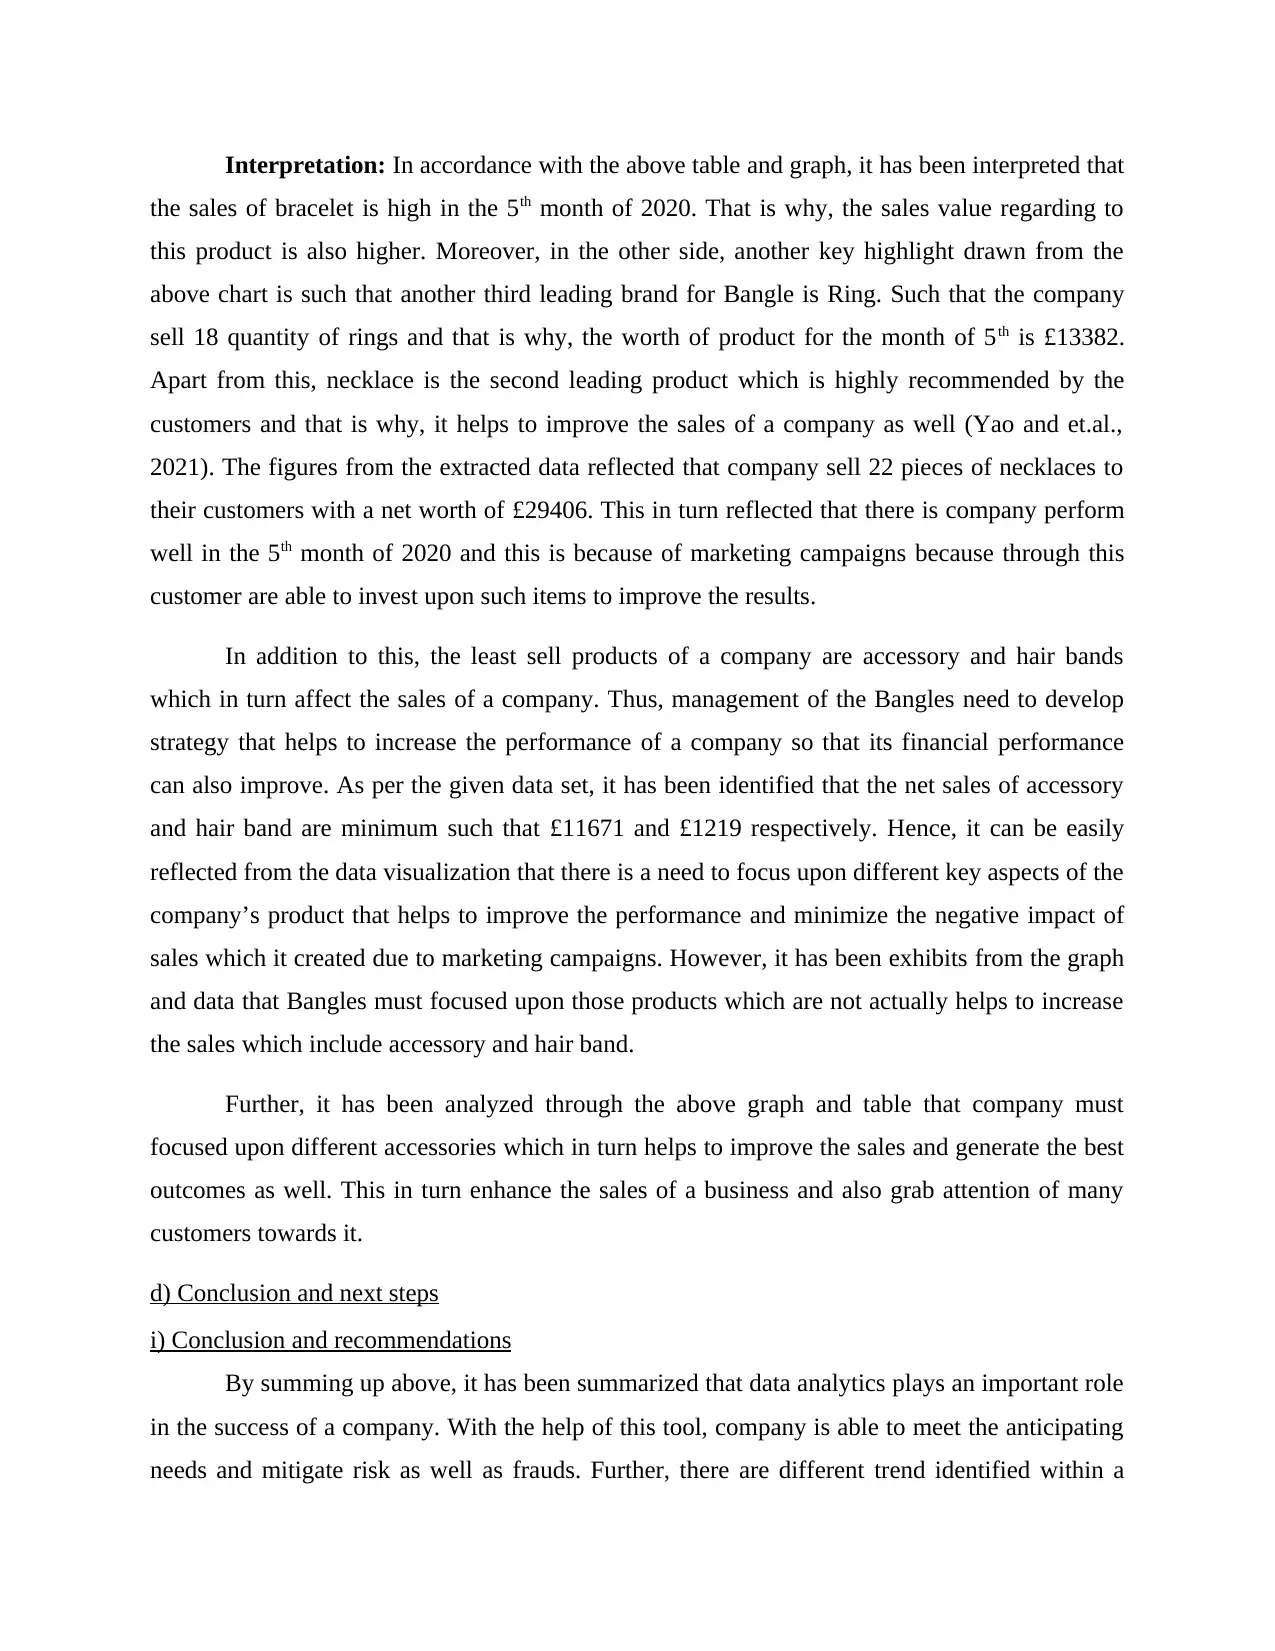
Interpretation: In accordance with the above table and graph, it has been interpreted that
the sales of bracelet is high in the 5th month of 2020. That is why, the sales value regarding to
this product is also higher. Moreover, in the other side, another key highlight drawn from the
above chart is such that another third leading brand for Bangle is Ring. Such that the company
sell 18 quantity of rings and that is why, the worth of product for the month of 5th is £13382.
Apart from this, necklace is the second leading product which is highly recommended by the
customers and that is why, it helps to improve the sales of a company as well (Yao and et.al.,
2021). The figures from the extracted data reflected that company sell 22 pieces of necklaces to
their customers with a net worth of £29406. This in turn reflected that there is company perform
well in the 5th month of 2020 and this is because of marketing campaigns because through this
customer are able to invest upon such items to improve the results.
In addition to this, the least sell products of a company are accessory and hair bands
which in turn affect the sales of a company. Thus, management of the Bangles need to develop
strategy that helps to increase the performance of a company so that its financial performance
can also improve. As per the given data set, it has been identified that the net sales of accessory
and hair band are minimum such that £11671 and £1219 respectively. Hence, it can be easily
reflected from the data visualization that there is a need to focus upon different key aspects of the
company’s product that helps to improve the performance and minimize the negative impact of
sales which it created due to marketing campaigns. However, it has been exhibits from the graph
and data that Bangles must focused upon those products which are not actually helps to increase
the sales which include accessory and hair band.
Further, it has been analyzed through the above graph and table that company must
focused upon different accessories which in turn helps to improve the sales and generate the best
outcomes as well. This in turn enhance the sales of a business and also grab attention of many
customers towards it.
d) Conclusion and next steps
i) Conclusion and recommendations
By summing up above, it has been summarized that data analytics plays an important role
in the success of a company. With the help of this tool, company is able to meet the anticipating
needs and mitigate risk as well as frauds. Further, there are different trend identified within a
⊘ This is a preview!⊘
Do you want full access?
Subscribe today to unlock all pages.
Trusted by 1+ million students worldwide
report which shows that company has to follow the same in order to improve the overall
performance of a company. These trend includes augmented analytics, augmented data
management, artificial intelligence etc. Hence, with the help of these tools and techniques,
company is able to improve the overall performance and solve the complex data in order to
derive the valid outcomes.
Further, the study also concluded that the chosen analytical approach for this report is
excel where, complex data can be filtered in order to generate the best outcomes. That is why,
from range of different techniques, this method is far beneficial for Bangles in order to explore
or implement the things effectively. Moreover, appropriate steps has been used by the scholar in
order to derive the results and extract the relevant data so that researcher can answer the business
question as well. Besides this, it has been identified from the above report that Bangles sell its
products and the amount generated from those will be helpful to create an effective brand image
at global level. Thus, the products involved bracelet, ring and necklace however it has been
critically evaluated that there are further products which are not create any positive impact over
the financial performance of a company which are accessory and hair band. That is why, it is
suggested to the company to focus upon its marketing strategy in order to generate the best
outcomes and improve the sales performance as well.
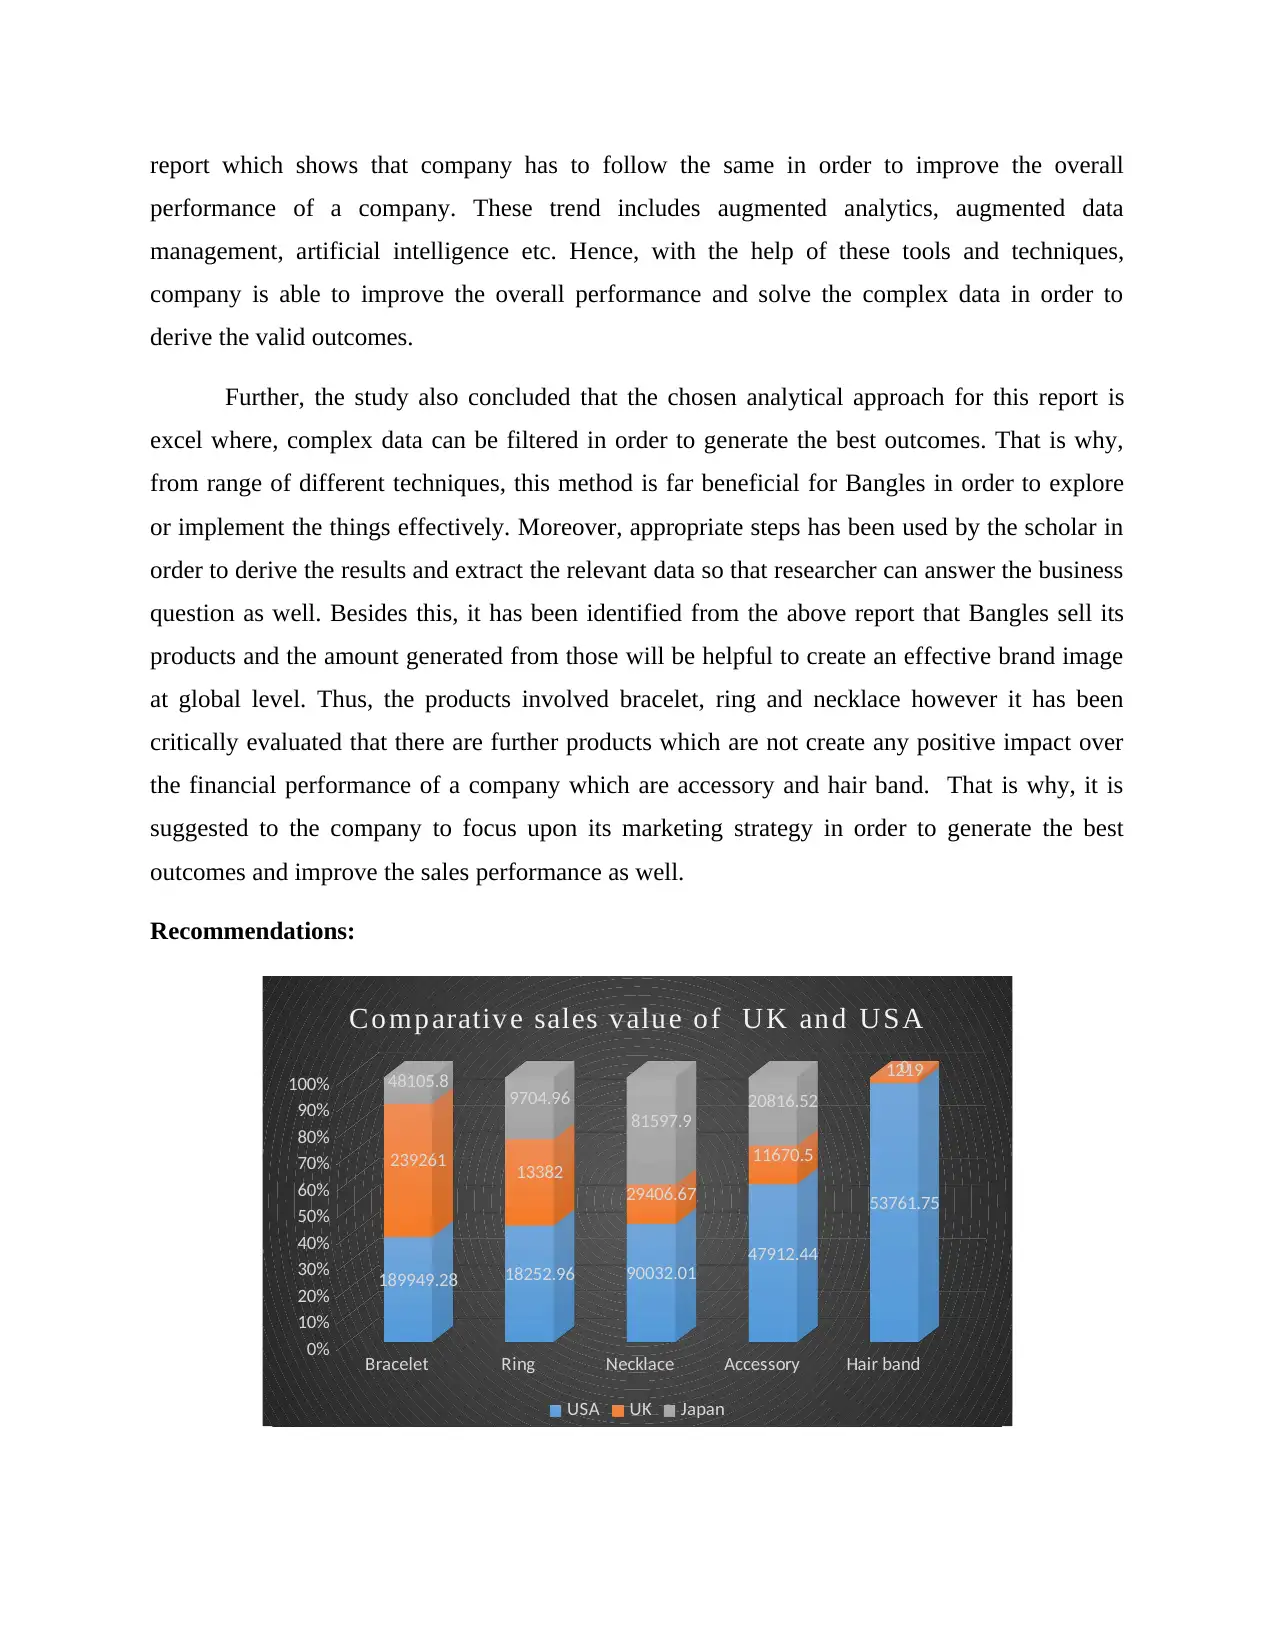
Recommendations:
Bracelet Ring Necklace Accessory Hair band
0%
10%
20%
30%
40%
50%
60%
70%
80%
90%
100%
189949.28 18252.96 90032.01
47912.44
53761.75
239261 13382
29406.67
11670.5
1219
48105.8 9704.96
81597.9
20816.52
0
Co mp arativ e sales valu e o f UK an d USA
USA UK Japan
performance of a company. These trend includes augmented analytics, augmented data
management, artificial intelligence etc. Hence, with the help of these tools and techniques,
company is able to improve the overall performance and solve the complex data in order to
derive the valid outcomes.
Further, the study also concluded that the chosen analytical approach for this report is
excel where, complex data can be filtered in order to generate the best outcomes. That is why,
from range of different techniques, this method is far beneficial for Bangles in order to explore
or implement the things effectively. Moreover, appropriate steps has been used by the scholar in
order to derive the results and extract the relevant data so that researcher can answer the business
question as well. Besides this, it has been identified from the above report that Bangles sell its
products and the amount generated from those will be helpful to create an effective brand image
at global level. Thus, the products involved bracelet, ring and necklace however it has been
critically evaluated that there are further products which are not create any positive impact over
the financial performance of a company which are accessory and hair band. That is why, it is
suggested to the company to focus upon its marketing strategy in order to generate the best
outcomes and improve the sales performance as well.
Recommendations:
Bracelet Ring Necklace Accessory Hair band
0%
10%
20%
30%
40%
50%
60%
70%
80%
90%
100%
189949.28 18252.96 90032.01
47912.44
53761.75
239261 13382
29406.67
11670.5
1219
48105.8 9704.96
81597.9
20816.52
0
Co mp arativ e sales valu e o f UK an d USA
USA UK Japan
Paraphrase This Document
Need a fresh take? Get an instant paraphrase of this document with our AI Paraphraser
As per the above graph, it has been clearly reflected that sales value of UK regarding
bracelet is high as compared to other two countries. This in turn also shows that sales value of
Bracelet has contributed the most in order to improve the overall performance of Bangles.
However, it has been critically evaluated that sales of accessory, hair band has created a negative
impact over the performance of a company because there is low sales volume identified within
quoted business (Carmon and Ben-Dor, 2017). Thus, there are different ways suggested to the
company which are as mentioned below:
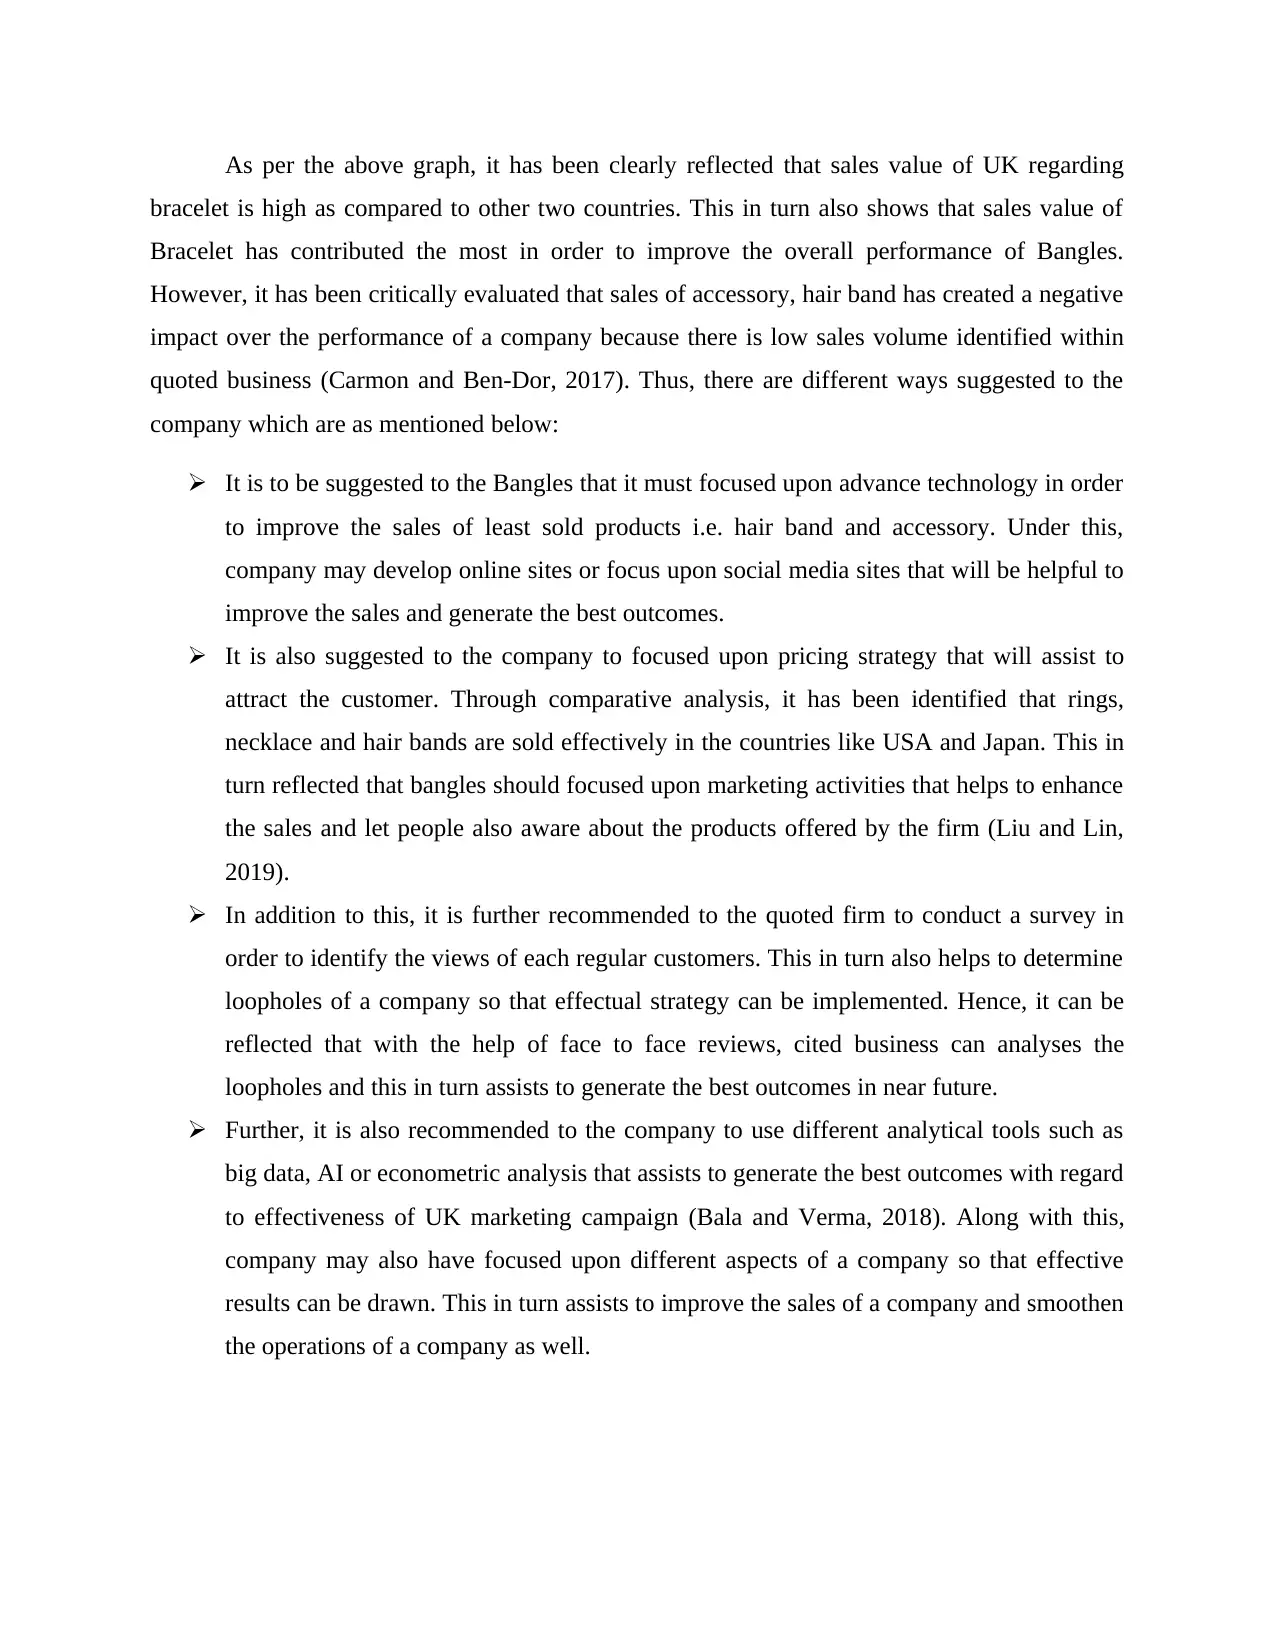
It is to be suggested to the Bangles that it must focused upon advance technology in order
to improve the sales of least sold products i.e. hair band and accessory. Under this,
company may develop online sites or focus upon social media sites that will be helpful to
improve the sales and generate the best outcomes.
It is also suggested to the company to focused upon pricing strategy that will assist to
attract the customer. Through comparative analysis, it has been identified that rings,
necklace and hair bands are sold effectively in the countries like USA and Japan. This in
turn reflected that bangles should focused upon marketing activities that helps to enhance
the sales and let people also aware about the products offered by the firm (Liu and Lin,
2019).
In addition to this, it is further recommended to the quoted firm to conduct a survey in
order to identify the views of each regular customers. This in turn also helps to determine
loopholes of a company so that effectual strategy can be implemented. Hence, it can be
reflected that with the help of face to face reviews, cited business can analyses the
loopholes and this in turn assists to generate the best outcomes in near future.
Further, it is also recommended to the company to use different analytical tools such as
big data, AI or econometric analysis that assists to generate the best outcomes with regard
to effectiveness of UK marketing campaign (Bala and Verma, 2018). Along with this,
company may also have focused upon different aspects of a company so that effective
results can be drawn. This in turn assists to improve the sales of a company and smoothen
the operations of a company as well.
bracelet is high as compared to other two countries. This in turn also shows that sales value of
Bracelet has contributed the most in order to improve the overall performance of Bangles.
However, it has been critically evaluated that sales of accessory, hair band has created a negative
impact over the performance of a company because there is low sales volume identified within
quoted business (Carmon and Ben-Dor, 2017). Thus, there are different ways suggested to the
company which are as mentioned below:
It is to be suggested to the Bangles that it must focused upon advance technology in order
to improve the sales of least sold products i.e. hair band and accessory. Under this,
company may develop online sites or focus upon social media sites that will be helpful to
improve the sales and generate the best outcomes.
It is also suggested to the company to focused upon pricing strategy that will assist to
attract the customer. Through comparative analysis, it has been identified that rings,
necklace and hair bands are sold effectively in the countries like USA and Japan. This in
turn reflected that bangles should focused upon marketing activities that helps to enhance
the sales and let people also aware about the products offered by the firm (Liu and Lin,
2019).
In addition to this, it is further recommended to the quoted firm to conduct a survey in
order to identify the views of each regular customers. This in turn also helps to determine
loopholes of a company so that effectual strategy can be implemented. Hence, it can be
reflected that with the help of face to face reviews, cited business can analyses the
loopholes and this in turn assists to generate the best outcomes in near future.
Further, it is also recommended to the company to use different analytical tools such as
big data, AI or econometric analysis that assists to generate the best outcomes with regard
to effectiveness of UK marketing campaign (Bala and Verma, 2018). Along with this,
company may also have focused upon different aspects of a company so that effective
results can be drawn. This in turn assists to improve the sales of a company and smoothen
the operations of a company as well.
ii) Presenting the effectiveness of using econometric analysis
With the changing era, companies must have to use other alternatives of data analysis
approaches in order to improve the system such as Econometric analysis. It is the statistical as
well as mathematical analysis of economic relationship which often serve as a basis for
forecasting within a business (What is econometrics? Types, stages and functions, 2020). This
model mainly used by government in order to set the economic policy and private business to
help in decision making process regarding the prices and inventory. It only relies upon statistical
methods like quantitative data in order to develop theories and assists retail business to forecast
future economic or financial trends as well. Thus, with the help of this model, company can
estimate the parameters of the model and quantify the economic phenomena as well.
Along with this, it has been analyzed that the model assists to minimize the risk and
predict the outcomes with effective probability to so that it will assist to make the decision
process easier. Further, better resource allocation decision is another benefit which Bangles may
gain by using econometric data analysis method such that it will helps in forecasting of demand
for services so that it assists to delegate the staff resources in appropriate manner (Müller, Fay
and Vom Brocke, 2018). As the data analysis tool is comprises with range of different techniques
which includes linear regression, logistic regression, ARIMA & VAR model for time-series etc.
This in turn assists to improve the results of the company in positive manner. Hence, it can be
stated that through this model, company is able to use the tools which in turn assists to extract
useful information regarding any important economic policy issues from the existing available
data.
In addition to this, by applying the defined analytical method, organization can easily
manage the overall performance of a company and helps in forecasting as well. Further, it can be
critically argued that using this method, organization may sometimes have criticized for relying
too heavily on an interpretation of raw data which might be not understood. This in turn causes
negative impact over the business performance and also affect the overall performance in
negative manner as well (Cosmas, Chitedze and Mourad, 2019). Moreover, due to its
multicollinearity issues, Bangles may not affect uses the same model and this further affect the
results in adverse way. However, its effectiveness clearly reflected that the model is beneficial
⊘ This is a preview!⊘
Do you want full access?
Subscribe today to unlock all pages.
Trusted by 1+ million students worldwide

for quoted firm because it assists in forecasting and this in turn causes direct impact over the
business as well.
business as well.
Paraphrase This Document
Need a fresh take? Get an instant paraphrase of this document with our AI Paraphraser
REFERENCES
Books and Journals
Alkhouli, M. and et.al., 2020. Trends in characteristics and outcomes of hospital inpatients
undergoing coronary revascularization in the United States, 2003-2016. JAMA network
open. 3(2). pp.e1921326-e1921326.
Bala, M. and Verma, D., 2018. A critical review of digital marketing. M. Bala, D. Verma (2018).
A Critical Review of Digital Marketing. International Journal of Management, IT &
Engineering. 8(10). pp.321-339.
Carmon, N. and Ben-Dor, E., 2017. An advanced analytical approach for spectral-based
modelling of soil properties. Int. J. Emerg. Technol. Adv. Eng. 7. pp.90-97.
Cosmas, N. C., Chitedze, I. and Mourad, K. A., 2019. An econometric analysis of the
macroeconomic determinants of carbon dioxide emissions in Nigeria. Science of the Total
Environment. 675. pp.313-324.
Danielson, W. A. and Lasorsa, D. L., 2020. Perceptions of social change: 100 years of front-page
content in The New York Times and The Los Angeles Times. In Text Analysis for the
Social Sciences (pp. 103-116). Routledge.
Dudel, C. and et.al., 2020. Monitoring trends and differences in COVID-19 case-fatality rates
using decomposition methods: Contributions of age structure and age-specific
fatality. PLOS one. 15(9). p.e0238904.
Huang, L. and et.al., 2020. Trends in global research in forest carbon sequestration: A
bibliometric analysis. Journal of Cleaner Production. 252. p.119908.
Liu, K. and Lin, B., 2019. Research on influencing factors of environmental pollution in China:
A spatial econometric analysis. Journal of Cleaner Production. 206. pp.356-364.
Müller, O., Fay, M. and Vom Brocke, J., 2018. The effect of big data and analytics on firm
performance: An econometric analysis considering industry characteristics. Journal of
Management Information Systems. 35(2). pp.488-509.
Yao, Y. and et.al., 2021. Analytical approach for the design of flexural elements made of
reinforced ultra‐high performance concrete. Structural Concrete. 22(1). pp.298-317.
Online
What is econometrics? Types, stages and functions. 2020. [Online]. Available through:
<https://www.analyticssteps.com/blogs/what-econometrics-types-stages-and-functions>.
1 out of 11
Related Documents


Your All-in-One AI-Powered Toolkit for Academic Success.
+13062052269
info@desklib.com
Available 24*7 on WhatsApp / Email
![[object Object]](/_next/static/media/star-bottom.7253800d.svg)
Unlock your academic potential
Copyright © 2020–2026 A2Z Services. All Rights Reserved. Developed and managed by ZUCOL.